Download to read offline
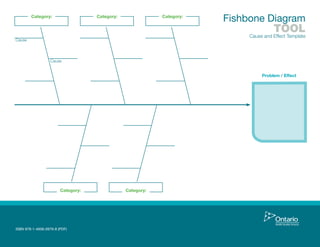
The document describes a Fishbone Diagram, which is a tool used to visualize causes and effects. A Fishbone Diagram maps out potential factors that contribute to an overall problem or effect by breaking down causes into major categories and sub-causes. It provides a structured way to brainstorm, organize, and present the relationships between a given problem or effect and potential contributing factors or causes.


