Download as PDF, PPTX


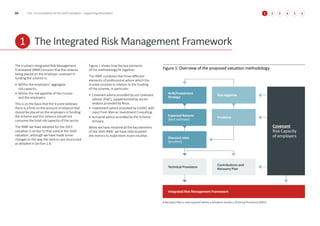


This document provides supporting information for a consultation on the proposed methodology and assumptions for the USS Retirement Income Builder Section's 2023 valuation. It discusses the Integrated Risk Management Framework used, including the key elements of self-sufficiency, Affordable Risk Capacity, Available Risk Capacity, Limit of Reliance, and Transition Risk. It also provides details on the employer covenant analysis, investment modelling assumptions, membership data, and reconciliation from the 2020 valuation. Metrics of Actual Reliance and Target Reliance are presented within green status.


