1. SAUDI ARABIA
OMAN
20 km
N
Main Road
Shoreline
Emirates Boundaries
International Boundaries
Town
0 - 10 m amsl
10 - 20
20 - 40
40 - 60
60 - 80
80 - 100
100 - 150
150 - 200
200 - 250
250 - 350
350 - 600
600 - 1000
> 1000
OMAN
A R A B I A N G U L F
GULF
OF
OMAN
Sir Bani Yas
Island
Dalma Island
Jabal Dhanah
Sila
Ruwais
Habshan
Mirfa
Tarif
Khor Al Bazm
Madynat Zayed
Mezairaa
Al Quaa
Al Wagan
Al Khatam
Bu Samra
Sewihan
Al Ain
Al Hayir
Faqa
Al Shuwaib
Marqab
Margham
Al Hibab
Maliha
Al Dhayd
Falaj Al
Mulla
Massafi
Kalba
Fujairah
Khor
Fakkan
Dibba
Ghalilah
Khor Khwair
Al Rams
Ras Al Khaimah
Um Al Qiwain
Ajman
Sharjah
Dubai
Jabal Ali
Ras Ghanadah
Sadyat Island
ABU DHABI
Dabiyah
Al Khaznah
Abu Al Abyad
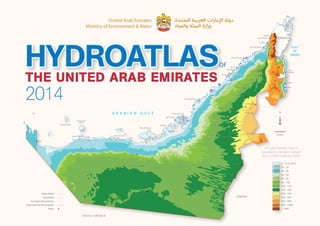
XYZ grid thematic map of
topographic elevation derived
from a DEM model by USGS
2014
اﻟﻤﺘﺤﺪة اﻟﻌﺮﺑﻴﺔ اﻹﻣﺎرات دوﻟﺔ
واﻟﻤﻴﺎه اﻟﺒﻴﺌﺔ وزارة
United Arab Emirates
Ministry of Environment & Water
HYDROATLASOF
THE UNITED ARAB EMIRATES
2. L I S T O F C O N T R I B U T O R S
United Arab Emirates University
Dr. Mohsen Sherif, Civil and Environmental Engineering Department, PI.
Mr. Ampar Shetty, Civil and Environmental Engineering Department, Hydrogeologist,
Mr. Muhammad Sherif, Civil and Environmental Engineering Department, IT Specialist
Mr. Hamdi Kandil, GIS and Remote Sensing Expert
Ministry of Environment and Water
Dr. Mohammed Mustafa Al Mulla, Director of Water Resources Department
Mr. Salem Fareed Akram, Director of Dams Section
Mrs. Nada Butti Al Suweidi, Head of Water Resources Evaluation Department
Dr. Abdel Azim M. Ebraheem, Consultant of Water Resources Evaluation
Mr. Nasser Al Safari, Geologist, Water Resources Division
Dr. Osama Awad, Hydrogeology Consultant
Design and Cartography
Hamdi Kandil
This work is subject to copyright. All rights are reserved by the Ministry of Environment and Water and the United Arab Emirates University,
whether the whole or part of the material is concerned, specifically the rights translation, reprinting, and reuse of illustrations.
No material, including text, figures and tables can be used without having a prior written approval.
This document should be cited as MEW, 2014. HydroAtlas of United Arab Emirates - Ministry of Environment and Water, Dubai, UAE
اﻟﻤﺘﺤﺪة اﻟﻌﺮﺑﻴﺔ اﻹﻣﺎرات دوﻟﺔ
واﻟﻤﻴﺎه اﻟﺒﻴﺌﺔ وزارة
United Arab Emirates
Ministry of Environment & Water
3. T A B L E O F C O N T E N T S
vi
W A T E R A V A I L A B I L I T Y A N D W A T E R B U D G E T 7 99
F U T U R E G R O U N D W A T E R D E V E L O P M E N T P O T E N T I A L I T Y 8 710
Figure 9.4 Percentage of reuse of treated water 85
Figure 9.5 Water use distribution by demand sectors 85
Figure 9.6 Water use distribution by Emirates 86
Figure 9.7 Groundwater distributions 86
Figure 9.8 Desalinated Water distributions 86
Table 9.1 Groundwater reserve in the Surficial aquifer in UAE 81
Table 9.2 Groundwater reserve in the carbonate aquifers in UAE 82
Table 9.3 Summary of desalination plants in 2010 82
Table 9.4 Summary of treated waste water use in 2010 84
Table 9.5 Water demand and supply in the different sectors in 2009 85
Table 9.6 Use of water resources by water demand sectors 86
9.1 Conventional Water Resources 81
Surface water 81
Groundwater 82
9.2 None Conventional Water Resources 82
Desalination 82
9.3 Reclaimed or Treated Water 84
9.4 Virtual Water 85
Water use 85
Figure 9.1 Abu Dhabi’s desalinated water distribution network 83
Figure 9.2 Percentage of desalination installation in UAE 84
Figure 9.3 Treated and reused water in the Emirates 84
Figure 10.4 Location maps of areas in which farms irrigation is 3 to 4 folds the
needed crop requirements 93
10.2 Groundwater Vulnerability 94
Figure 10.5 Groundwater vlunerability map of UAE 94
10.1 Groundwater Potentiality 89
Figure 10.1 Areal distribution of fresh groundwater resources in 2012 89
Figure 10.2 Location map of open-field farms and the four well permit zones 91
Figure 10.3 location map of the forests in UAE 92
G R O U N D W A T E R M A P P I N G U S I N G E A R T H R E S I S T I V I T Y I M A G I N G 7 18 Introuction 73
Unconsolidated Sediments Aquifers 73
Alluvial Gravels Aquifer 73
Sandy Desert Aquifer 74
Fractured Rock Aquifers 75
Carbonate Aquifer 75
Igneous and Metamorphic Aquifer 75
Delineation of Saltwater Intrusion in the Coastal Aquifers 77
Figure 8.1. Hydrogeological map of the study area 73
Figures 8.2-8.7. Results of 2D Earth Resistivity modeling for Profiles P-1 to P-5B 74-76
Figure 8.8. Lithological log of GP-12 MW located near Profile P-5 76
Figure 8.9. Lithological log of Khatt production well (KP-1) near Profile P-3 76
Figure 8.10. Results of 2D Earth Resistivity modeling for Profile P-6 76
Figure 8.11.Lithological log of BHF-10 MW located in the middle of Profile P-6 77
Figure 8.12. Empirical relationship between water and earth resistivities 77
Figure 8.13. Empirical relationship between TDS and earth resistivity 77
Figure 8.14. Empirical relationship between water specific electrical
conductivity (µmho/cm) and TDS (mg/l) 77
Figure 8.15. Results of 2D Earth Resistivity modeling for Profile P-7 77
L I S T O F R E F E R E N C E S 9 7
4. Figure 1.7 Areal distribution of mean annual maximum 24-h rainfall
L O C A T I O N A N D C L I M A T E
11 The mean monthly, maximum monthly
and minimum monthly values of
temperature are shown in Figure 1.8.
The monthly minimum temperature
occurs during the month of December,
January and February and is between
7oC and 8oC. However, average
temperature in the coldest month of
January is around 18oC. The monthly
maximum temperature starts from May
to August and is in the range of 45oC
and 48oC. However, monthly maximum
temperature recorded more than 50oC
in some years. The land-sea breeze
circulation dominates the wind regime
for most of the period. The sea breeze
brings cool air from sea to land but the
associated increase in humidity keeps
the weather conditions uncomfortable.
Earlier in summer, during May and June,
a north-westerly flow of air develops
over the Arabian Gulf in response to a
trough of low pressure (Indian
Monsoon) across Pakistan and into Iran.
This condition is known as the summer
shamal which delivers relatively cold air,
so it brings relief from the very hot
weather conditions. Local instabilities
can produce thunderstorms which
usually provide light rainfall, especially
over the neighboring Oman Mountains
(Membury, 1982 and Perrone, 1979).
52o E
23oN24oN25oN26oN
24oN25oN
53o E 54o E 55o E
23oN
56o E
52o E 53o E 54o E 55o E 56o E
50 km
A R A B I A N G U L F
S A U D I A R A B I A
O M A N
Q ATA R
BAHRAIN
KUWAIT
I R A Q
I R A N
G U L F O F O M A N
UNITED ARAB
EMIRATES
OMAN
SAUDI ARABIA
A R A B I A N G U L F
GULF
OF
OMAN
OMAN
اﻟﻤﺘﺤﺪة اﻟﻌﺮﺑﻴﺔ اﻹﻣﺎرات دوﻟﺔ
واﻟﻤﻴﺎه اﻟﺒﻴﺌﺔ وزارة
United Arab Emirates
Ministry of Environment & Water
20 km
N
Location Map
48o
E
22o
N
26o
N
30o
N
52o
E 56o
E 60o
E
Al Ain
Main Road
Shoreline
Emirates Boundaries
International Boundaries
Town
L E G E N D
23 - 25 mm
26 - 27
28
29 - 30
31 -32
33 - 34
35 - 36
37 - 38
39 - 40
41 - 42
43
44 - 45
46 - 47
48- 49
50 - 51
52 - 53
54 - 55
56 - 57
58 - 59
60
Sir Bani Yas
Island
Dalma Island
Jabal Dhanah
Sila
Ruwais
Habshan
Mirfa
Tarif
Khor Al Bazm
Madynat Zayed
Mezairaa
Al Quaa
Al Wagan
Al Khatam
Bu Samra
Sewihan
Al Ain
Al Hayir
Faqa
Al Shuwaib
Marqab
Margham
Al Hibab
Maliha
Al Dhayd
Falaj Al
Mulla
Massafi
Kalba
Fujairah
Khor
Fakkan
Dibba
Ghalilah
Khor Khwair
Al Rams
Ras Al Khaimah
Um Al Qiwain
Ajman
Sharjah
Dubai
Jabal Ali
Ras Ghanadah
Sadyat Island
ABU DHABI
Dabiyah
Al Khaznah
Abu Al Abyad
5. 20
Figure 2.6 Stratigraphic section A-A’ in the
western structural region of Abu Dhabi
Emirate (after NDC and USGS, 1996)
GWP-87
GWP-87
GWP-81
GWP-101
GWP-99
GWP-98GWP-97GWP-106
GWP-104
GWP-129
GWP-94
GWP-100
GWP-142
GWP-141GWP-149
GWP-148
SEA LEVEL
200 m
200
400
600
800
1000
1200
1400
1600
ALTITUDE
SEA LEVEL
200 m
200
400
600
800
1000
1200
1400
1600
E A S TW E S T
A A`
30 KM
Upper Unit
QUATERNARY
MIOCENE
OLIGOCENE
EOCENE
Undifferentiated Dune Sand
and Interdunal Sabkha Deposits
Anhydrite Layer
GWP-87
Borehole Location and GWP Well Number
Stratigraphic Contact - Shows approximate
boundary between geologi formations.
Dashed where inferred
Line of Stratigraphic Section
Lower Unit
Sabkha and Innterdunal Fluvial Deposits
Upper Fars Formation Equivalent (Mudstone)
Lower Fars Formation Equivalent (Evaporite)
Lower Fars Formation (Evaporite)
Oligo-Miocene Clastics Units
Asmari Formation (Limestone)
Dammam Formation (Limestone)
Abu Dhabi
UNITED ARAB EMIRATES
50 km
N
A
A
A`
A`
G E O L O G I C A L S E T T I N G
The Emirate of Abu Dhabi may be
divided into eastern and western
structural regions. The western
structural region encompasses western
and central parts of the Emirate and
includes the relatively stable Arabian
Shelf Province and Rub Al Khali Basin.
The eastern structural region
geographically includes the eastern
part of the Emirate of Abu Ohabi,
underlain by the eastern edge of the
Arabian Shelf and the Oman Mountain
Foredeep (Foreland Mobile Belt)
Provinces