2021 Healthcare & Bio Life Science Year End Market Report
•
0 likes•145 views

Market Report for Healthcare Real Estate and Bio Life Science.

Recommended
Recommended
More Related Content
Similar to 2021 Healthcare & Bio Life Science Year End Market Report
Similar to 2021 Healthcare & Bio Life Science Year End Market Report (20)
More from The TICI Group of Companies
More from The TICI Group of Companies (14)
Recently uploaded
Recently uploaded (20)
2021 Healthcare & Bio Life Science Year End Market Report
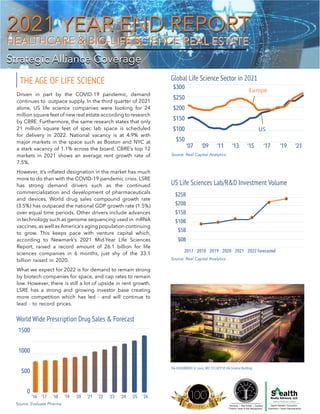
- 1. $25B $20B $15B $10B $5B $0B 2017 2018 2019 2020 2021 2022 Forecasted Disposition I Tenant Representation Capitol Mar ets I isition inan e I sset Ris Mana e ent siness I Real state I a ilities Strategic Alliance Coverage Strategic Alliance Coverage HEALTHCARE & BIO-LIFE SCIENCE REAL ESTATE HEALTHCARE & BIO-LIFE SCIENCE REAL ESTATE 2021 YEAR END REPORT 2021 YEAR END REPORT THE AGE OF LIFE SCIENCE Driven in part by the COVID-19 pandemic, demand continues to outpace supply. In the third quarter of 2021 alone, US life science companies were looking for 24 million square feet of new real estate according to research by CBRE. Furthermore, the same research states that only 21 million square feet of spec lab space is scheduled for delivery in 2022. National vacancy is at 4.9% with major markets in the space such as Boston and NYC at a stark vacancy of 1.1% across the board. CBRE’s top 12 markets in 2021 shows an average rent growth rate of 7.5%. However, it’s inflated designation in the market has much more to do than with the COVID-19 pandemic crisis. LSRE has strong demand drivers such as the continued commercialization and development of pharmaceuticals and devices. World drug sales compound growth rate (3.5%) has outpaced the national GDP growth rate (1.5%) over equal time periods. Other drivers include advances in technology such as genome sequencing used in mRNA vaccines,as well as America's aging population continuing to grow. This keeps pace with venture capital which, according to Newmark’s 2021 Mid-Year Life Sciences Report, raised a record amount of 2 .1 billion for life sciences companies in months, just shy of the 33.1 billion raised in 2020. What we e pect for 2022 is for demand to remain strong by biotech companies for space, and cap rates to remain low. However, there is still a lot of upside in rent growth. LSRE has a strong and growing investor base creating more competition which has led - and will continue to lead - to record prices. Europe US ‘07 ‘09 ‘11 ‘13 ‘15 ‘17 ‘19 ‘21 $300 $250 $200 $150 $100 $50 Source: Real Capital Anal tic Source: Real Capital Anal tic Source: aluate ar a Global Life Science Sector in 2021 World Wide Prescription Drug Sales & Forecast US Life Sciences Lab/R&D Investment Volume 1500 1000 500 0 ‘16 ‘17 ‘18 ‘19 ‘20 ‘21 ‘22 ‘23 ‘24 ‘25 ‘26 The EDGE@BRDG St. Louis, MO 151,829 SF Life Science Building 19 1
- 2. KENDALL SQUARE Buyer: Heatlhpeak Properties Seller: Clarion Partners $180M Boston THE BEAT Buyer: Longfellow Real Estate Partners Seller: PS Business Parks $315M San Diego 1800 OWENS STREET Buyer: KKR Seller: Kilroy Realty Corporation $1.1B San Francisco 401 PARK DRIVE Buyer: Alexandria Real Estate Equities Seller: Samuel Associates $1.5B Boston GENESIS MARINA Buyer: Sterling Bay Seller: City Office REIT $576M San Diego THE AGE OF LIFE SCIENCE THE AGE OF LIFE SCIENCE Cities with an Educated Workforce PREFERRED MARKETS WHATS AHEAD FOR 2022: NOTABLE LIFE SCIENCE TRANSACTIONS 2 Strategic Alliance Coverage | Year End Report | Second Half 2021 | Texas International Consultants,Incorporated | Stealth Realty Advisors,LLC Historically, life science tenants are attracted to markets with highly educated workforces, tier one universities, and funding sources. This can easily be seen by the three largest life science markets in the nation- Boston, San Diego and San Francisco - which currently make up more than 50% of all life science space in the US. However, Raleigh-Durham, Philadelphia, and Washington D.C. are elding rapid growth, and the Sun Belt cities of Houston, Dallas, Atlanta, and Phoeni are surprising contenders as well, according to CBRE. BARRIERS TO ENTRY Specialized Knowledge Life science real estate is priced at spreads that are similar to other property types with strong demand drivers and keen investor interest. Strong demand for space from biotech and other companies should continue to drive rent growth and total returns despite the low cap rates. Although the overall size of the sector is limited, institutional investors that can develop relationships with operators who have e pertise in the right markets should continue to nd opportunities and generate attractive returns. Sou ce t ic Sisson,Bisno tion l
- 3. STATE OF THE MARKET STATE OF THE MARKET 3 Strategic Alliance Coverage | Year End Report | Second Half 2021 | Texas International Consultants,Incorporated | Stealth Realty Advisors,LLC BEHAVIORAL HEALTH ON THE RISE AMBULATORY SURGERY ENTERS Staffing: 2021 saw an astronomical rise in ASC companies as they added thousands of physicians to their staf ng pool, fueling momentum for a big 2022. According to Beckers ASC Review, the three largest ASC companies in the nation, USPI, OPTUM and Surgical Care Af liates, all acquired physicians in 2021. Consolidation While these major ASC companies were acquiring physicians they were also consolidating by acquiring smaller companies and already established ASCs. A prime e ample of this was Tenet’s purchasing over 130 Surgery Center ASCs which e ceeded 2 Billion. Comp tition: As these acquisitions continue to happen new competitors are entering the market. These include private equity groups, and hospitals that are getting more serious about outpatient care. E isting ASCs are feeling the heat as the competitors that are buying their way in will chase the remaining free surgeons. S Sp iali ation: As more competition enters the market and more ASCs open, specialization for comple cases becomes imperative to set centers apart from one another. E amplesof theseinclude,butarenotlimitedto,orthopedic and cardiology. Realestateinvestorsandfundsacrossthenationareflocking to the upside potential of acquiring ASCs. Hammes Co., a major player in the healthcare real estate market, just raised 325M for their new value-add healthcare real estate fund. Titled HAMMES IV, the fund speci cally focuses on investment in ASCs and medical of ce. When tying in the institutional interest with growing private equity entering the market, values are inflating for ASCs and sellers are becoming more and more willing to sell, only furthering transaction volume for ASCs. Reported by A National Council for Mental Wellbeing, a 2020 study stated that behavioral health companies e pect a 54% increase in demand for mental health services.This led to a major boom in demand for behavioral health tenanted properties in 2021 and we e pect this to continue in 2022. Investors are looking at both e isting healthcare & non-healthcare buildings to retro t as well as ground up construction to feed this demand. Hospitals are also jumping on board by converting on campus buildings as well joint ventures with operators of nearby facilities. Major healthcare investor Meridian is e panding to become one of the major players in behavioral health. CEO ohn Pollock recently stated that t he stigma is nally declining, and we are seeing numerous requirements. The stress, isolation and loss caused by the pandemic was the nal straw and it is now widely known that behavioral health conditions impact one in four Americans. Institutional investors have also started looking with favor to the behavioral health trend. Institutional investors have warmed up to having behavioral health tenants in their buildings and portfolios, and we have even seen cap rates move toward traditional medical of ce building valuations, says Pollock. e o t Lio Medic l ente , e o t Be ch, 1 ,51 SF 512 Leg c D i e, l no T Lionstone Investments, a new medical of ce buyer that has just entered the market has acquired Newport Lido Medical Center as its rst purchase, which is a two building comple that houses two separate ACS’s totaling 14 ,510 square feet in Newport Beach, Calif. The buyer paid 125 million for the fully leased asset through an all- cash transaction. Ventas has purchased a 101, 0 -square-foot healthcare facility in Plano, T for 5 million from Cawley Partners. The three-story property,located at 5120 Legacy Dr.,is fully-leased to Denver-based, Eating Recovery Center. The tenant utilizes the facility for both inpatient and outpatient eating disorder treatment.
- 4. Top 10 Markets for MOB Transaction Volume STATE OF THE MARKET STATE OF THE MARKET 4 Strategic Alliance Coverage | Year End Report | Second Half 2021 | Texas International Consultants,Incorporated | Stealth Realty Advisors,LLC Medical of ce has continued to be resilient and a demand asset class throughout 2021. We do not e pect this to change in 2022. According to data acquired by Revista, with interest rates and completions staying low, cap rates have continued to compress. The median cap rate for medical of ce started at a flat % in 1 and dropped by 30 bps by the end of the year. Although 2022 e pects a number of interest rate hikes by the Federal Reserve, medical of ce has too much momentum to be signi cantly affected. There is a lack of inventory and the delay on new construction completions will only e acerbate the tight market. Over the pandemic era (2020-2022), absorptions have far outpaced completions and occupancy is reaching a high of 92%, passing the mark set in 201 . As e pected, the top markets in transaction volume for 4 of 2021 were the usual suspects. All major metros and booming educational epicenters who undoubtedly already have a strong medical of ce base were complemented by the massive influ of life science and behavioral tenants entering the market. Sou ce Re ist ost Annual Volume SF TTM AVG $/SF AVG Cap Rate/Yield US Top 100 Top 50 Los Angeles Phoenix New York Atlanta Dallas San Diego San Francisco Houston Miami Boston $15,290.4 M $12,414.1M $10,762.7M $815.6M $633.2M $564.4M $561.9M $557.0M $501.5M $379.0M $372.0M $369.8M $350.3M 43.7M 35.8M 30.6M 1.5M 1.8M 1.7M 1.9M 1.7M 1.1M 0.4M 1.1M 1.3M 0.8M $371 $373 $378 $532 $377 $391 $330 $368 $439 $607 $441 $241 $416 6.2 6.1 6.0 5.3 6.1 6.2 6.3 5.6 6.1 4.2 6.6 6.2 6.0 MOB Occupancy Rises Across Top 50 Metros CAP Rates Compressing in 2021 Sou ce Re ist Sou ce Re ist Sou ce Re ist 2019 2018 2020 2021 2022 8.0M 7.0M 6.0M 5.0M 4.0M 3.0M 2.0M 1.0M 0.0M 93.0 92.0 91.0 90.0 89.0 88.0 Absorption SF Quarterly Completed SF Occupancy Rate % Quarterly Absorption, Completions (actual & expected), Occupancy (%) Top 50 Metros, MOB’s 7,500 SF Square Feet Occupancy % 1Q 2018 2Q 2018 3Q 2018 4Q 2018 6.7 6.9 7.0 7.1 6.7 6.5 6.7 6.8 6.2 6.8 6.6 6.6 6.8 6.7 6.6 6.7 6.0 6.2 6.5 6.4 6.6 6.2 6.2 6.2 6.1 6.3 6.1 5.9 6.0 5.8 5.7 5.7 4.6 5.1 5.4 5.4 5.8 5.8 5.7 5.6 5.4 5.7 5.6 5.5 5.2 5.2 5.2 5.2 4.6 4.4 4.6 4.8 5.2 5.4 5.2 5.1 5.1 5.3 5.2 5.2 5.0 4.5 4.6 4.6 1Q 2021 2Q 2021 3Q 2021 4Q 2021 1Q 2020 2Q 2020 3Q 2020 4Q 2020 1Q 2019 2Q 2019 3Q 2019 4Q 2019 25th Percentile Median 5th Percentile 75th Percentile Cap Rates (Non-Weighted) Top 100 Metros 6.11 % (0.0%) -15% -10% -5% 0% 5% 10% 15% 0% 1% 2% 3% 4% 5% % % % % Birmingham, AL Phoenix, A Los Angeles, CA De n er, CO Baltimore, MD Washington DC, MD Miami, FL Tampa, FL Orlando, FL ackson ille, FL Atlanta, GA Columbus, OH New Orleans, LA Las Vegas, NV Charlotte, NC Nash ille, TN Knox ille, TN Dallas , T Houston, T Austin, T Richmond, VA Top 50 Metros Top 100 Metros Cap Rates % Change (QoQ) ME I AL O I E hild ens linic in ood u Minnesot
- 5. STATE OF THE MARKET STATE OF THE MARKET 5 Strategic Alliance Coverage | Year End Report | Second Half 2021 | Texas International Consultants,Incorporated | Stealth Realty Advisors,LLC -100% -50% 0% 50% 100% 150% 200% 250% 300% 350% 400% Birmingham, AL Phoenix, AZ Los Angeles, CA Denver, CO Baltimore, MD Washington DC, MD Miami, FL Tampa, FL Orlando, FL Jacksonville, FL Atlanta, GA Columbus, OH New Orleans, LA Las Vegas, NV Charlotte, NC Nashville, TN Knoxville, TN Dallas, TX Houston, TX Austin, TX Richmond, VA Top 50 Metros Top 100 Metros % Growth Source: Re i ta Co tar Source: Re i ta Co tar Transaction Volume Growth (QoQ) Price Per Square Foot ($/SF) 2021 Market NNN Rent vs Rent Growth 2021 Market Vacancy vs % Change Top 100 Metros 379 PSF ( 9.90%) -100% -80% -60% -40% -20% 0% 20% 40% 60% 80% 100% 100 150 200 250 300 350 400 450 500 Birmingham, AL Phoenix, AZ Los Angeles, CA Denver, CO Baltimore, MD Washington DC,MD Miami, FL Tampa, FL Orlando,FL Jacksonville, FL Atlanta, A Col m s, O e Orleans, LA Las egas, Charlotte, C ashville, T noxville, T Dallas, T o ston, T A stin, T ichmond, A Top Metros Top Metros PricePerSquareFoot %Change(QoQ) Top 100 Metros $22.55 (1.7 -1.00% 0.00% 1.00% 2.00% 3.00% 4.00% $0.00 $5.00 $10.00 $15.00 $20.00 $25.00 $30.00 $35.00 $40.00 $45.00 Birmingham, AL Phoenix, AZ Los Angeles, CA Denver, CO Baltimore, MD Washington DC, MD Miami, FL Tampa, FL Orlando, FL Jacksonville, FL Atlanta, GA Columbus, OH New Orleans, LA Las Vegas, NV Charlotte, NC Nashville, TN Knoxville, TN Dallas, TX Houston, TX Austin, TX Richmond, VA Top 50 Metros Top 100 Metros Average ent ro th A erage NNN Rent Growth Vacancy Rent Growth Source: Re i ta Co tar Source: Re i ta Co tar A AC -5.00% -3.00% -1.00% 1.00% 3.00% 5.00% 0.00% 2.00% 4.00% 6.00% 8.00% 10.00% 12.00% 14.00% 16.00% 18.00% 20.00% Birmingham, AL Phoenix, AZ Los Angeles, CA Den er, C Bal imore, D ashing on DC, D iami, L am a, L rlan o, L a son ille, L A lan a, A Col m s, e rleans, LA Las egas, Charlo e, C ash ille, nox ille, Dallas, o s on, A s in, i hmon , A o 50 e ros o 100 e ros We've also seen a stark difference between e ponential growth across a number of markets compared to a slow burn in tertiary areas. There are a few major markets that have slowed but it is evident that this is due to the aforementioned lack of inventory. Those same markets show quarter-over-quarter growth in price per square foot (PSF), and NNN rental rates showing that there is not a lot of space and competing tenants are more than willing to pay a higher rate. Holistically, our top 100 metros show a 50 bps decrease in cap rates and a 10% increase in price per square foot (PSF), across the board. Again, all arrows point to a strong market foundation with room to grow. Top Buyers & Medical Of ce Transactions KKR & Cornerstone Physicians Realty Trust Nu een Remedy Medical Properties Hammes Partners Healthcare Trust of America (HTA) $1.0 B $400 M $350 M $325 M $130 M $764 M ME I AL O I E
- 6. Strategic Alliance Coverage | Year End Report | Second Half 2021 | Texas International Consultants,Incorporated | Stealth Realty Advisors,LLC STATE OF CONSTRUCTION STATE OF CONSTRUCTION The state of the construction market for the upcoming year should prove to be interesting. With many deliveries already set for 2022, new construction is e pected to stall. However, there are other factors as to why we believe construction will slow in the new year. As supply chains continue to get hammered, costs of construction are reaching non viable levels. Tack on the labor shortage as previously mentioned, and now we are beginning to see delays in open projects in addition to the halt of new construction. According to Revista,MOB construction starts have been consistent throughout 2021 but completions will continue to slow. The top 5 markets for SFinprogressincludeChicago,Atlanta,NewYork,Houston and Los Angeles, with a combined 10 million SF in progress making up 20% of the nation's total. Construction Volumes up from Last Year Properties in Progress SF in Progress Dollar Volume in Progress SF Completed past 12 Months SF Started past 12 Months e i al e os i al 600 44.0 M 22.1 B 22.4 M 21. M 412 85.0 M 64.8 B 28. M 2 .2 M 4Q 2020 4Q 2021 4Q 2020 4Q 2021 67 4 .2M $23.3B 1 .1M 24.8M 3 4 1. M $72.4 B 21.0 M 27.3 M Source: Re i ta New Hospital Construction Increases Cons r ion e Pro e s in Progress in Progress o al al e in rogress Expansion New Replacement o al 274 106 31 411 46. M 22.2M 15.8M 84. $34.8B $16.4B $13.6B $64.8B Q4 2020 Expansion New Replacement o al 234 121 37 3 2 48.0M 25.2M 18.4M 1.6 $3 .6B $18.6B $13. B $72.1B Q4 2021 Source: e eral Re er e an o St oui YoY % Change Quarterly PPI ConstructionMaterials 2015 2016 2017 2018 2019 2020 2021 US Bureau of Labor Statistics,Producer Price Index by Commodity: Special Indexes: Construction Materials 1% 1% 2% 3% 3% 6% 13% 30% 31% 4% 3% 4% 4% 5% 7% 8% 7% -1% -1% -1% -2% 2% 2% 2% 0% 0% 0% 215 214 213 212 211 214 216 215 229 236 240 239 219 222 222 214 238 237 235 233 235 234 242 246 266 304 316 Source: Re i ta Source: Re i ta Top 10 Cities: Square Feet in Progress (Million) Chicago 2.1M SF 16 Properties New ork 2.0M 21 Properties Houston 1.8M 1 Properties Atlanta 1.5M 1 Properties LA 1.5M 13 Properties Columbus 1.4M 8 Properties Miami 1.4 M 16 Properties San Francisco 1.3 M 10 Properties Orlando 1.2 M 16 Properties D.C 1.1 M 10 Properties 3Q 2018 4Q 2018 1Q 2019 2Q 2019 3Q 2019 4Q 2019 1Q 2020 2Q 2020 3Q 2020 4Q 2020 1Q 2021 2Q 2021 3Q 2021 4Q 2021 24.0M 23.7M 24.0M 23.5M 23.1M 25.0M 23.1M 21.3M 22.7M 21. M 21.8M 21. M 23.8M 24.8M 24.3M 26.1M 24.5M 23.1M 21.7M 22. M 25.3M 23. M 23.6M 22.4M 1 .2M 18.6M 18.8M 1 .1M 42. M 42.4M 42.0M 44. M 42.8M 45.5M 42.2M 40.7M 41.2M 44.0M 41.6M 43.5M 45. M 4 .2M MOB Constructions Starts Outpacing Completions SF Started TTM SF Completed TTM SF in Progress
- 7. KEY STRATEGIC ALLIANCE MARKETS KEY STRATEGIC ALLIANCE MARKETS CAPITAL MARKETS / FINANCE CAPITAL MARKETS / FINANCE Author: Gary M Ten er Principal Cofounder, George Smith Partners and Dasha Sa chenko Analyst, George Smith Partners Bryan Shaffer Managing Director,George Smith Partners bshaffer gspartners.com Source: Re Strategic Alliance Coverage | Year End Report | Second Half 2021 | Texas International Consultants,Incorporated | Stealth Realty Advisors,LLC Markets Vacancy Total SF SFin Progress TransVolume(Yr) Occupancy Average (NNN) RentGrowt o Trans TransVolume Total SFSol Average PPSF ap Rates irming am A 9.00% 7,901,7 2 0,000 40, 51,591 91.00% 20.30 2. 0% 7 40, 51,591 122, 01.00 379.00 .05% P oeni A 13.40% 21,0 2, 50 1,4 2, 72 2 ,497, 49 . 0% 20. 7 2.10% 5 2 ,497, 49 1,779,947.00 375.40 .20% os Angeles A .50% 0, 44,2 4 1,434,59 91, 37,772 91.50% 34. 4 3.10% 3 91, 37,772 1,411,397.00 491.70 5.03% enver O 10.00% 15,124,4 4 334,407 27 ,791,90 90.00% 22.73 0. 0% 1 27 ,791,90 924,007.00 314.30 5.10% altimore M 5.50% 15, 30,532 1,252,922 107,037,700 94.50% 22.97 0.40% 11 107,037,700 345,351.00 321.50 7.99% as ington M 9. 0% 24, 79,230 1,07 ,145 1 1,3 4,000 90.40% 25.47 1.70% 13 1 1,3 4,000 5 ,59 .00 33 .50 5.5 % Miami F .00% 22,5 ,554 1,342,9 3 9,751,72 92.00% 23.0 1.50% 3 3 9,751,72 1,344,221.00 341.10 .21% Tampa F 7.20% 13,239,5 315,422 23 , 22,91 92. 0% 21.0 1.70% 1 23 , 22,91 540, 0.00 4 9.40 .02% Orlan o F .50% 11, 25,090 1,40 ,937 140, ,553 91.50% 21.77 2.10% 1 140, ,553 42 ,0 5.00 35 . 0 5. 9% acksonville F 5. 0% 9,070,53 5 ,957 225, 57,53 94.40% 21.4 2.10% 15 225, 57,53 31,35 .00 3 3. 0 .71% Atlanta GA 9.40% 31, 04,322 1,2 9,2 2 5 , 54,5 90. 0% 20. 7 1.50% 73 5 , 54,5 1,939,139.00 335.50 .30% olum us O .50% 12,74 ,532 1,225,000 254,44 ,700 91.50% 15.35 1.10% 20 254,44 ,700 1,12 ,3 5.00 224.40 5.35% New Orleans A 7.90% 4, 5 ,53 22,000 37,11 ,1 92.10% 27.32 2. 0% 2 37,11 ,1 1,3 0.00 552.50 5. 7% as Vegas NV 10.90% 7, ,715 ,540 119, 24,050 9.10% 21.44 3. 0% 7 119, 24,050 3 3, 22.00 29 .70 .00% arlotte N 10.10% 11, 20, 90, 75 310,950, 4 9.90% 23. 7 1.40% 19 310,950, 4 712, 72.00 429.00 5. 1% Nas ville TN .30% 11,97 ,575 54 ,947 147,241,000 91.70% 21.11 2.30% 14 147,241,000 447, 45.00 330.30 .00% no ville TN .00% 4, 34,53 127,000 0,091,297 92.00% 21.31 0. 0% 7 0,091,297 254,742.00 303.40 5.30% allas T 11.00% 37,947,577 3 1,3 1 553, 5,321 9.00% 22.22 1.50% 47 553, 5,321 1, 37,795.00 370.10 5. 1% ouston T 12.20% 42,57 ,040 2,029,310 340,949, 11 7. 0% 23.30 1.30% 2 340,949, 11 1,053,905.00 351. 0 .59% Austin T 10.90% 7,397,5 5 444,000 49,597,0 0 9.10% 25. 1.10% 49,597,0 0 149,5 1.00 339. 0 0.00% Ric mon VA .70% ,53 ,031 1,015,000 249, 23, 4 91.30% 20.14 -0.10% 249, 23, 4 03,559.00 412.30 5.20% Top Metros .40% 3,55 ,579 32,2 ,032 11,177, 04,941 91. 0% 23.27 1. 0% 2 11,177, 04,941 31,192,120.00 3 4.20 .03% Top Metros .20% 1,051,222, 42 3 ,3 1, 40 12, 29,1 2, 32 91. 0% 22.55 1.70% 1010 12, 29,1 2, 32 3 ,322,955.00 37 . 0 .11% irming am A 9.00% 7,901,7 2 0,000 40, 51,591 91.00% 20.30 2. 0% 7 40, 51,591 122 01 379.00 .05% P oeni A 13.40% 21,0 2, 50 1,4 2, 72 2 ,497, 49 . 0% 20. 7 2.10% 5 2 ,497, 49 1779947 375.40 .20% os Angeles A .50% 0, 44,2 4 1,434,59 91, 37,772 91.50% 34. 4 3.10% 3 91, 37,772 1411397 491.70 5.03% enver O 10.00% 15,124,4 4 334,407 27 ,791,90 90.00% 22.73 0. 0% 1 27 ,791,90 924007 314.30 5.10% altimore M 5.50% 15, 30,532 1,252,922 107,037,700 94.50% 22.97 0.40% 11 107,037,700 345351 321.50 7.99% as ington M 9. 0% 24, 79,230 1,07 ,145 1 1,3 4,000 90.40% 25.47 1.70% 13 1 1,3 4,000 5 59 33 .50 5.5 % Miami F .00% 22,5 ,554 1,342,9 3 9,751,72 92.00% 23.0 1.50% 3 3 9,751,72 1344221 341.10 .21% Tampa F 7.20% 13,239,5 315,422 23 , 22,91 92. 0% 21.0 1.70% 1 23 , 22,91 540 0 4 9.40 .02% Orlan o F .50% 11, 25,090 1,40 ,937 140, ,553 91.50% 21.77 2.10% 1 140, ,553 42 0 5 35 . 0 5. 9% acksonville F 5. 0% 9,070,53 5 ,957 225, 57,53 94.40% 21.4 2.10% 15 225, 57,53 3135 3 3. 0 .71% Atlanta GA 9.40% 31, 04,322 1,2 9,2 2 5 , 54,5 90. 0% 20. 7 1.50% 73 5 , 54,5 1939139 335.50 .30% olum us O .50% 12,74 ,532 1,225,000 254,44 ,700 91.50% 15.35 1.10% 20 254,44 ,700 112 3 5 224.40 5.35% NewOrleans A 7.90% 4, 5 ,53 22,000 37,11 ,1 92.10% 27.32 2. 0% 2 37,11 ,1 13 0 552.50 5. 7% as Vegas NV 10.90% 7, ,715 ,540 119, 24,050 9.10% 21.44 3. 0% 7 119, 24,050 3 3 22 29 .70 .00% arlotte N 10.10% 11, 20, 90, 75 310,950, 4 9.90% 23. 7 1.40% 19 310,950, 4 712 72 429.00 5. 1% Nas ville TN .30% 11,97 ,575 54 ,947 147,241,000 91.70% 21.11 2.30% 14 147,241,000 447 45 330.30 .00% no ville TN .00% 4, 34,53 127,000 0,091,297 92.00% 21.31 0. 0% 7 0,091,297 254742 303.40 5.30% allas T 10.90% 37,99 , 75 3 1, 01 554,014, 21 9.10% 22.0 1.40% 49 554,014, 21 1 4 2 3 . 0 5. 1% ouston T 12.50% 43,175, 53 2,3 7,22 3 9,51 , 3 7.50% 23.29 1. 0% 31 3 9,51 , 3 10 5 439.90 .59% Austin T 10.90% 7,397,5 5 444,000 49,597,0 0 9.10% 25. 1.10% 49,597,0 0 1495 1 339. 0 .00% Ric mon VA .70% ,53 ,031 1,015,000 249, 23, 4 91.30% 20.14 -0.10% 249, 23, 4 03559 412.30 5.20% Top Metros .40% 3,55 ,579 32,2 ,032 11,177, 04,941 91. 0% 23.27 1. 0% 2 11,177, 04,941 31192120 3 4.20 .03% Top Metros .20% 1,051,222, 42 3 ,3 1, 40 12, 29,1 2, 32 91. 0% 22.55 1.70% 1010 12, 29,1 2, 32 3 322955 37 . 0 .11% Despite the Federal Reser e signaling that it will take strong action to stem an in ation rate of o er 7% brought about by pandemic related supply chain constraints and a super heated economic expansion, George Smith Partners remains optimistic for commercial real estate capital markets in 2022. In response to the economic shut down caused by Co id quarantines,the Federal Reser e cut interest rates close to ero and started se eral rounds of quantitati e easing by buying trillionsof dollarsof Treasurybondsandmortgage backedsecuritiestokeepinterestrateslow and to stimulate the economy to sta e off a recession or worse, a depression. In March 2021, Congress passed theAmerican Reco eryAct to also pro ide economic stimulus,pro ide rental assistance, accination programs, retrofitting of schools, etc. Low interest rates and abundant capital spurred commercial real estate in estment and high aluations. Since then, U.S. rates ha e remained low and alues high. Howe er, with 7% in ation in 2021, the highest rate since 1 82, the Fed has announced steps to wind down its $ trillion balance sheet and increase interest rates fi e or more times in 2022 in efforts to stem recent in ation.As of early February 2022, the 10 year Treasury rate, the benchmark off which long term, fixed rate commercial mortgages are priced, has risen to pre pandemic le el of 1. %, the highest since anuary 2020. Short term rates, which are tied to the Fed’s benchmark Fed Funds Rate , ha e ranged between 0% and 0.25% o er the past year and are expected to increase by about 100 basis points o er the course of 2022. Short term rates ha e increased approximately 5 basis points but are expected to ad ust further in lockstep with ad ustments in the Fed Funds Rate when the Fed meets in March. Despite the Omnicron surge in December and anuary, the Labor Department announced an exceptionally strong obs Report for anuary of 467,000 seasonally ad usted new obs and that the U.S. economy has regained more than 1 million of the 22 million obs lost at the onset of the pandemic. The strong obs report is likely to reinforce the prospects for the Fed to increase the Fed Funds Rate, aggressi ely. TAILWINDS A rise in interest rates may prompt lenders to be more aggressi e on new loans in 2022 as they look to pad their net interest margins while benchmark rates are still relati ely low. CMBS and Life Co. loan olume will also remain strong as borrowers will seek to lock in lower rates and refinance legacy high rate loans and newly stabili ed properties. Commercial banks will continue to lend on new construction, selecti ely and non bank lenders, such as debt funds, will continue to lend aggressi ely to put their abundant liquidity to work. HEADWINDS NOIs will come under in ationary pressure as not all increases operating expenses caused by rising labor and material costs, utilities, etc., can be passed on to tenants. Re enue growth may be impacted by increased regulations in some states (such as rent control and e iction moratoria on multifamily) or by existing lease pro isions and market supply & demand. As a key metric in loan underwriting, constraints on pro ected NOI growth will result in lenders adopting a generally more conser ati e lending philosophy. GREAT OPPORTUNIT AHEAD Clearly, 2022 will bring change to commercial real estate capital markets howe er, unlike pre ious cycles there is abundant liquidity a ailable for good pro ects and interest rates, although slightly higher, are still close to the bottom. Since our founding in 1 2, George Smith Partners has led our clients to the smartest capital choices through changing capital markets, as well as interest rate cycles and changes in liquidity. We see only great opportunity ahead in 2022. Headwinds and Tailwinds Ahead for Commercial Real Estate by Gary M Tenzer & Dasha Savchenko CAPITAL MARKETS & FINANCE
- 8. Strategic Alliance Coverage | Year End Report | Second Half 2021 | Texas International Consultants,Incorporated | Stealth Realty Advisors,LLC TRENDS TRENDS LABOR SHORTAGES AFFECTING HEALTHCARE AmbulatoryHealthSer ices Officesof Physicians OutpatientCareCenters Hospitals Healthcare TotalNon Farm 2,711.20 1,00 .00 1,4 8.10 2, 1.3 7,842.30 125,252 2,711.60 1,011.5 1,506.30 2, 53.70 7,870.50 125,56 2,638. 0 81.20 1,4 2.3 3,13 .2 7,587.00 120,008 0.00% 0.20% 0.50% 1.30% 0.40% 0.30% 2.80% 3.10% 0. 0% 5. 0% 3.70% 4.60% 8/21 9/21 1YearAgo M/M Change Y/Y Change Sou ce SBu e uofL o St tistics S FT NG S GN The national labor de cit that has affected businesses thispastyearhase pandedtohealthcare. Aswepredicted, design changes are being implemented to retain invaluable doctors, nurses and staff. Some of these changes include specialized tenant improvements such as alcoves for staff breaks, natural light, and views for employeestoenjoy. Combinedwithafocusonthe patient e perience , landlords and developers have to shift their standard thought process when implementing a medical use. Amenities such as healing gardens, used in the soon to open Beth Israel Deaconess Medical Center - a 345,000 SF healthcare facility in Boston - are taking up entire floors and are becoming an industry standard across all new developments to provide the best possible patient e perience. OFF N STR A ONV RS ONS TO M A OFF F S N S LI E S IEN E It is widely reported developers are acquiring e isting of ce and industrial properties to convert into life science facilities in markets where demand is driving the need for more supply. Many of these markets are in major metro areas where there is not available land and entitlements are dif cult to come by. This is forcing developers to be creative and look at the conversion of e isting properties such as multi story of ce buildings, when industrial or fle space cannot be found. Many cities such as Boston, San Francisco and Philadelphia are evidence of this. ME I AL O I E Strong rent collections and tenant demand for medical of ces have persevered through the pandemic and have led the asset class to be in as demand as ever and we do not e pect this to change in 2022. This has led to a very speci c type of opportunity for of ce investors to convert struggling properties into medical of ce. The result can often prove fruitful for the savvy investor. However, in evaluating a conversion to medical of ce, items which should be considered are costly plumbing and additional power required for certain uses. Land availability parking ratio and zoning requirements are other considerations. Beth s el De coness Medic l ente , Boston M n Of ce Life Science Building @ e Roc i cle , Roc ille Md c ui ed Tet co e hoto ush n e eld. edic l lounge in o th s ni e sit e lthc e ente in hic go, L Medic l Of ce F cilit @ 185 ent l e, Beth ge, hoto ou tes L ngone e lth
- 9. Strategic Alliance Coverage | Year End Report | Second Half 2021 | Texas International Consultants,Incorporated | Stealth Realty Advisors,LLC OUTLOOK 2022 OUTLOOK 2022 CLOSING REMARKS CLOSING REMARKS Now several weeks into 2022, e perts are spouting a positive outlook for the coming year across most healthcare asset classes including, but not limited to, life science, medical of ce, ambulatory surgery centers and behavioral health hospitals. Compared with some other property types, healthcare real estate has shown a massive gain in volume and tenant investor interest as illustrated on the previous pages. Will life science outpace medical of ce in transaction volume and dollar amount The answer is yes. This asset class reminds me of medical of ce just a few decades ago. It is easy for those of us who were around then to see the resemblance in the rush to develop and invest due to pent up demand. The real issue is tenant credit as stated previously in this paper. Medical of ce will not fall out of favor by any stretch. uality product is harder than ever to identify while more and more class B & C product hits the market through online services such as Cre i & Co-Star. The entrepreneurial investor should give serious consideration to buildings in areas of growth but with more vacancy and deferred maintenance than usual. Why should 2022 be any different from 2021 Is it going to be the high cost of inflation, raising interest rates or less construction due to lack of building materials Will the same supply chain issues continue to affect the need to manufacture more medical supplies and material devices in this country Will it be the flood of money from private equity and global institutional investors, some backing well known e isting investors while others take a chance on newly created funds Will there be more M & A of hospitals this year, pushing for more closures Will bio life science demand continue to outpace supply and rents continue to grow Will universities and health systems work together to solve the growing healthcare staf ng shortage of medical personnel Will more and more elective surgeries be done away from the traditional acute care hospital, with more being conducted in the off-site ambulatory surgery center Will CAP rates hold or start to go up because of inflation How do we nd the best off-market opportunities I could go on and on, but this will provide you with a glimpse of what has been the discussion for months among those actively engaged in the business of buying and selling healthcare real estate. Many a dinner, cocktail and morning coffee has been consumed with these discussions, and while we sit in and listen to economists opine on what they think will happen, the truth is, no one really knows. We can only rely on history and what has actually transacted This is why we spend so much time e amining the markets by simply not reviewing closed transactions, but speaking with and having in-depth conversations with owners, investors, developers, tenants and health system e ecutives about what they see daily and what affects them. As we publish this paper, we try to provide our readers with some practical tools for reference when gauging their investment strategy. While we make no representation as to seeing into the future, we have predicted the increase in growth of the ambulatory surgery centers, the need to rethink and redesign healthcare space (during and post COVID), investor appetite for behavioral health and that telehealth was here to stay. The TICI Group of Companies, with Te as International Consultants, Incorporated as the Strategic Advisory and Consulting arm and Stealth Realty Advisors, LLC as the Capital Markets and Transactional group, our talent and resources are equipped and ready to grow your pipeline and portfolio. ‘Q1-2001 ‘Q1-2003 ‘Q1-2006 ‘Q1-2009 ‘Q1-2012 ‘Q1-2018 ‘Q1-2021 ‘Q1-2024 Source: Real Capital Anal tic Weak Correlation Between Fed Funds Rate & Cap Rates e n s e CBD Ca a e e n s ra e goes P, a ra es go D . e n s ra e goes D a ra es go D . e n s ra e goes P a ra es s a LA . We believe that there will be opportunities from investors who have come over from a different asset class and may not understand the management nuances of a medical of ce or how to retain a relationship with this type tenant. An area still not being invested in as quickly as demand warrants is behavioral health. CMS and insurance companies are showing a growing awareness and willingness to the need to increase reimbursables. ust like life science, but perhaps not as glamorous, the supply is simply not there. Demand allows for conversion of several different types of asset classes to t the different types of clinical space needed. It does not have to start out as a medical of ce or healthcare facility. We believe this too will provide an investor multiple choices when a credit tenant is in tow. As with anything, a relationship is needed whether it is a hospital, a large physician group, national operator or equity source. The savvy investor will need to spend more time than ever sourcing product.
- 10. SPECIAL ACKNOWLEDGEMENTS SPECIAL ACKNOWLEDGEMENTS STRATEGIC ALLIANCE COVERAGE STRATEGIC ALLIANCE COVERAGE im elle Managing Principal, Champions DFW Commercial Realty Lon a es President, LDMCommercial i gi o Executi eVicePresident Capital Markets A ison oung Br an ha er Managing Partner George SmithPartners Barr D. ar s President BarryEdwards& AssociatesInc. loan ae h Principal Spaeth Cook Pe er anlon SeniorVicePresident Colliers International Pa ri D er VicePresidentOf De elopment elnikRealty,Ltd. An oolle Principal SingletreeAd isors lie ohnson Executi e VicePresident Colliers International National HealthcareGroup Bill ranso Co ManagingPartner MedSouth HealthcareProperties CraigPelo e SeniorVicePresident Commonwealth CommercialPartners Helen Banks Chairman helenbanks ticigroup.com H. Jay Banks Chief Risk & Compliance Officer aybanks ticigroup.com James Jim Coman Managing Director Capital Markets Healthcare imcoman ticigroup.com Sarah Finney Marketing & Research Director sarahfinney ticigroup.com Zaher Samnani Senior Analyst ahersamnani ticigroup.com Derrick D. Bracks, MBA National Director of Business De elopment derrickbracks ticigroup.com 19 1 The Information contained herein has been obtained from so rces deemed re iab e hi e e er reasonab e effort has been made to ens re its acc rac e cannot arantee it o res onsibi it is ass med for an inacc rac This re ort ma not be re rod ced in art or in ho e itho t the e ress ritten consent of The TI I ro of om anies FOR MORE INFORMATION Helen Banks | Chairman ( 13) 05-15 helenbanks ticigroup com im C Coman Managing Director Capital Markets -Healthcare ( 43) 412- 14 imcoman ticigroup com Disposition I Tenant Representation Capitol Mar ets I isition inan e I sset Ris Mana e ent siness I Real state I a ilities