SlideShare a Scribd company logo
1 of 11
Download to read offline
INVESTOR PREFERENCES
PROVIDER PREFERENCES
CAMPUS
ON CAMPUS
RETAIL LOCATIONS
TERTIARY MARKETS
SUBURBAN LOCATIONS
URBAN LOCATIONS
Less favorable More favorable
19 21
Disposition I Tenant Representation
Capitol Markets I Acquisition
Finance I Asset & Risk Management
Business I Real Estate I Facilities
Strategic Alliance Coverage
HEALTHCARE & BIO-LIFE SCIENCE REAL ESTATE
2020 YEAR END REPORT
SO WHERE ARE WE NOW?
CY2020 closed with uncertainties over the future of the
COVID-19 Pandemic and its effect on the commercial
and healthcare real estate industry. While the
development of vaccines offer a promising
future, the development, approval and
distribution of the vaccines continue to
raise concerns among the general
population and all real estate sectors.
The first 100 days of the Biden
Administration and the reliance on
executive orders and votes in Congress
must be watched closely to determine
how these decisions and actions will
impact the industry going forward. Small
businesses have struggled to maintain operations
while complying with varying state and municipally
mandated COVID protocols, creating a domino effect with
vacant spaces as many of these businesses, (especially
retail related) have closed permanently. Many are unable
to meet their financial obligations to landlords and workers,
increasing vacancies and unemployment.
Fundamentals remain stable in the medical office building
sector. Although many clinical operations were either
reduced or shuttered during the height of the Pandemic,
rental collections from the largest medical office building
owners were consistent in the high ninety percent range,
albeit with some rent deferment and relief. Tenant
retention in the most mature portfolios of institutional
investors/owners has been reported in the high eighty
percent range.
REPORTED SIGNS OF DISTRESS RELATED
TO COVID-19 IN THE UNITED STATES
Source: Revista
As the appetite for investments moves forward to pre-COVID
levels, these statistics, which typically exceed those found in
the general commercial office sector, indicate the stability of
this market class. High demand with low inventory continues to
produce low cap rates and quick transactions.
(See graphs on CAP rates on page 6 of this
report.)
How is COVID Changing
Location Preferences?
CAMPUS
ON CAMPUS
RETAIL LOCATIONS
TERTIARY MARKETS
SUBURBAN LOCATIONS
URBAN LOCATIONS
CHANGES & OPPORTUNITIES
Tele-Health
80%
60%
Of all US counties
Of all rural counties
50%
75%
Number of hospital visits to
emergency departments
with mental disorders as a
primary diagnosis.
Number of visits to physician
Offices per year with medical
Disorders as the primary
diagnosis.
59.8 M
Increase in mental
health issues in the
ER from 2014-2017
# of hospitals
that have closed
since 2010
Are at extreme
risk of closing
soon
100
1in5
5.5 M
+42%
The rise in tele-health since the onset of the pandemic
has created much discussion among healthcare
professionals. Even as patients receive tele-health
services at home, practitioners will need space for such
calls, remote monitoring and diagnostic equipment.
Patients will still have the need for office visits to assess
conditions requiring more extensive evaluation. Tele-
health has the potential to maximize productivity, thus
potentially reducing (but not eliminating) the need for
significant square footage. We address this more in the
next section on redesign and use of medical space.
AVAILABILITY & SHORTAGE
1/20/2020 3/10/2020 4/29/2020 6/18/2020 8/7/2020 9/262020 11/152020
11%
35%
46%
52% 46%
36%
29%
20% 20%18%
16% 15% 15% 19%
Tele-health Visits Stabilize
Source: The Chartis Group & Kythera Labs
2 Strategic Alliance Coverage | Year End Report | Second Half 2020 | Texas International Consultants,Incorporated | Stealth Realty Advisors,LLC
REPORTED
LEVELS OF DISTRESS
HIGH
DISTRESS
MEDIUM
DISTRESS
LOW
DISTRESS
ALL
RESPONDENTS
JOB LOSS
27%
53%
20%
34%
53%
13%
HIGH
DISTRESS
MEDIUM
DISTRESS
LOW
DISTRESS
ALL
RESPONDENTS
JOB LOSS
27%
53%
20%
34%
53%
13%
n-1,062 n-319
REPORTED
FEELING ANXIOUS
n-1,062 n-319
BOTH ANXIOUS
& DEPRESSED
ANXIOUS BUT NOT
DEPRESSED
DEPRESSED BUT
NOT ANXIOUS
NEITHER
ALL
RESPONDENTS
JOB LOSS
23%
5%
20%
42%
26%
26%
ALL
RESPONDENTS
JOB LOSS
37%
35%
63
74
6%
Source: McKinsey COVID-19 Consumer Survey
An emerging opportunity in the healthcare real estate
sector is behavioral health. Many of these transactions
involve sale-leaseback, allowing owner/operators to
invest available funds in expanding operations and
developing, with a partner, additional facilities.
Shortage of Supply: In 2018, supply was 3.8 million
square feet. This increased to 8.1 million square feet in
2019. In 2020, developers were anticipated to deliver
6.4 million square feet with supply still not meeting
demand. Many players are actively pursuing this
sector: expansion of acute care psychiatric hospitals
and units; substance abuse and eating disorder
treatment providers; residential, outpatient and
adolescent treatment facilities; community mental
health centers; and autism treatment center operators.
Construction costs in CY2020 held relatively stable at
$403.00 per square foot. While approximately 5.5
million people with behavioral health conditions seek
treatment each year in emergency rooms, many of
these facilities do not have clinicians with the skills to
treat these patients. The stigma of mental health
conditions is decreasing, contributing to the demand
for specialized behavioral health services and facilities
to treat such. This increasing demand has also created
an increase in institutional and investment capital
evaluating the space such as private equity and venture
capital funds. Specialty healthcare REITs are
expanding their behavioral health portfolios.
Behavioral Health
Source: The Chartis Group, Kythera Labs and Revista
Tele-health Adoption by Specialty Varies
PSYCHIARTY
NEUROLOGY
INTERNAL MEDICINE
GASTROENTEROLOGY
PULMONOLOGY
FAMILY MEDICINE
PEDIATRICS
RADIATION ONCOLOGY
NEUROSURGERY
CARDIOLOGY
HEMATOLOGY/ONCOLOGY
OBSTETRICS & GYNECOLOGY
UROLOGY
GENERAL SURGERY
CARDIOVASCULAR SURGEY
DERMATOLOGY
OTOLARYNGOLOGY
ORTHOPAEDICS
OPHTHALMOLOGY
65%
31.8%
24.6%
24.5%
23.4%
23.0%
18.4%
15.2%
13.9%
11.2%
9.8%
8.1%
7.8%
7.5%
7.3%
3.6%
2.8%
2.6%
0.7%
Levels of Demand by Consumers
Source: McKinsey COVID-19 Consumer Survey
ENOUGH
TO FILL
Both landlords and architects must address the new climate
and responsibilities in which our healthcare professionals find
themselves. When considering the changes from the effect of
COVID there are two areas of concern: 1) the healthcare
provider and their staff and 2) the patient. Designers can
create unique amenity spaces that enhance excellence in
patient care and promote efficiency and enhance care
standards.
Numerous studies conducted by The Harvard School of Public
Health and Cornell University have shown that daylighting, air
quality and bringing nature and natural forms into a facility not
only reduce stress, but also increase productivity.
A 233,973-square-foot multi-specialty ambulatory healthcare
center that was developed in The Villages in Central Florida is
an example of the newer, bigger and more efficient design.
The four story CAHB medical office building provides urgent
care services, diagnostic imaging and laboratory services,
outpatient pediatric rehabilitation services, and five distinct
medical specialty practices. In addition, it offers radiation
oncology and outpatient labs; retail services including an
audiology center, health and technology education center,
pharmacy and coffee shop; outpatient surgery and
dermatology. Included are 13 specialist offices with
diagnostic and procedural suites. “Having this collection of
outpatient services under one roof versus multiple
destinations throughout The Villages provides a patient-
centered destination of care in which the various services
complement each other ” commented the owner, The Villages
CAHB, LLC. It was designed by Earl Swensson Associates in
Nashville.
Nurturing the Nurturer with Spaces that Support,
De-stress + Connect
The case for nurturing the nurturer.
Healthcare professions (specifically nursing) are ranked sixth
among the most stressful professions. Multiple studies
suggest that healthcare professionals are more prone to
stress and occupational burnout because they are
responsible for human lives. The term “nurture” is commonly
used in the alliterative expression “nature versus nurture,”
Inspiring and even “prime real estate” spaces within the
building with desirable views offer a reprieve for staff who
work tirelessly caring for others. Playful lighting, lounge-style
seating, standing height tables/stools and booths can depart
from the clinical setting and foster interactions that build trust,
a sense of belonging and esteem.
Some of the most successful amenity spaces for healthcare
professionals include food amenity spaces, break rooms,
connection to outdoors, wellness spaces, staff lounges, and
smaller staff nourishment areas close to their working space.
Look for this design to start taking shape in future buildout or
retrofits of existing space.
SOURCE: Healthcare Design
OLD DESIGN
NEW DESIGN
RETHINKING DESIGN AND PROCESS
FOR BETTER DELIVERY OF SERVICES
OLD DESIGN
NEW DESIGN
3 Strategic Alliance Coverage | Year End Report | Second Half 2020 | Texas International Consultants,Incorporated | Stealth Realty Advisors,LLC
NEW INTERIOR
STAFF LOUNGE
NEW EXTERIOR
BREAK AREAS FOR
HEALTHCARE PROFESSIONALS
BUYERS
Ventas
Alexandria
Alexandria
Brookfield
EdgeConneX
LOCATION
8th
San Fran, US
Durham, US
Waltham, US
Didcot, UK
Santa Clara, US
Vol (Sm)
1,002
530
300
144
83
Size (sf)
803,186
1,889,271,
549,889
1,502,041
219,083
# Props
3
4
2
5
3
Top Buyers since Jan 2019
Single Assets
BUYERS
PRP
Swift
Healthpeak
KLP Forsikring
IQHQ
LOCATION
Irvine, US
Cupertino, US
Waltham, US
Stockholm, SWE
Boston, US
Vol (Sm)
355
346
320
270
270
Size (sf)
680,900
373,402
426,004
242,190
285,556
Portfolio
BUYERS
Ventas
Alexandria
Alexandria
Brookfield
EdgeConneX
LOCATION
8th
San Fran, US
Durham, US
Waltham, US
Didcot, UK
Santa Clara, US
Vol (Sm)
1,002
530
300
144
83
Size (sf)
803,186
1,889,271,
549,889
1,502,041
219,083
# Props
3
4
2
5
3
BIO LIFE SCIENCE -
ITS MAJOR MARKETS,OWNERS AND TRANSACTIONS
Source: JLL research, Real Capital Analytics
Source: JLL, Crunchbase
Source:Real Capital Analytics
LIFE SCIENCES
TRANSACTIONS VOLUME
Overall
transaction
volume
(Billions
$US)
2017 2018 2019 TTM ENDING
4/2020
ACTIVE LIFE SCIENCE
INVESTORS
Number
of
unique
buyers
2017 2018 2019 TTM ENDING
4/2020
According to Real Capital Analytics, COVID-19 has
accelerated the structural trends that were already
reshaping the commercial property investment landscape.
A large portion of the retail sector is now viewed as un-
investable, and parts of the medical office building market
are being viewed more cautiously. Investors are therefore
looking to deploy capital in other market sectors. The
bio/life science niche has seen an influx of capital
investment, not only due to COVID-19 but to
advancements in technology, data capture and analysis,
and a rapidly aging population.
The nature of the industry and on-going research means
the sector tends to locate in clusters, often linked to
universities. These locations include Boston, San
Francisco, Seattle, Austin, Houston, North Carolina and
Maryland. According to Real Capital Analytics data, $9
billion of bio/life sciences property is under construction,
with $2.5 billion in the Boston area, $1.2 billion in San
Diego, and $1 billion in Austin. One of the emerging
markets is Houston, home to the largest medical center in
the world. Many bio/life science companies spin out of
these major medical and academic research institutions
such as Baylor College of Medicine, MD Anderson
Hospital, University of Texas Health Science Center and
Methodist Hospital. Bio/Life Science developments in the
works include TMC3, owned by the Texas Medical Center;
The Ion Project developed by Rice University; Hines and
2ML Real Estate; Levit Green; Innovation Tower, developed
by Medistar Corp. and Innovation Plaza, developed by
Texas A&M University. Even with these projects either
existing or in the pipeline, demand is still anticipated to
outstrip supply. State tax incentives and relatively
affordable land is expected to create an influx of both
foreign and domestic investors. In comparing rents for
Houston with other bio/life science hubs, 40,000 square
feet of lab space rents for the cost of 5,000 to 10,000
square feet in New York City or Boston.
4 Strategic Alliance Coverage | Year End Report | Second Half 2020 | Texas International Consultants,Incorporated | Stealth Realty Advisors,LLC
BIO LIFE SCIENCE-REAL ESATE
$52M
$174M
$179M
$196M
$218M
$309M
$316M
$522M
$548M
$1,046M
$1,133 M
$1,345 M
$4,701M
$5,536M
VACANCY CHARTS,RENTAL RATE
AND GROWTH CHARTS,ACTIVE BUYERS
MOB Fundamentals Steady Across Top 50 Metros
Total SF
Occupancy
Rate TTM
%
SF
Completed
Past 4
Quarters
Absorption
SF Past
4 Quarters
Rent NNN
Average
YOY Rent
Growth SS
%
Cont. SF
In
Progress
Const. SF
In progress
Vs
Inventory (%)
New York
Chicago
Houston
Dallas
Philadelphia
Atlanta
Boston
Washington, DC
Miami
Los Angeles
72.7M
41.5M
41.5M
33.3M
29.3M
27.3M
26.3M
23.1M
20.1M
57.4M
93.6
91.4
88.3
89.1
92.2
90.0
93.6
90.0
90.5
91.6
1,732,988
560,911
372,956
498,294
406,000
266,500
620,700
456,954
370,534
489,115
1,656,760
815,968
122,500
581,403
326,567
434,933
604,305
691,867
627,842
178,024
$24.50
$19.76
$21.86
$21.76
$20.20
$20.08
$27.66
$25.08
$23.36
$34.41
1.6
1.4
1.5
1.4
1.5
2.3
1.5
2.2
2.5
1.7
2.3
4.2
3.3
3.4
1.6
6.1
2.5
5.2
5.9
2.0
1.6M
1.7M
1.4M
1.2M
0.5M
1.7M
0.7M
1.2M
1.2M
1.1M
Q1
6.8
6.1
5.4
3.1
7.1
6.3
5.6
4.0
6.9
6.1
5.5
4.0
6.9
5.9
5.5
4.6
Q2 Q3 Q4
25th
%
75th
%
Lowest
Median
MOB Cap rate yield by trends by quarter in 2020
5 Strategic Alliance Coverage | Year End Report | Second Half 2020 | Texas International Consultants,Incorporated | Stealth Realty Advisors,LLC
Most Active Markets
Annual Volume
(Millions)
Avg.$/SF
SQ.FT TTM Avg.Cap Rate
$10,219.2
$8,634.9
$7,023.2
$767.9
$358.1
$344.1
$328.3
$302.5
$300.2
$298.0
$287.6
$212.3
$209.6
$207.0
32.2
26.7
21.3
1.7
0.9
1.2
1.0
0.8
0.9
1.1
0.7
0.7
0.7
0.4
$344
$352
$357
$464
$333
$319
$357
$393
$305
$296
$405
$291
$389
$502
6.3
6.2
6.2
5.5
5.6
6.5
6.0
6.1
6.5
6.6
5.8
5.4
6.0
6.5
US
Top 100
Top 50
Los Angeles
Houston
Miami
Dallas
New York
Washington,DC
Chicago
Indianapolis
Atlanta
Phoenix
San Diego
Source: Revista
Source: Revista
Source; Revista
AVERAGE CAP RATE
VACANCY
AVERAGE CAP RATE
PRICE PER SQ. FT LEASE RATE
Top Construction Market
630 M
12 M
21 M
16 M
14 M
11 M
10 M
14 M
16 M
14 M
14 M
44.3 M
1.7 M
1.7 M
1.6 M
1.4 M
1.2 M
1.2 M
1.2 M
1.2 M
1.2 M
1.1 M
3.1 M
4.2 M
6.1 M
2.3 M
3.3 M
6.2 M
5.2 M
6.5 M
5.9 M
3.4 M
2.0 M
20.7 M
0.6 M
0.3 M
1.7 M
0.4 M
0.2 M
0.5 M
0.3 M
0.4 M
0.5 M
0.5 M
20.9 M
0.5 M
1.0 M
0.8 M
0.9 M
0.7 M
0.2 M
0.3 M
0.6 M
0.2 M
0.8 M
Properties in
Progress
SF in progress vs
Inventory
SF in Progress SF completed past
12 months
SF started past
12 months
US
Chicago
Atlanta
New York
Houston
San Francisco
Washington,DC
Phoenix
Miami
Dallas
Los Angeles
Remedy Medical Properties,Inc
INVESCO
Montecito Medical Real Estate
Healthcare Realty Trust (NYSE:HR)
Anchor Health Properties
IRA Capital
Anchor Health Properties
Harrison Street Realty Capital
Healthpeak Properties Inc
Global Medical REIT
$1.51B
$924 M
$608 M
$487 M
$385 M
$341 M
$254 M
$232 M
$196 M
$191 M
2020 Most Active Buyers
Hospitals/Health System - 52%
Investor Private - 24%
REIT - 13%
Provider Owner - 10%
HOSPITALS/
HEALTH
52%
PROVIDER/
OWNER -25%
REIT -13%
INVESTOR /
PRIVATE
24%
VACANCY CHARTS,RENTAL RATE
AND GROWTH CHARTS, ACTIVE BUYERS
6 Strategic Alliance Coverage | Year End Report | Second Half 2020 | Texas International Consultants,Incorporated | Stealth Realty Advisors,LLC
HOSPITAL SYSTEMS OWN
MAJORITY OF MOB SECTOR
Source: Revista
3.25%
0.12%
0.21%
0.59%
1.22%
0.46%
1.14%
1.91%
Prime Rate
1 Month LIBOR
6 Month LIBOR
5 YR SWAP
10 YR SWAP
5 YR TR
10 YR TR
30 YR TR
KEY STRATEGIC ALLIANCE MARKETS CAPITAL MARKETS / FINANCE
STRUCTURED DEBT AND FINANCE
MONEY RATES AS OF (2/10/2021)
For more information contact
Angela Kesselman, Managing Director, The Madison Group.
angela@madsongroupfunding.com
Source: Fin Facts from Bryan Shaffer, George Smith Partners.
Bryan Shaffer, Managing Director,George Smith Partners
bshaffer@gspartners.com
*Data acquired from Revista, CoStar and National Reports
1. Baltimore is excluded
2. Atlanta has 20 MOB’s Under construction
3. Columbus, OH; New Orleans, LA; Las Vegas, NV & Knoxville, TN have no MOB's under construction
Lending has remained brisk for the last 6 months of 2020, with low interest rates and cap rates working together to create a
surge in transactions. CMBS lenders have returned to the market with low rates in the mid 3s on 30/10 paper, but they are
more conservative on dollars. Most securitized deals transact at around a 65% loan to value or a minimum debt yield of 7-8%.
Credit tenants are preferred on single tenant transactions. Medical office loans are being done with low spreads and up to
full term interest only on non-recourse transactions. There is a big appetite for most medical type facilities in good locations.
The most difficult to transact are NNN single tenant assets with non-credit tenants that require non-recourse financing,
although there are a few lenders in the market that are willing to fund the right deal at 60-65% leverage. There is continued
optimism with lenders in this sector of the business as the medical industry develops new operational procedures to stay open
safely during Covid.
7 Strategic Alliance Coverage | Year End Report | Second Half 2020 | Texas International Consultants,Incorporated | Stealth Realty Advisors,LLC
OUTLOOK 2021
With 2020 behind us, we are moving rapidly into 2021.
Change in motion is the new normal. With these
changes we have identified two areas of asset classes
which have arisen from the Pandemic and present
opportunistic acquisition possibilities. Both are
addressed in this report and we are equipped and
ready to work closely with investors to review these
opportunities. They are Behavioral Health Treatment
and Bio Life and Medical Science Facilities.
In research for this medical office report we identified a
few key markets of note. They are Austin, Charlotte,
Denver and Tampa all exceeding the national average
in YOY rental growth. None of the 4 markets were
listed in the top ten for buyers but may warrant further
examination for 2021, if investors can find the right
product available. Austin has a YOY rental growth of
6.3% with a median rate of $25.00 PSF for lease and
$293.00 PSF on sales. Austin reportedly has just
101,000 SF under construction expected to come
online this year with a vacancy rate of 10.6%. Charlotte
has a YOY growth rate of 2.7% with a median lease rate
of $23.00 PSF and a sales average of $371.00.
Charlotte has 734,500 SF scheduled for delivery this
year with approximately a 9% vacancy rate. Denver has
a YOY of 3.7%, a median lease rate of $22.00 PSF and
a sales average of $300.00 PSF. Denver has just shy of
450,000 SF under construction with a vacancy rate of
9.6%. Tampa has a YOY rate of 3.6% with a median rate
$20.50 PSF and a sales average of $355.00 PSF.
Construction for Tampa is estimated at 349,044 SF with
a vacancy rate of 8.3%.
It should also be noted that there were 4 markets
reporting no medical office building construction due
to be completed in 2021. Those markets are
Columbus, OH, 6.9% vacancy, Knoxville, TN, 9.1%
vacancy, Las Vegas has a YOY growth rate of .087%, a
lease rate of just over $19.00 and an average sales
prices of $461.00. A vacancy rate of 10.3% is reported
for Las Vegas. New Orleans, 7.1% vacancy.
With the new configuration and need for specialty
(amenity) space in new construction, investors will be
looking for assets to acquire which can easily be adapted
to conform to this concept. Ideal properties which may
allow for ease of this are existing medical office with large
open floor plates as well as retail properties which offer
this along with a myriad of options for other amenities
close by.
There is always much discussion about CAP rates and
where they will end up. We do not see any growth in CAP
rates in the foreseeable future. As of this report, they
continue to compress with an average for the US of 6.3%;
however larger quality assets have yielded rates in the mid
to low 5%. We expect this to remain the norm.
Continuation of capital flowing in from the west coast due
to sale of assets is being re-deployed to Colorado,
Arizona, Utah, Texas and Florida. This will continue to put
pressure on an already highly competitive market. This is
especially true of 1031 funds chasing NNN single tenant
leased medical office competing with well-known industry
buyers.
According to ReVista the characteristics of investor-
owned medical office buildings are: 72% prefer off
campus with 67% affiliated with a health system and 74%
of them need to be within 2 miles of a hospital. Preference
is for the assets to be north of 40,000 SF.
With the strategic coverage and relationships garnered by
our partners in key local markets we have a distinct
advantage in uncovering quality “off-market” healthcare
real estate assets. We continue to be focused on the
service and delivery of these opportunities to our clients.
8 Strategic Alliance Coverage | Year End Report | First Half 2020 | Texas International Consultants,Incorporated | Stealth Realty Advisors,LLC
2003
1990-
2003
Centennial Anniversary!
1946-
1965
1965-
1990
2011
2012
1921-
1946
Disposition I Tenant Representation
Capitol Markets I Acquisition
Finance I Asset & Risk Management
Business I Real Estate I Facilities
2019
2020
2021
Disposition I Tenant Representation
Capitol Markets I Acquisition
Finance I Asset & Risk Management
Business I Real Estate I Facilities
QUANTUM
HOLDINGS, LLC
2B
2B Rosemary
Homes, LLC
Design, Renovation & Flipping
19 21
TIMELINE -100 YEARS
1911
A COSTAR COMPANY
9 Strategic Alliance Coverage | Year End Report | First Half 2020 | Texas International Consultants,Incorporated | Stealth Realty Advisors,LLC
Forms Mendiola Properties.
Continues to buy up land.
Property management company officially
formed and staffed to manage existing
assets.
Texas International Consultants, Incorporated
is formed.
Buys Small homes & comm bldgs.
to rent.
Pamela Mendiola starts to take larger
role & ultimately takes over, changes
direction of company and forms
Mendiola Investments.
Sells home building, design,
construction, insurance & mortgage
business.
Invests in additional income properties
Buys undervalued property & local service
businesses, turns them around & sells for a
profit.
Incorporates Mendiola Investments & adds
Daughter Helen to board.
Joseph Mendiola returns from WWII &
Starts building spec homes and buildings on
Land a owned by by family.
Pamela is actively involved in all of the
business.
Construction, design, mortgage &
Insurance companies started.
Small commercial properties
constructed for clients.
Custom homes are built in Houston,
Friendswood, Pearland, LaPorte &
Seabrook areas.
Helen steps in as acting CEO during long illness
of Pamela & continues to buy and manage income
producing assets and subsidiary businesses while
continuing her commercial real estate consulting
practice with a special emphasis on healthcare
real estate.
In the Spring, Helen with her husband Jay,
change the direction of Mendiola
investments, Incorporated from a holding
company and family office to a third party
advisory and consulting business more
representative of her career of over 3
decades of commercial & healthcare real
estate.
Stealth Realty Advisors, LLC is formed to handle
the acquisition and disposition of property as
well as a result of consulting assignments.
Capital Markets is a service provided
for re-monetization and capitalization of
clients properties.
The TICI Group of Companies is formed.
Upon the passing of Pamela in late 2010, Helen
officially takes over a President/CEO and sells off
the side businesses and income producing assets in
four cities in two states.
Since the inception of taking over, Helen utilized over
decades of key industry contacts to facilitate transactions
on behalf of clients. Some of these relationships became
Strategic Alliance Partners & Advisors to TICI and its clients.
Helen becomes Chairman and CEO.
Two other companies are brought back and renamed. There
are h2B Quantum Holdings, LLC for personal investment
and Rosemary Homes, LLC in honor of Pamela
to purchase, renovate and resale properties.
With the added Strategic Alliance relationships the TICI
Group of Companies now has over 20 Partners and Advisors
in 17 States and continues to grow.
Because of all of this growth, Helen looked outside of the
family to bring in an experienced Healthcare Real Estate
professional to head up the newly formed Capital Markets - Healthcare.
Jim Coman, officially joined TICI in the spring and established
another Stealth Realty Advisors office in Charleston, SC.
In addition to Texas and the 17 states we have partners,
Jim is licensed in Texas, Georgia and North & South Carolina.
10 Strategic Alliance Coverage | Year End Report | First Half 2020 | Texas International Consultants,Incorporated | Stealth Realty Advisors,LLC
SPECIALACKNOWLEDGEMENTS
STRATEGIC ALLIANCE COVERAGE
Jim Kelley
Managing Principal,
Champions DFW
Commercial Realty
Larry Walshaw
National Director, Healthcare
KW Commercial Realty
Austin Earhart
Senior Advisor
Stirling Properties
Craig Pelouze
Senior Vice President
Commonwealth Commercial
Rick Egitto
Senior Vice President
Capital Markets
Avison Young
Jaimee Keene
Vice President
Avison Young
Bryan Shaffer
Managing Partner
George Smith Partners
Angela Kesselman
Managing Director
The Madison Group
Dean Hutchinson
Senior Analyst
National Urgent Care Realty
Mike Zelnik
Principal
National Urgent Care Realty
Julie Johnson
Executive Vice President
Colliers International
National Healthcare Group
Benjamin Bivens
Co-Founder/Principal
MedSouth Healthcare Properties
MedSouth Healthcare Management
19 21
Disposition I Tenant Representation
Capitol Markets I Acquisition
Finance I Asset & Risk Management
Business I Real Estate I Facilities
The Information contained herein has been obtained from sources
deemed reliable. While every reasonable effort has been made to ensure
its accuracy, we cannot guarantee it. No responsibility is assumed for any
inaccuracy. This report may not be reproduced in part or in whole without
the express written consent of The TICI Group of Companies.
FOR MORE INFORMATION
Helen Banks | Chairman
(713) 705-1598
helenbanks@ticigroup.com
Jim “JC”Coman
Managing Director Capital Markets -Healthcare
(843) 412-8714
jimcoman@ticigroup.com
CLOSING REMARKS
Helen Banks
Chairman
helenbanks@ticigroup.com
H. Jay Banks
Chief Risk Officer
jaybanks@ticigroup.com
James (Jim) Coman
Managing Director Capital Markets - Healthcare
jimcoman@ticigroup.com
Sarah Finney
Marketing & Research Director
sarahfinney@ticigroup.com
As I watched Tampa Bay Quarterback Tom Brady win his seventh Super Bowl, I knew I was watching history
happen seeing him take one more step towards being the GOAT in football. His discipline, pride, work ethic
and desire to continue to push barriers is one to envy.
2021 marks our families’ Centennial anniversary in the real estate business. Being the third generation to lead
the company, now in the national eye, is no less daunting than leading a championship team. The team
assembled within and that surround our organization is nothing short of championship material.
Collectively moving forward, we will continue to have the discipline, pride, work ethic, tools, and talent to stay
ahead of and even be a pioneer in our industry.
Having over 20 partners who are the “healthcare real estate leaders” in 17 states and who represent a full
complement of services allows us to fully engage our investors and put them first.
We hope you will find some insights within this report which will be of use within your organization. Our team,
being led by Jim Coman is close by to engage with you and your team to provide solutions for your healthcare
real estate goals.
Let us work together to push barriers and be champions!

More Related Content

What's hot

McKinsey Survey: British B2B decision maker response to COVID-19 crisis
McKinsey Survey: British B2B decision maker response to COVID-19 crisisMcKinsey Survey: British B2B decision maker response to COVID-19 crisis
McKinsey Survey: British B2B decision maker response to COVID-19 crisisMcKinsey on Marketing & Sales
 
McKinsey Survey: Colombian consumer sentiment during the coronavirus crisis
McKinsey Survey: Colombian consumer sentiment during the coronavirus crisisMcKinsey Survey: Colombian consumer sentiment during the coronavirus crisis
McKinsey Survey: Colombian consumer sentiment during the coronavirus crisisMcKinsey on Marketing & Sales
 
Chile's Consumer Pulse Update - August 2020
Chile's Consumer Pulse Update - August 2020Chile's Consumer Pulse Update - August 2020
Chile's Consumer Pulse Update - August 2020Bain & Company Brasil
 
McKinsey Survey: US consumer sentiment during the coronavirus crisis
McKinsey Survey: US consumer sentiment during the coronavirus crisisMcKinsey Survey: US consumer sentiment during the coronavirus crisis
McKinsey Survey: US consumer sentiment during the coronavirus crisisMcKinsey on Marketing & Sales
 
Colombia's Consumer Pulse Update - August 2020
Colombia's Consumer Pulse Update - August 2020Colombia's Consumer Pulse Update - August 2020
Colombia's Consumer Pulse Update - August 2020Bain & Company Brasil
 
Mercer Capital's Value Focus: Healthcare Facilities | Mid-Year 2016 |
Mercer Capital's Value Focus: Healthcare Facilities | Mid-Year 2016 |Mercer Capital's Value Focus: Healthcare Facilities | Mid-Year 2016 |
Mercer Capital's Value Focus: Healthcare Facilities | Mid-Year 2016 |Mercer Capital
 
StartUp Health Insights - Q1 2014 Update
StartUp Health Insights - Q1 2014 UpdateStartUp Health Insights - Q1 2014 Update
StartUp Health Insights - Q1 2014 UpdateStartUp Health
 
McKinsey Survey: Chinese consumer sentiment during the coronavirus crisis
McKinsey Survey: Chinese consumer sentiment during the coronavirus crisisMcKinsey Survey: Chinese consumer sentiment during the coronavirus crisis
McKinsey Survey: Chinese consumer sentiment during the coronavirus crisisMcKinsey on Marketing & Sales
 
COVID-19 Brazil's Consumer Pulse Update
COVID-19 Brazil's Consumer Pulse UpdateCOVID-19 Brazil's Consumer Pulse Update
COVID-19 Brazil's Consumer Pulse UpdateBain & Company Brasil
 
McKinsey Survey: Global B2B decision maker response to COVID-19 crisis
McKinsey Survey: Global B2B decision maker response to COVID-19 crisisMcKinsey Survey: Global B2B decision maker response to COVID-19 crisis
McKinsey Survey: Global B2B decision maker response to COVID-19 crisisMcKinsey on Marketing & Sales
 
McKinsey Survey: Chinese B2B decision maker response to COVID-19 crisis
McKinsey Survey: Chinese B2B decision maker response to COVID-19 crisisMcKinsey Survey: Chinese B2B decision maker response to COVID-19 crisis
McKinsey Survey: Chinese B2B decision maker response to COVID-19 crisisMcKinsey on Marketing & Sales
 
McKinsey Survey: Mexican consumer sentiment during the coronavirus crisis
McKinsey Survey: Mexican consumer sentiment during the coronavirus crisisMcKinsey Survey: Mexican consumer sentiment during the coronavirus crisis
McKinsey Survey: Mexican consumer sentiment during the coronavirus crisisMcKinsey on Marketing & Sales
 
McKinsey Survey: Spanish B2B decision maker response to COVID-19 crisis
McKinsey Survey: Spanish B2B decision maker response to COVID-19 crisisMcKinsey Survey: Spanish B2B decision maker response to COVID-19 crisis
McKinsey Survey: Spanish B2B decision maker response to COVID-19 crisisMcKinsey on Marketing & Sales
 
M&A: PwC Top Issues
M&A: PwC Top Issues   M&A: PwC Top Issues
M&A: PwC Top Issues PwC
 
McKinsey Survey: Central American consumer sentiment during the coronavirus c...
McKinsey Survey: Central American consumer sentiment during the coronavirus c...McKinsey Survey: Central American consumer sentiment during the coronavirus c...
McKinsey Survey: Central American consumer sentiment during the coronavirus c...McKinsey on Marketing & Sales
 
McKinsey Survey: Japanese consumer sentiment during the coronavirus crisis
McKinsey Survey: Japanese consumer sentiment during the coronavirus crisisMcKinsey Survey: Japanese consumer sentiment during the coronavirus crisis
McKinsey Survey: Japanese consumer sentiment during the coronavirus crisisMcKinsey on Marketing & Sales
 
McKinsey COVID-19 impact Morocco wave 3
McKinsey COVID-19 impact Morocco wave 3McKinsey COVID-19 impact Morocco wave 3
McKinsey COVID-19 impact Morocco wave 3John Euart
 

What's hot (20)

Healthcare Report Q2 2020
Healthcare Report Q2 2020Healthcare Report Q2 2020
Healthcare Report Q2 2020
 
McKinsey Survey: British B2B decision maker response to COVID-19 crisis
McKinsey Survey: British B2B decision maker response to COVID-19 crisisMcKinsey Survey: British B2B decision maker response to COVID-19 crisis
McKinsey Survey: British B2B decision maker response to COVID-19 crisis
 
McKinsey Survey: Colombian consumer sentiment during the coronavirus crisis
McKinsey Survey: Colombian consumer sentiment during the coronavirus crisisMcKinsey Survey: Colombian consumer sentiment during the coronavirus crisis
McKinsey Survey: Colombian consumer sentiment during the coronavirus crisis
 
Chile's Consumer Pulse Update - August 2020
Chile's Consumer Pulse Update - August 2020Chile's Consumer Pulse Update - August 2020
Chile's Consumer Pulse Update - August 2020
 
hex0815
hex0815hex0815
hex0815
 
Individual and Small-Group Healthcare Markets
Individual and Small-Group Healthcare MarketsIndividual and Small-Group Healthcare Markets
Individual and Small-Group Healthcare Markets
 
McKinsey Survey: US consumer sentiment during the coronavirus crisis
McKinsey Survey: US consumer sentiment during the coronavirus crisisMcKinsey Survey: US consumer sentiment during the coronavirus crisis
McKinsey Survey: US consumer sentiment during the coronavirus crisis
 
Colombia's Consumer Pulse Update - August 2020
Colombia's Consumer Pulse Update - August 2020Colombia's Consumer Pulse Update - August 2020
Colombia's Consumer Pulse Update - August 2020
 
Mercer Capital's Value Focus: Healthcare Facilities | Mid-Year 2016 |
Mercer Capital's Value Focus: Healthcare Facilities | Mid-Year 2016 |Mercer Capital's Value Focus: Healthcare Facilities | Mid-Year 2016 |
Mercer Capital's Value Focus: Healthcare Facilities | Mid-Year 2016 |
 
StartUp Health Insights - Q1 2014 Update
StartUp Health Insights - Q1 2014 UpdateStartUp Health Insights - Q1 2014 Update
StartUp Health Insights - Q1 2014 Update
 
McKinsey Survey: Chinese consumer sentiment during the coronavirus crisis
McKinsey Survey: Chinese consumer sentiment during the coronavirus crisisMcKinsey Survey: Chinese consumer sentiment during the coronavirus crisis
McKinsey Survey: Chinese consumer sentiment during the coronavirus crisis
 
COVID-19 Brazil's Consumer Pulse Update
COVID-19 Brazil's Consumer Pulse UpdateCOVID-19 Brazil's Consumer Pulse Update
COVID-19 Brazil's Consumer Pulse Update
 
McKinsey Survey: Global B2B decision maker response to COVID-19 crisis
McKinsey Survey: Global B2B decision maker response to COVID-19 crisisMcKinsey Survey: Global B2B decision maker response to COVID-19 crisis
McKinsey Survey: Global B2B decision maker response to COVID-19 crisis
 
McKinsey Survey: Chinese B2B decision maker response to COVID-19 crisis
McKinsey Survey: Chinese B2B decision maker response to COVID-19 crisisMcKinsey Survey: Chinese B2B decision maker response to COVID-19 crisis
McKinsey Survey: Chinese B2B decision maker response to COVID-19 crisis
 
McKinsey Survey: Mexican consumer sentiment during the coronavirus crisis
McKinsey Survey: Mexican consumer sentiment during the coronavirus crisisMcKinsey Survey: Mexican consumer sentiment during the coronavirus crisis
McKinsey Survey: Mexican consumer sentiment during the coronavirus crisis
 
McKinsey Survey: Spanish B2B decision maker response to COVID-19 crisis
McKinsey Survey: Spanish B2B decision maker response to COVID-19 crisisMcKinsey Survey: Spanish B2B decision maker response to COVID-19 crisis
McKinsey Survey: Spanish B2B decision maker response to COVID-19 crisis
 
M&A: PwC Top Issues
M&A: PwC Top Issues   M&A: PwC Top Issues
M&A: PwC Top Issues
 
McKinsey Survey: Central American consumer sentiment during the coronavirus c...
McKinsey Survey: Central American consumer sentiment during the coronavirus c...McKinsey Survey: Central American consumer sentiment during the coronavirus c...
McKinsey Survey: Central American consumer sentiment during the coronavirus c...
 
McKinsey Survey: Japanese consumer sentiment during the coronavirus crisis
McKinsey Survey: Japanese consumer sentiment during the coronavirus crisisMcKinsey Survey: Japanese consumer sentiment during the coronavirus crisis
McKinsey Survey: Japanese consumer sentiment during the coronavirus crisis
 
McKinsey COVID-19 impact Morocco wave 3
McKinsey COVID-19 impact Morocco wave 3McKinsey COVID-19 impact Morocco wave 3
McKinsey COVID-19 impact Morocco wave 3
 

Similar to Healthcare Bio-Life Science Real Estate Report

The 10 companies booming in healthcare sector small
The 10 companies booming in healthcare sector  smallThe 10 companies booming in healthcare sector  small
The 10 companies booming in healthcare sector smallinsightscare
 
The post-COVID Value Shift & How MedTech Companies can Capitalize
The post-COVID Value Shift & How MedTech Companies can CapitalizeThe post-COVID Value Shift & How MedTech Companies can Capitalize
The post-COVID Value Shift & How MedTech Companies can CapitalizeGreenlight Guru
 
The 10 Companies Booming in Healthcare Sector
The 10 Companies Booming in Healthcare SectorThe 10 Companies Booming in Healthcare Sector
The 10 Companies Booming in Healthcare Sectorinsightscare
 
Hospital Capacity Management: How to Prepare for COVID-19 Patient Surges
Hospital Capacity Management: How to Prepare for COVID-19 Patient SurgesHospital Capacity Management: How to Prepare for COVID-19 Patient Surges
Hospital Capacity Management: How to Prepare for COVID-19 Patient SurgesHealth Catalyst
 
mHealth Israel_GEARING COMMUNICATIONS TO RAISE CAPITAL AND ATTRACT CUSTOMERS_...
mHealth Israel_GEARING COMMUNICATIONS TO RAISE CAPITAL AND ATTRACT CUSTOMERS_...mHealth Israel_GEARING COMMUNICATIONS TO RAISE CAPITAL AND ATTRACT CUSTOMERS_...
mHealth Israel_GEARING COMMUNICATIONS TO RAISE CAPITAL AND ATTRACT CUSTOMERS_...Levi Shapiro
 
FINN Partners Global State of Digital Health Q3 2022
FINN Partners Global State of Digital Health Q3 2022FINN Partners Global State of Digital Health Q3 2022
FINN Partners Global State of Digital Health Q3 2022Levi Shapiro
 
Highlights from HLTH 2019
Highlights from HLTH 2019Highlights from HLTH 2019
Highlights from HLTH 2019Lyn Falconio
 
Pharma Market Research Report Dec 2013
Pharma Market Research Report Dec 2013Pharma Market Research Report Dec 2013
Pharma Market Research Report Dec 2013Brian Attig
 
R&D To Commercialisation - LSX C-Suite Challenges in Life Sciences Survey 201...
R&D To Commercialisation - LSX C-Suite Challenges in Life Sciences Survey 201...R&D To Commercialisation - LSX C-Suite Challenges in Life Sciences Survey 201...
R&D To Commercialisation - LSX C-Suite Challenges in Life Sciences Survey 201...Covance
 
Is Technology Removing the ‘Care’ from Healthcare?
Is Technology Removing the ‘Care’ from Healthcare?Is Technology Removing the ‘Care’ from Healthcare?
Is Technology Removing the ‘Care’ from Healthcare?MSL
 
Health Innovation Frontiers 2014 | Whats your 50+ strategy
 Health Innovation Frontiers 2014 | Whats your 50+ strategy Health Innovation Frontiers 2014 | Whats your 50+ strategy
Health Innovation Frontiers 2014 | Whats your 50+ strategySanjay Khurana
 
HAS 20 Virtual: Reimagining the Healthcare Conference
HAS 20 Virtual: Reimagining the Healthcare ConferenceHAS 20 Virtual: Reimagining the Healthcare Conference
HAS 20 Virtual: Reimagining the Healthcare ConferenceHealth Catalyst
 
P2Health Ventures Overview
P2Health Ventures OverviewP2Health Ventures Overview
P2Health Ventures OverviewVanessa Mason
 
Pharma 2020 - Virtual R&D
Pharma 2020 - Virtual R&DPharma 2020 - Virtual R&D
Pharma 2020 - Virtual R&DOnly Medics
 
Key Growth Sectors in the Health Care Services M&A Market
Key Growth Sectors in the Health Care Services M&A MarketKey Growth Sectors in the Health Care Services M&A Market
Key Growth Sectors in the Health Care Services M&A MarketRobert James Cimasi
 
COVID-19 Data and Analytics: Survey Reveals Long- and Short-Term Healthcare I...
COVID-19 Data and Analytics: Survey Reveals Long- and Short-Term Healthcare I...COVID-19 Data and Analytics: Survey Reveals Long- and Short-Term Healthcare I...
COVID-19 Data and Analytics: Survey Reveals Long- and Short-Term Healthcare I...Health Catalyst
 

Similar to Healthcare Bio-Life Science Real Estate Report (20)

The 10 companies booming in healthcare sector small
The 10 companies booming in healthcare sector  smallThe 10 companies booming in healthcare sector  small
The 10 companies booming in healthcare sector small
 
Covid 19 - Year One
Covid 19 - Year OneCovid 19 - Year One
Covid 19 - Year One
 
The post-COVID Value Shift & How MedTech Companies can Capitalize
The post-COVID Value Shift & How MedTech Companies can CapitalizeThe post-COVID Value Shift & How MedTech Companies can Capitalize
The post-COVID Value Shift & How MedTech Companies can Capitalize
 
The 10 Companies Booming in Healthcare Sector
The 10 Companies Booming in Healthcare SectorThe 10 Companies Booming in Healthcare Sector
The 10 Companies Booming in Healthcare Sector
 
Health tech & endless opportunities
Health tech & endless opportunitiesHealth tech & endless opportunities
Health tech & endless opportunities
 
Hospital Capacity Management: How to Prepare for COVID-19 Patient Surges
Hospital Capacity Management: How to Prepare for COVID-19 Patient SurgesHospital Capacity Management: How to Prepare for COVID-19 Patient Surges
Hospital Capacity Management: How to Prepare for COVID-19 Patient Surges
 
mHealth Israel_GEARING COMMUNICATIONS TO RAISE CAPITAL AND ATTRACT CUSTOMERS_...
mHealth Israel_GEARING COMMUNICATIONS TO RAISE CAPITAL AND ATTRACT CUSTOMERS_...mHealth Israel_GEARING COMMUNICATIONS TO RAISE CAPITAL AND ATTRACT CUSTOMERS_...
mHealth Israel_GEARING COMMUNICATIONS TO RAISE CAPITAL AND ATTRACT CUSTOMERS_...
 
FINN Partners Global State of Digital Health Q3 2022
FINN Partners Global State of Digital Health Q3 2022FINN Partners Global State of Digital Health Q3 2022
FINN Partners Global State of Digital Health Q3 2022
 
Highlights from HLTH 2019
Highlights from HLTH 2019Highlights from HLTH 2019
Highlights from HLTH 2019
 
Pharma Market Research Report Dec 2013
Pharma Market Research Report Dec 2013Pharma Market Research Report Dec 2013
Pharma Market Research Report Dec 2013
 
R&D To Commercialisation - LSX C-Suite Challenges in Life Sciences Survey 201...
R&D To Commercialisation - LSX C-Suite Challenges in Life Sciences Survey 201...R&D To Commercialisation - LSX C-Suite Challenges in Life Sciences Survey 201...
R&D To Commercialisation - LSX C-Suite Challenges in Life Sciences Survey 201...
 
Is Technology Removing the ‘Care’ from Healthcare?
Is Technology Removing the ‘Care’ from Healthcare?Is Technology Removing the ‘Care’ from Healthcare?
Is Technology Removing the ‘Care’ from Healthcare?
 
Shifting Expectations Mexico
Shifting Expectations MexicoShifting Expectations Mexico
Shifting Expectations Mexico
 
Health Innovation Frontiers 2014 | Whats your 50+ strategy
 Health Innovation Frontiers 2014 | Whats your 50+ strategy Health Innovation Frontiers 2014 | Whats your 50+ strategy
Health Innovation Frontiers 2014 | Whats your 50+ strategy
 
HAS 20 Virtual: Reimagining the Healthcare Conference
HAS 20 Virtual: Reimagining the Healthcare ConferenceHAS 20 Virtual: Reimagining the Healthcare Conference
HAS 20 Virtual: Reimagining the Healthcare Conference
 
P2Health Ventures Overview
P2Health Ventures OverviewP2Health Ventures Overview
P2Health Ventures Overview
 
Pharma 2020 - Virtual R&D
Pharma 2020 - Virtual R&DPharma 2020 - Virtual R&D
Pharma 2020 - Virtual R&D
 
LSEN Biotech Bulletin
LSEN Biotech BulletinLSEN Biotech Bulletin
LSEN Biotech Bulletin
 
Key Growth Sectors in the Health Care Services M&A Market
Key Growth Sectors in the Health Care Services M&A MarketKey Growth Sectors in the Health Care Services M&A Market
Key Growth Sectors in the Health Care Services M&A Market
 
COVID-19 Data and Analytics: Survey Reveals Long- and Short-Term Healthcare I...
COVID-19 Data and Analytics: Survey Reveals Long- and Short-Term Healthcare I...COVID-19 Data and Analytics: Survey Reveals Long- and Short-Term Healthcare I...
COVID-19 Data and Analytics: Survey Reveals Long- and Short-Term Healthcare I...
 

More from The TICI Group of Companies

Bio Life Science Real Estate_Acquisition Criteria.pdf
Bio Life Science Real Estate_Acquisition Criteria.pdfBio Life Science Real Estate_Acquisition Criteria.pdf
Bio Life Science Real Estate_Acquisition Criteria.pdfThe TICI Group of Companies
 
2021 Healthcare & Bio Life Science Year End Market Report
2021 Healthcare & Bio Life Science Year End Market Report2021 Healthcare & Bio Life Science Year End Market Report
2021 Healthcare & Bio Life Science Year End Market ReportThe TICI Group of Companies
 

More from The TICI Group of Companies (15)

About Us.pdf
About Us.pdfAbout Us.pdf
About Us.pdf
 
Experience & Commitment.pdf
Experience & Commitment.pdfExperience & Commitment.pdf
Experience & Commitment.pdf
 
Healthcare-Real-Estate-Solutions_Flyer.pdf
Healthcare-Real-Estate-Solutions_Flyer.pdfHealthcare-Real-Estate-Solutions_Flyer.pdf
Healthcare-Real-Estate-Solutions_Flyer.pdf
 
Strategic Alliance brochure_5.2022.pdf
Strategic Alliance brochure_5.2022.pdfStrategic Alliance brochure_5.2022.pdf
Strategic Alliance brochure_5.2022.pdf
 
Steallth Menu of Services.pdf
Steallth Menu of Services.pdfSteallth Menu of Services.pdf
Steallth Menu of Services.pdf
 
Texas International Menu of Services.pdf
Texas International Menu of Services.pdfTexas International Menu of Services.pdf
Texas International Menu of Services.pdf
 
Bio Life Science Real Estate_Acquisition Criteria.pdf
Bio Life Science Real Estate_Acquisition Criteria.pdfBio Life Science Real Estate_Acquisition Criteria.pdf
Bio Life Science Real Estate_Acquisition Criteria.pdf
 
Healthcare_Bio Life_Acquisition Criteria.pdf
Healthcare_Bio Life_Acquisition Criteria.pdfHealthcare_Bio Life_Acquisition Criteria.pdf
Healthcare_Bio Life_Acquisition Criteria.pdf
 
Banking Real Estate Solutions_Flyer.pdf
Banking Real Estate Solutions_Flyer.pdfBanking Real Estate Solutions_Flyer.pdf
Banking Real Estate Solutions_Flyer.pdf
 
Healthcare_Bio Life_Acquisition Criteria.pdf
Healthcare_Bio Life_Acquisition Criteria.pdfHealthcare_Bio Life_Acquisition Criteria.pdf
Healthcare_Bio Life_Acquisition Criteria.pdf
 
2021 Healthcare & Bio Life Science Year End Market Report
2021 Healthcare & Bio Life Science Year End Market Report2021 Healthcare & Bio Life Science Year End Market Report
2021 Healthcare & Bio Life Science Year End Market Report
 
Bio Life Science Real Estate Alliance
Bio Life Science Real Estate AllianceBio Life Science Real Estate Alliance
Bio Life Science Real Estate Alliance
 
Semi annual report
Semi annual reportSemi annual report
Semi annual report
 
Ten X Commercial Marketing (007)
Ten X Commercial Marketing (007)Ten X Commercial Marketing (007)
Ten X Commercial Marketing (007)
 
Announcement pdf 5 28
Announcement pdf 5 28Announcement pdf 5 28
Announcement pdf 5 28
 

Recently uploaded

83770-87607 ۞Call Girls In Near The Park Hotel (Cp) Delhi
83770-87607 ۞Call Girls In Near The Park Hotel (Cp) Delhi83770-87607 ۞Call Girls In Near The Park Hotel (Cp) Delhi
83770-87607 ۞Call Girls In Near The Park Hotel (Cp) Delhidollysharma2066
 
Rustomjee The Panorama At Pali Hill, Bandra West, Mumbai - Brochure.pdf
Rustomjee The Panorama At Pali Hill, Bandra West, Mumbai - Brochure.pdfRustomjee The Panorama At Pali Hill, Bandra West, Mumbai - Brochure.pdf
Rustomjee The Panorama At Pali Hill, Bandra West, Mumbai - Brochure.pdfmonikasharma630
 
How to Build Multifamily and Laneway Suites in Toronto!! (feat. Expert Archi...
How to Build Multifamily and Laneway Suites  in Toronto!! (feat. Expert Archi...How to Build Multifamily and Laneway Suites  in Toronto!! (feat. Expert Archi...
How to Build Multifamily and Laneway Suites in Toronto!! (feat. Expert Archi...Volition Properties
 
Listing Turkey Sylvana Istanbul - Bahcesehir
Listing Turkey Sylvana Istanbul - BahcesehirListing Turkey Sylvana Istanbul - Bahcesehir
Listing Turkey Sylvana Istanbul - BahcesehirListing Turkey
 
Call Girls in Kashmiri Gate Delhi 💯Call Us 🔝8264348440🔝
Call Girls in Kashmiri Gate Delhi 💯Call Us 🔝8264348440🔝Call Girls in Kashmiri Gate Delhi 💯Call Us 🔝8264348440🔝
Call Girls in Kashmiri Gate Delhi 💯Call Us 🔝8264348440🔝soniya singh
 
9990771857 Call Girls in Noida Sector 06 Noida (Call Girls) Delhi
9990771857 Call Girls in Noida Sector 06 Noida (Call Girls) Delhi9990771857 Call Girls in Noida Sector 06 Noida (Call Girls) Delhi
9990771857 Call Girls in Noida Sector 06 Noida (Call Girls) Delhidelhimodel235
 
9990771857 Call Girls in Noida Sector 10 Noida (Call Girls) Delhi
9990771857 Call Girls in Noida Sector 10 Noida (Call Girls) Delhi9990771857 Call Girls in Noida Sector 10 Noida (Call Girls) Delhi
9990771857 Call Girls in Noida Sector 10 Noida (Call Girls) Delhidelhimodel235
 
Model Call Girl in Shastri Nagar Delhi reach out to us at 🔝8264348440🔝
Model Call Girl in Shastri Nagar Delhi reach out to us at 🔝8264348440🔝Model Call Girl in Shastri Nagar Delhi reach out to us at 🔝8264348440🔝
Model Call Girl in Shastri Nagar Delhi reach out to us at 🔝8264348440🔝soniya singh
 
8 Key Elements for Comfortable Farmland Living
8 Key Elements for Comfortable Farmland Living 8 Key Elements for Comfortable Farmland Living
8 Key Elements for Comfortable Farmland Living Farmland Bazaar
 
SSPL The Strand Abodes Kharadi Pune Brochure.pdf
SSPL The Strand Abodes Kharadi Pune Brochure.pdfSSPL The Strand Abodes Kharadi Pune Brochure.pdf
SSPL The Strand Abodes Kharadi Pune Brochure.pdfabbu831446
 
Telibagh & Call Girls Lucknow - 450+ Call Girl Cash Payment 🎂 8923113531 🎪 Ne...
Telibagh & Call Girls Lucknow - 450+ Call Girl Cash Payment 🎂 8923113531 🎪 Ne...Telibagh & Call Girls Lucknow - 450+ Call Girl Cash Payment 🎂 8923113531 🎪 Ne...
Telibagh & Call Girls Lucknow - 450+ Call Girl Cash Payment 🎂 8923113531 🎪 Ne...gurkirankumar98700
 
9990771857 Call Girls in Noida Sector 34 Noida (Call Girls) Delhi
9990771857 Call Girls in Noida Sector 34 Noida (Call Girls) Delhi9990771857 Call Girls in Noida Sector 34 Noida (Call Girls) Delhi
9990771857 Call Girls in Noida Sector 34 Noida (Call Girls) Delhidelhimodel235
 
call girls in Shahdara (DELHI) 🔝 >༒9953330565🔝 genuine Escort Service 🔝✔️✔️
call girls in Shahdara (DELHI) 🔝 >༒9953330565🔝 genuine Escort Service 🔝✔️✔️call girls in Shahdara (DELHI) 🔝 >༒9953330565🔝 genuine Escort Service 🔝✔️✔️
call girls in Shahdara (DELHI) 🔝 >༒9953330565🔝 genuine Escort Service 🔝✔️✔️9953056974 Low Rate Call Girls In Saket, Delhi NCR
 
Nanke Area Estate commercial ( Dir. Kat Kuo)
Nanke Area Estate commercial ( Dir. Kat Kuo)Nanke Area Estate commercial ( Dir. Kat Kuo)
Nanke Area Estate commercial ( Dir. Kat Kuo)jessica288382
 
Omaxe Dwarka In Delhi E Brochure Pdf
Omaxe Dwarka In Delhi E Brochure     PdfOmaxe Dwarka In Delhi E Brochure     Pdf
Omaxe Dwarka In Delhi E Brochure Pdfashiyadav24
 
Call Girls in Pitampura Delhi 💯Call Us 🔝8264348440🔝
Call Girls in Pitampura Delhi 💯Call Us 🔝8264348440🔝Call Girls in Pitampura Delhi 💯Call Us 🔝8264348440🔝
Call Girls in Pitampura Delhi 💯Call Us 🔝8264348440🔝soniya singh
 
Cashpay_Call Girls In Gaur City Mall Noida ❤️8860477959 Escorts Service In 24...
Cashpay_Call Girls In Gaur City Mall Noida ❤️8860477959 Escorts Service In 24...Cashpay_Call Girls In Gaur City Mall Noida ❤️8860477959 Escorts Service In 24...
Cashpay_Call Girls In Gaur City Mall Noida ❤️8860477959 Escorts Service In 24...lizamodels9
 
Low Rate Call Girls in Tughlakabad Delhi Call 9990771857
Low Rate Call Girls in Tughlakabad Delhi Call 9990771857Low Rate Call Girls in Tughlakabad Delhi Call 9990771857
Low Rate Call Girls in Tughlakabad Delhi Call 9990771857delhimodel235
 

Recently uploaded (20)

83770-87607 ۞Call Girls In Near The Park Hotel (Cp) Delhi
83770-87607 ۞Call Girls In Near The Park Hotel (Cp) Delhi83770-87607 ۞Call Girls In Near The Park Hotel (Cp) Delhi
83770-87607 ۞Call Girls In Near The Park Hotel (Cp) Delhi
 
Rustomjee The Panorama At Pali Hill, Bandra West, Mumbai - Brochure.pdf
Rustomjee The Panorama At Pali Hill, Bandra West, Mumbai - Brochure.pdfRustomjee The Panorama At Pali Hill, Bandra West, Mumbai - Brochure.pdf
Rustomjee The Panorama At Pali Hill, Bandra West, Mumbai - Brochure.pdf
 
How to Build Multifamily and Laneway Suites in Toronto!! (feat. Expert Archi...
How to Build Multifamily and Laneway Suites  in Toronto!! (feat. Expert Archi...How to Build Multifamily and Laneway Suites  in Toronto!! (feat. Expert Archi...
How to Build Multifamily and Laneway Suites in Toronto!! (feat. Expert Archi...
 
Listing Turkey Sylvana Istanbul - Bahcesehir
Listing Turkey Sylvana Istanbul - BahcesehirListing Turkey Sylvana Istanbul - Bahcesehir
Listing Turkey Sylvana Istanbul - Bahcesehir
 
Call Girls in Kashmiri Gate Delhi 💯Call Us 🔝8264348440🔝
Call Girls in Kashmiri Gate Delhi 💯Call Us 🔝8264348440🔝Call Girls in Kashmiri Gate Delhi 💯Call Us 🔝8264348440🔝
Call Girls in Kashmiri Gate Delhi 💯Call Us 🔝8264348440🔝
 
9990771857 Call Girls in Noida Sector 06 Noida (Call Girls) Delhi
9990771857 Call Girls in Noida Sector 06 Noida (Call Girls) Delhi9990771857 Call Girls in Noida Sector 06 Noida (Call Girls) Delhi
9990771857 Call Girls in Noida Sector 06 Noida (Call Girls) Delhi
 
9990771857 Call Girls in Noida Sector 10 Noida (Call Girls) Delhi
9990771857 Call Girls in Noida Sector 10 Noida (Call Girls) Delhi9990771857 Call Girls in Noida Sector 10 Noida (Call Girls) Delhi
9990771857 Call Girls in Noida Sector 10 Noida (Call Girls) Delhi
 
Call Girls in Mahavir Nagar whatsaap call US +919953056974
Call Girls in Mahavir Nagar  whatsaap call US  +919953056974Call Girls in Mahavir Nagar  whatsaap call US  +919953056974
Call Girls in Mahavir Nagar whatsaap call US +919953056974
 
Model Call Girl in Shastri Nagar Delhi reach out to us at 🔝8264348440🔝
Model Call Girl in Shastri Nagar Delhi reach out to us at 🔝8264348440🔝Model Call Girl in Shastri Nagar Delhi reach out to us at 🔝8264348440🔝
Model Call Girl in Shastri Nagar Delhi reach out to us at 🔝8264348440🔝
 
8 Key Elements for Comfortable Farmland Living
8 Key Elements for Comfortable Farmland Living 8 Key Elements for Comfortable Farmland Living
8 Key Elements for Comfortable Farmland Living
 
SSPL The Strand Abodes Kharadi Pune Brochure.pdf
SSPL The Strand Abodes Kharadi Pune Brochure.pdfSSPL The Strand Abodes Kharadi Pune Brochure.pdf
SSPL The Strand Abodes Kharadi Pune Brochure.pdf
 
Telibagh & Call Girls Lucknow - 450+ Call Girl Cash Payment 🎂 8923113531 🎪 Ne...
Telibagh & Call Girls Lucknow - 450+ Call Girl Cash Payment 🎂 8923113531 🎪 Ne...Telibagh & Call Girls Lucknow - 450+ Call Girl Cash Payment 🎂 8923113531 🎪 Ne...
Telibagh & Call Girls Lucknow - 450+ Call Girl Cash Payment 🎂 8923113531 🎪 Ne...
 
9990771857 Call Girls in Noida Sector 34 Noida (Call Girls) Delhi
9990771857 Call Girls in Noida Sector 34 Noida (Call Girls) Delhi9990771857 Call Girls in Noida Sector 34 Noida (Call Girls) Delhi
9990771857 Call Girls in Noida Sector 34 Noida (Call Girls) Delhi
 
call girls in Shahdara (DELHI) 🔝 >༒9953330565🔝 genuine Escort Service 🔝✔️✔️
call girls in Shahdara (DELHI) 🔝 >༒9953330565🔝 genuine Escort Service 🔝✔️✔️call girls in Shahdara (DELHI) 🔝 >༒9953330565🔝 genuine Escort Service 🔝✔️✔️
call girls in Shahdara (DELHI) 🔝 >༒9953330565🔝 genuine Escort Service 🔝✔️✔️
 
Hot call girls in Moti Bagh🔝 9953056974 🔝 escort Service
Hot call girls in Moti Bagh🔝 9953056974 🔝 escort ServiceHot call girls in Moti Bagh🔝 9953056974 🔝 escort Service
Hot call girls in Moti Bagh🔝 9953056974 🔝 escort Service
 
Nanke Area Estate commercial ( Dir. Kat Kuo)
Nanke Area Estate commercial ( Dir. Kat Kuo)Nanke Area Estate commercial ( Dir. Kat Kuo)
Nanke Area Estate commercial ( Dir. Kat Kuo)
 
Omaxe Dwarka In Delhi E Brochure Pdf
Omaxe Dwarka In Delhi E Brochure     PdfOmaxe Dwarka In Delhi E Brochure     Pdf
Omaxe Dwarka In Delhi E Brochure Pdf
 
Call Girls in Pitampura Delhi 💯Call Us 🔝8264348440🔝
Call Girls in Pitampura Delhi 💯Call Us 🔝8264348440🔝Call Girls in Pitampura Delhi 💯Call Us 🔝8264348440🔝
Call Girls in Pitampura Delhi 💯Call Us 🔝8264348440🔝
 
Cashpay_Call Girls In Gaur City Mall Noida ❤️8860477959 Escorts Service In 24...
Cashpay_Call Girls In Gaur City Mall Noida ❤️8860477959 Escorts Service In 24...Cashpay_Call Girls In Gaur City Mall Noida ❤️8860477959 Escorts Service In 24...
Cashpay_Call Girls In Gaur City Mall Noida ❤️8860477959 Escorts Service In 24...
 
Low Rate Call Girls in Tughlakabad Delhi Call 9990771857
Low Rate Call Girls in Tughlakabad Delhi Call 9990771857Low Rate Call Girls in Tughlakabad Delhi Call 9990771857
Low Rate Call Girls in Tughlakabad Delhi Call 9990771857
 

Healthcare Bio-Life Science Real Estate Report

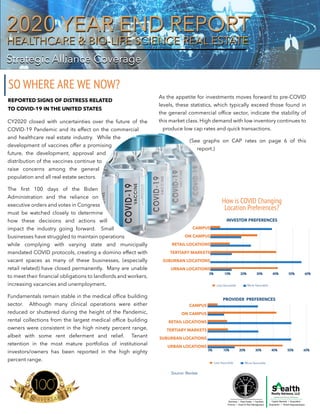
  • 1. INVESTOR PREFERENCES PROVIDER PREFERENCES CAMPUS ON CAMPUS RETAIL LOCATIONS TERTIARY MARKETS SUBURBAN LOCATIONS URBAN LOCATIONS Less favorable More favorable Less favorable More favorable 19 21 Disposition I Tenant Representation Capitol Markets I Acquisition Finance I Asset & Risk Management Business I Real Estate I Facilities Strategic Alliance Coverage Strategic Alliance Coverage HEALTHCARE & BIO-LIFE SCIENCE REAL ESTATE HEALTHCARE & BIO-LIFE SCIENCE REAL ESTATE 2020 YEAR END REPORT 2020 YEAR END REPORT SO WHERE ARE WE NOW? CY2020 closed with uncertainties over the future of the COVID-19 Pandemic and its effect on the commercial and healthcare real estate industry. While the development of vaccines offer a promising future, the development, approval and distribution of the vaccines continue to raise concerns among the general population and all real estate sectors. The first 100 days of the Biden Administration and the reliance on executive orders and votes in Congress must be watched closely to determine how these decisions and actions will impact the industry going forward. Small businesses have struggled to maintain operations while complying with varying state and municipally mandated COVID protocols, creating a domino effect with vacant spaces as many of these businesses, (especially retail related) have closed permanently. Many are unable to meet their financial obligations to landlords and workers, increasing vacancies and unemployment. Fundamentals remain stable in the medical office building sector. Although many clinical operations were either reduced or shuttered during the height of the Pandemic, rental collections from the largest medical office building owners were consistent in the high ninety percent range, albeit with some rent deferment and relief. Tenant retention in the most mature portfolios of institutional investors/owners has been reported in the high eighty percent range. REPORTED SIGNS OF DISTRESS RELATED TO COVID-19 IN THE UNITED STATES Source: Revista As the appetite for investments moves forward to pre-COVID levels, these statistics, which typically exceed those found in the general commercial office sector, indicate the stability of this market class. High demand with low inventory continues to produce low cap rates and quick transactions. (See graphs on CAP rates on page 6 of this report.) How is COVID Changing Location Preferences? CAMPUS ON CAMPUS RETAIL LOCATIONS TERTIARY MARKETS SUBURBAN LOCATIONS URBAN LOCATIONS
  • 2. CHANGES & OPPORTUNITIES Tele-Health 80% 60% Of all US counties Of all rural counties 50% 75% Number of hospital visits to emergency departments with mental disorders as a primary diagnosis. Number of visits to physician Offices per year with medical Disorders as the primary diagnosis. 59.8 M Increase in mental health issues in the ER from 2014-2017 # of hospitals that have closed since 2010 Are at extreme risk of closing soon 100 1in5 5.5 M +42% The rise in tele-health since the onset of the pandemic has created much discussion among healthcare professionals. Even as patients receive tele-health services at home, practitioners will need space for such calls, remote monitoring and diagnostic equipment. Patients will still have the need for office visits to assess conditions requiring more extensive evaluation. Tele- health has the potential to maximize productivity, thus potentially reducing (but not eliminating) the need for significant square footage. We address this more in the next section on redesign and use of medical space. AVAILABILITY & SHORTAGE 1/20/2020 3/10/2020 4/29/2020 6/18/2020 8/7/2020 9/262020 11/152020 11% 35% 46% 52% 46% 36% 29% 20% 20%18% 16% 15% 15% 19% Tele-health Visits Stabilize Source: The Chartis Group & Kythera Labs 2 Strategic Alliance Coverage | Year End Report | Second Half 2020 | Texas International Consultants,Incorporated | Stealth Realty Advisors,LLC REPORTED LEVELS OF DISTRESS HIGH DISTRESS MEDIUM DISTRESS LOW DISTRESS ALL RESPONDENTS JOB LOSS 27% 53% 20% 34% 53% 13% HIGH DISTRESS MEDIUM DISTRESS LOW DISTRESS ALL RESPONDENTS JOB LOSS 27% 53% 20% 34% 53% 13% n-1,062 n-319 REPORTED FEELING ANXIOUS n-1,062 n-319 BOTH ANXIOUS & DEPRESSED ANXIOUS BUT NOT DEPRESSED DEPRESSED BUT NOT ANXIOUS NEITHER ALL RESPONDENTS JOB LOSS 23% 5% 20% 42% 26% 26% ALL RESPONDENTS JOB LOSS 37% 35% 63 74 6% Source: McKinsey COVID-19 Consumer Survey An emerging opportunity in the healthcare real estate sector is behavioral health. Many of these transactions involve sale-leaseback, allowing owner/operators to invest available funds in expanding operations and developing, with a partner, additional facilities. Shortage of Supply: In 2018, supply was 3.8 million square feet. This increased to 8.1 million square feet in 2019. In 2020, developers were anticipated to deliver 6.4 million square feet with supply still not meeting demand. Many players are actively pursuing this sector: expansion of acute care psychiatric hospitals and units; substance abuse and eating disorder treatment providers; residential, outpatient and adolescent treatment facilities; community mental health centers; and autism treatment center operators. Construction costs in CY2020 held relatively stable at $403.00 per square foot. While approximately 5.5 million people with behavioral health conditions seek treatment each year in emergency rooms, many of these facilities do not have clinicians with the skills to treat these patients. The stigma of mental health conditions is decreasing, contributing to the demand for specialized behavioral health services and facilities to treat such. This increasing demand has also created an increase in institutional and investment capital evaluating the space such as private equity and venture capital funds. Specialty healthcare REITs are expanding their behavioral health portfolios. Behavioral Health Source: The Chartis Group, Kythera Labs and Revista Tele-health Adoption by Specialty Varies PSYCHIARTY NEUROLOGY INTERNAL MEDICINE GASTROENTEROLOGY PULMONOLOGY FAMILY MEDICINE PEDIATRICS RADIATION ONCOLOGY NEUROSURGERY CARDIOLOGY HEMATOLOGY/ONCOLOGY OBSTETRICS & GYNECOLOGY UROLOGY GENERAL SURGERY CARDIOVASCULAR SURGEY DERMATOLOGY OTOLARYNGOLOGY ORTHOPAEDICS OPHTHALMOLOGY 65% 31.8% 24.6% 24.5% 23.4% 23.0% 18.4% 15.2% 13.9% 11.2% 9.8% 8.1% 7.8% 7.5% 7.3% 3.6% 2.8% 2.6% 0.7% Levels of Demand by Consumers Source: McKinsey COVID-19 Consumer Survey ENOUGH TO FILL
  • 3. Both landlords and architects must address the new climate and responsibilities in which our healthcare professionals find themselves. When considering the changes from the effect of COVID there are two areas of concern: 1) the healthcare provider and their staff and 2) the patient. Designers can create unique amenity spaces that enhance excellence in patient care and promote efficiency and enhance care standards. Numerous studies conducted by The Harvard School of Public Health and Cornell University have shown that daylighting, air quality and bringing nature and natural forms into a facility not only reduce stress, but also increase productivity. A 233,973-square-foot multi-specialty ambulatory healthcare center that was developed in The Villages in Central Florida is an example of the newer, bigger and more efficient design. The four story CAHB medical office building provides urgent care services, diagnostic imaging and laboratory services, outpatient pediatric rehabilitation services, and five distinct medical specialty practices. In addition, it offers radiation oncology and outpatient labs; retail services including an audiology center, health and technology education center, pharmacy and coffee shop; outpatient surgery and dermatology. Included are 13 specialist offices with diagnostic and procedural suites. “Having this collection of outpatient services under one roof versus multiple destinations throughout The Villages provides a patient- centered destination of care in which the various services complement each other ” commented the owner, The Villages CAHB, LLC. It was designed by Earl Swensson Associates in Nashville. Nurturing the Nurturer with Spaces that Support, De-stress + Connect The case for nurturing the nurturer. Healthcare professions (specifically nursing) are ranked sixth among the most stressful professions. Multiple studies suggest that healthcare professionals are more prone to stress and occupational burnout because they are responsible for human lives. The term “nurture” is commonly used in the alliterative expression “nature versus nurture,” Inspiring and even “prime real estate” spaces within the building with desirable views offer a reprieve for staff who work tirelessly caring for others. Playful lighting, lounge-style seating, standing height tables/stools and booths can depart from the clinical setting and foster interactions that build trust, a sense of belonging and esteem. Some of the most successful amenity spaces for healthcare professionals include food amenity spaces, break rooms, connection to outdoors, wellness spaces, staff lounges, and smaller staff nourishment areas close to their working space. Look for this design to start taking shape in future buildout or retrofits of existing space. SOURCE: Healthcare Design OLD DESIGN NEW DESIGN RETHINKING DESIGN AND PROCESS FOR BETTER DELIVERY OF SERVICES OLD DESIGN NEW DESIGN 3 Strategic Alliance Coverage | Year End Report | Second Half 2020 | Texas International Consultants,Incorporated | Stealth Realty Advisors,LLC NEW INTERIOR STAFF LOUNGE NEW EXTERIOR BREAK AREAS FOR HEALTHCARE PROFESSIONALS
  • 4. BUYERS Ventas Alexandria Alexandria Brookfield EdgeConneX LOCATION 8th San Fran, US Durham, US Waltham, US Didcot, UK Santa Clara, US Vol (Sm) 1,002 530 300 144 83 Size (sf) 803,186 1,889,271, 549,889 1,502,041 219,083 # Props 3 4 2 5 3 Top Buyers since Jan 2019 Single Assets BUYERS PRP Swift Healthpeak KLP Forsikring IQHQ LOCATION Irvine, US Cupertino, US Waltham, US Stockholm, SWE Boston, US Vol (Sm) 355 346 320 270 270 Size (sf) 680,900 373,402 426,004 242,190 285,556 Portfolio BUYERS Ventas Alexandria Alexandria Brookfield EdgeConneX LOCATION 8th San Fran, US Durham, US Waltham, US Didcot, UK Santa Clara, US Vol (Sm) 1,002 530 300 144 83 Size (sf) 803,186 1,889,271, 549,889 1,502,041 219,083 # Props 3 4 2 5 3 BIO LIFE SCIENCE - ITS MAJOR MARKETS,OWNERS AND TRANSACTIONS Source: JLL research, Real Capital Analytics Source: JLL, Crunchbase Source:Real Capital Analytics LIFE SCIENCES TRANSACTIONS VOLUME Overall transaction volume (Billions $US) 2017 2018 2019 TTM ENDING 4/2020 ACTIVE LIFE SCIENCE INVESTORS Number of unique buyers 2017 2018 2019 TTM ENDING 4/2020 According to Real Capital Analytics, COVID-19 has accelerated the structural trends that were already reshaping the commercial property investment landscape. A large portion of the retail sector is now viewed as un- investable, and parts of the medical office building market are being viewed more cautiously. Investors are therefore looking to deploy capital in other market sectors. The bio/life science niche has seen an influx of capital investment, not only due to COVID-19 but to advancements in technology, data capture and analysis, and a rapidly aging population. The nature of the industry and on-going research means the sector tends to locate in clusters, often linked to universities. These locations include Boston, San Francisco, Seattle, Austin, Houston, North Carolina and Maryland. According to Real Capital Analytics data, $9 billion of bio/life sciences property is under construction, with $2.5 billion in the Boston area, $1.2 billion in San Diego, and $1 billion in Austin. One of the emerging markets is Houston, home to the largest medical center in the world. Many bio/life science companies spin out of these major medical and academic research institutions such as Baylor College of Medicine, MD Anderson Hospital, University of Texas Health Science Center and Methodist Hospital. Bio/Life Science developments in the works include TMC3, owned by the Texas Medical Center; The Ion Project developed by Rice University; Hines and 2ML Real Estate; Levit Green; Innovation Tower, developed by Medistar Corp. and Innovation Plaza, developed by Texas A&M University. Even with these projects either existing or in the pipeline, demand is still anticipated to outstrip supply. State tax incentives and relatively affordable land is expected to create an influx of both foreign and domestic investors. In comparing rents for Houston with other bio/life science hubs, 40,000 square feet of lab space rents for the cost of 5,000 to 10,000 square feet in New York City or Boston. 4 Strategic Alliance Coverage | Year End Report | Second Half 2020 | Texas International Consultants,Incorporated | Stealth Realty Advisors,LLC BIO LIFE SCIENCE-REAL ESATE $52M $174M $179M $196M $218M $309M $316M $522M $548M $1,046M $1,133 M $1,345 M $4,701M $5,536M
  • 5. VACANCY CHARTS,RENTAL RATE AND GROWTH CHARTS,ACTIVE BUYERS MOB Fundamentals Steady Across Top 50 Metros Total SF Occupancy Rate TTM % SF Completed Past 4 Quarters Absorption SF Past 4 Quarters Rent NNN Average YOY Rent Growth SS % Cont. SF In Progress Const. SF In progress Vs Inventory (%) New York Chicago Houston Dallas Philadelphia Atlanta Boston Washington, DC Miami Los Angeles 72.7M 41.5M 41.5M 33.3M 29.3M 27.3M 26.3M 23.1M 20.1M 57.4M 93.6 91.4 88.3 89.1 92.2 90.0 93.6 90.0 90.5 91.6 1,732,988 560,911 372,956 498,294 406,000 266,500 620,700 456,954 370,534 489,115 1,656,760 815,968 122,500 581,403 326,567 434,933 604,305 691,867 627,842 178,024 $24.50 $19.76 $21.86 $21.76 $20.20 $20.08 $27.66 $25.08 $23.36 $34.41 1.6 1.4 1.5 1.4 1.5 2.3 1.5 2.2 2.5 1.7 2.3 4.2 3.3 3.4 1.6 6.1 2.5 5.2 5.9 2.0 1.6M 1.7M 1.4M 1.2M 0.5M 1.7M 0.7M 1.2M 1.2M 1.1M Q1 6.8 6.1 5.4 3.1 7.1 6.3 5.6 4.0 6.9 6.1 5.5 4.0 6.9 5.9 5.5 4.6 Q2 Q3 Q4 25th % 75th % Lowest Median MOB Cap rate yield by trends by quarter in 2020 5 Strategic Alliance Coverage | Year End Report | Second Half 2020 | Texas International Consultants,Incorporated | Stealth Realty Advisors,LLC Most Active Markets Annual Volume (Millions) Avg.$/SF SQ.FT TTM Avg.Cap Rate $10,219.2 $8,634.9 $7,023.2 $767.9 $358.1 $344.1 $328.3 $302.5 $300.2 $298.0 $287.6 $212.3 $209.6 $207.0 32.2 26.7 21.3 1.7 0.9 1.2 1.0 0.8 0.9 1.1 0.7 0.7 0.7 0.4 $344 $352 $357 $464 $333 $319 $357 $393 $305 $296 $405 $291 $389 $502 6.3 6.2 6.2 5.5 5.6 6.5 6.0 6.1 6.5 6.6 5.8 5.4 6.0 6.5 US Top 100 Top 50 Los Angeles Houston Miami Dallas New York Washington,DC Chicago Indianapolis Atlanta Phoenix San Diego Source: Revista Source: Revista Source; Revista AVERAGE CAP RATE VACANCY AVERAGE CAP RATE PRICE PER SQ. FT LEASE RATE
  • 6. Top Construction Market 630 M 12 M 21 M 16 M 14 M 11 M 10 M 14 M 16 M 14 M 14 M 44.3 M 1.7 M 1.7 M 1.6 M 1.4 M 1.2 M 1.2 M 1.2 M 1.2 M 1.2 M 1.1 M 3.1 M 4.2 M 6.1 M 2.3 M 3.3 M 6.2 M 5.2 M 6.5 M 5.9 M 3.4 M 2.0 M 20.7 M 0.6 M 0.3 M 1.7 M 0.4 M 0.2 M 0.5 M 0.3 M 0.4 M 0.5 M 0.5 M 20.9 M 0.5 M 1.0 M 0.8 M 0.9 M 0.7 M 0.2 M 0.3 M 0.6 M 0.2 M 0.8 M Properties in Progress SF in progress vs Inventory SF in Progress SF completed past 12 months SF started past 12 months US Chicago Atlanta New York Houston San Francisco Washington,DC Phoenix Miami Dallas Los Angeles Remedy Medical Properties,Inc INVESCO Montecito Medical Real Estate Healthcare Realty Trust (NYSE:HR) Anchor Health Properties IRA Capital Anchor Health Properties Harrison Street Realty Capital Healthpeak Properties Inc Global Medical REIT $1.51B $924 M $608 M $487 M $385 M $341 M $254 M $232 M $196 M $191 M 2020 Most Active Buyers Hospitals/Health System - 52% Investor Private - 24% REIT - 13% Provider Owner - 10% HOSPITALS/ HEALTH 52% PROVIDER/ OWNER -25% REIT -13% INVESTOR / PRIVATE 24% VACANCY CHARTS,RENTAL RATE AND GROWTH CHARTS, ACTIVE BUYERS 6 Strategic Alliance Coverage | Year End Report | Second Half 2020 | Texas International Consultants,Incorporated | Stealth Realty Advisors,LLC HOSPITAL SYSTEMS OWN MAJORITY OF MOB SECTOR Source: Revista
  • 7. 3.25% 0.12% 0.21% 0.59% 1.22% 0.46% 1.14% 1.91% Prime Rate 1 Month LIBOR 6 Month LIBOR 5 YR SWAP 10 YR SWAP 5 YR TR 10 YR TR 30 YR TR KEY STRATEGIC ALLIANCE MARKETS CAPITAL MARKETS / FINANCE STRUCTURED DEBT AND FINANCE MONEY RATES AS OF (2/10/2021) For more information contact Angela Kesselman, Managing Director, The Madison Group. angela@madsongroupfunding.com Source: Fin Facts from Bryan Shaffer, George Smith Partners. Bryan Shaffer, Managing Director,George Smith Partners bshaffer@gspartners.com *Data acquired from Revista, CoStar and National Reports 1. Baltimore is excluded 2. Atlanta has 20 MOB’s Under construction 3. Columbus, OH; New Orleans, LA; Las Vegas, NV & Knoxville, TN have no MOB's under construction Lending has remained brisk for the last 6 months of 2020, with low interest rates and cap rates working together to create a surge in transactions. CMBS lenders have returned to the market with low rates in the mid 3s on 30/10 paper, but they are more conservative on dollars. Most securitized deals transact at around a 65% loan to value or a minimum debt yield of 7-8%. Credit tenants are preferred on single tenant transactions. Medical office loans are being done with low spreads and up to full term interest only on non-recourse transactions. There is a big appetite for most medical type facilities in good locations. The most difficult to transact are NNN single tenant assets with non-credit tenants that require non-recourse financing, although there are a few lenders in the market that are willing to fund the right deal at 60-65% leverage. There is continued optimism with lenders in this sector of the business as the medical industry develops new operational procedures to stay open safely during Covid. 7 Strategic Alliance Coverage | Year End Report | Second Half 2020 | Texas International Consultants,Incorporated | Stealth Realty Advisors,LLC
  • 8. OUTLOOK 2021 With 2020 behind us, we are moving rapidly into 2021. Change in motion is the new normal. With these changes we have identified two areas of asset classes which have arisen from the Pandemic and present opportunistic acquisition possibilities. Both are addressed in this report and we are equipped and ready to work closely with investors to review these opportunities. They are Behavioral Health Treatment and Bio Life and Medical Science Facilities. In research for this medical office report we identified a few key markets of note. They are Austin, Charlotte, Denver and Tampa all exceeding the national average in YOY rental growth. None of the 4 markets were listed in the top ten for buyers but may warrant further examination for 2021, if investors can find the right product available. Austin has a YOY rental growth of 6.3% with a median rate of $25.00 PSF for lease and $293.00 PSF on sales. Austin reportedly has just 101,000 SF under construction expected to come online this year with a vacancy rate of 10.6%. Charlotte has a YOY growth rate of 2.7% with a median lease rate of $23.00 PSF and a sales average of $371.00. Charlotte has 734,500 SF scheduled for delivery this year with approximately a 9% vacancy rate. Denver has a YOY of 3.7%, a median lease rate of $22.00 PSF and a sales average of $300.00 PSF. Denver has just shy of 450,000 SF under construction with a vacancy rate of 9.6%. Tampa has a YOY rate of 3.6% with a median rate $20.50 PSF and a sales average of $355.00 PSF. Construction for Tampa is estimated at 349,044 SF with a vacancy rate of 8.3%. It should also be noted that there were 4 markets reporting no medical office building construction due to be completed in 2021. Those markets are Columbus, OH, 6.9% vacancy, Knoxville, TN, 9.1% vacancy, Las Vegas has a YOY growth rate of .087%, a lease rate of just over $19.00 and an average sales prices of $461.00. A vacancy rate of 10.3% is reported for Las Vegas. New Orleans, 7.1% vacancy. With the new configuration and need for specialty (amenity) space in new construction, investors will be looking for assets to acquire which can easily be adapted to conform to this concept. Ideal properties which may allow for ease of this are existing medical office with large open floor plates as well as retail properties which offer this along with a myriad of options for other amenities close by. There is always much discussion about CAP rates and where they will end up. We do not see any growth in CAP rates in the foreseeable future. As of this report, they continue to compress with an average for the US of 6.3%; however larger quality assets have yielded rates in the mid to low 5%. We expect this to remain the norm. Continuation of capital flowing in from the west coast due to sale of assets is being re-deployed to Colorado, Arizona, Utah, Texas and Florida. This will continue to put pressure on an already highly competitive market. This is especially true of 1031 funds chasing NNN single tenant leased medical office competing with well-known industry buyers. According to ReVista the characteristics of investor- owned medical office buildings are: 72% prefer off campus with 67% affiliated with a health system and 74% of them need to be within 2 miles of a hospital. Preference is for the assets to be north of 40,000 SF. With the strategic coverage and relationships garnered by our partners in key local markets we have a distinct advantage in uncovering quality “off-market” healthcare real estate assets. We continue to be focused on the service and delivery of these opportunities to our clients. 8 Strategic Alliance Coverage | Year End Report | First Half 2020 | Texas International Consultants,Incorporated | Stealth Realty Advisors,LLC
  • 9. 2003 1990- 2003 Centennial Anniversary! 1946- 1965 1965- 1990 2011 2012 1921- 1946 Disposition I Tenant Representation Capitol Markets I Acquisition Finance I Asset & Risk Management Business I Real Estate I Facilities 2019 2020 2021 Disposition I Tenant Representation Capitol Markets I Acquisition Finance I Asset & Risk Management Business I Real Estate I Facilities QUANTUM HOLDINGS, LLC 2B 2B Rosemary Homes, LLC Design, Renovation & Flipping 19 21 TIMELINE -100 YEARS 1911 A COSTAR COMPANY 9 Strategic Alliance Coverage | Year End Report | First Half 2020 | Texas International Consultants,Incorporated | Stealth Realty Advisors,LLC Forms Mendiola Properties. Continues to buy up land. Property management company officially formed and staffed to manage existing assets. Texas International Consultants, Incorporated is formed. Buys Small homes & comm bldgs. to rent. Pamela Mendiola starts to take larger role & ultimately takes over, changes direction of company and forms Mendiola Investments. Sells home building, design, construction, insurance & mortgage business. Invests in additional income properties Buys undervalued property & local service businesses, turns them around & sells for a profit. Incorporates Mendiola Investments & adds Daughter Helen to board. Joseph Mendiola returns from WWII & Starts building spec homes and buildings on Land a owned by by family. Pamela is actively involved in all of the business. Construction, design, mortgage & Insurance companies started. Small commercial properties constructed for clients. Custom homes are built in Houston, Friendswood, Pearland, LaPorte & Seabrook areas. Helen steps in as acting CEO during long illness of Pamela & continues to buy and manage income producing assets and subsidiary businesses while continuing her commercial real estate consulting practice with a special emphasis on healthcare real estate. In the Spring, Helen with her husband Jay, change the direction of Mendiola investments, Incorporated from a holding company and family office to a third party advisory and consulting business more representative of her career of over 3 decades of commercial & healthcare real estate. Stealth Realty Advisors, LLC is formed to handle the acquisition and disposition of property as well as a result of consulting assignments. Capital Markets is a service provided for re-monetization and capitalization of clients properties. The TICI Group of Companies is formed. Upon the passing of Pamela in late 2010, Helen officially takes over a President/CEO and sells off the side businesses and income producing assets in four cities in two states. Since the inception of taking over, Helen utilized over decades of key industry contacts to facilitate transactions on behalf of clients. Some of these relationships became Strategic Alliance Partners & Advisors to TICI and its clients. Helen becomes Chairman and CEO. Two other companies are brought back and renamed. There are h2B Quantum Holdings, LLC for personal investment and Rosemary Homes, LLC in honor of Pamela to purchase, renovate and resale properties. With the added Strategic Alliance relationships the TICI Group of Companies now has over 20 Partners and Advisors in 17 States and continues to grow. Because of all of this growth, Helen looked outside of the family to bring in an experienced Healthcare Real Estate professional to head up the newly formed Capital Markets - Healthcare. Jim Coman, officially joined TICI in the spring and established another Stealth Realty Advisors office in Charleston, SC. In addition to Texas and the 17 states we have partners, Jim is licensed in Texas, Georgia and North & South Carolina.
  • 10. 10 Strategic Alliance Coverage | Year End Report | First Half 2020 | Texas International Consultants,Incorporated | Stealth Realty Advisors,LLC SPECIALACKNOWLEDGEMENTS STRATEGIC ALLIANCE COVERAGE Jim Kelley Managing Principal, Champions DFW Commercial Realty Larry Walshaw National Director, Healthcare KW Commercial Realty Austin Earhart Senior Advisor Stirling Properties Craig Pelouze Senior Vice President Commonwealth Commercial Rick Egitto Senior Vice President Capital Markets Avison Young Jaimee Keene Vice President Avison Young Bryan Shaffer Managing Partner George Smith Partners Angela Kesselman Managing Director The Madison Group Dean Hutchinson Senior Analyst National Urgent Care Realty Mike Zelnik Principal National Urgent Care Realty Julie Johnson Executive Vice President Colliers International National Healthcare Group Benjamin Bivens Co-Founder/Principal MedSouth Healthcare Properties MedSouth Healthcare Management
  • 11. 19 21 Disposition I Tenant Representation Capitol Markets I Acquisition Finance I Asset & Risk Management Business I Real Estate I Facilities The Information contained herein has been obtained from sources deemed reliable. While every reasonable effort has been made to ensure its accuracy, we cannot guarantee it. No responsibility is assumed for any inaccuracy. This report may not be reproduced in part or in whole without the express written consent of The TICI Group of Companies. FOR MORE INFORMATION Helen Banks | Chairman (713) 705-1598 helenbanks@ticigroup.com Jim “JC”Coman Managing Director Capital Markets -Healthcare (843) 412-8714 jimcoman@ticigroup.com CLOSING REMARKS Helen Banks Chairman helenbanks@ticigroup.com H. Jay Banks Chief Risk Officer jaybanks@ticigroup.com James (Jim) Coman Managing Director Capital Markets - Healthcare jimcoman@ticigroup.com Sarah Finney Marketing & Research Director sarahfinney@ticigroup.com As I watched Tampa Bay Quarterback Tom Brady win his seventh Super Bowl, I knew I was watching history happen seeing him take one more step towards being the GOAT in football. His discipline, pride, work ethic and desire to continue to push barriers is one to envy. 2021 marks our families’ Centennial anniversary in the real estate business. Being the third generation to lead the company, now in the national eye, is no less daunting than leading a championship team. The team assembled within and that surround our organization is nothing short of championship material. Collectively moving forward, we will continue to have the discipline, pride, work ethic, tools, and talent to stay ahead of and even be a pioneer in our industry. Having over 20 partners who are the “healthcare real estate leaders” in 17 states and who represent a full complement of services allows us to fully engage our investors and put them first. We hope you will find some insights within this report which will be of use within your organization. Our team, being led by Jim Coman is close by to engage with you and your team to provide solutions for your healthcare real estate goals. Let us work together to push barriers and be champions!