
Recommended
More Related Content
What's hot
What's hot (17)
Viewers also liked
Viewers also liked (13)
Similar to Effect of Minimal Group Bias on Memory and Attitudes
Similar to Effect of Minimal Group Bias on Memory and Attitudes (20)
Effect of Minimal Group Bias on Memory and Attitudes
- 1. Running head: EFFECT OF MINIMAL GROUP BIAS ON MEMORY 1 The Effect of Minimal Group Bias on Memory and Attitude Over Time Grace Monks Cornell University
- 2. EFFECT OF MINIMAL GROUP BIAS ON MEMORY 2 Abstract The current experiment tested the hypothesis that adult participants’ membership in randomly assigned “minimal groups” would be sufficient to induce intergroup bias. Adults were randomly assigned to orange, green, or yellow groups and listened to stories about unfamiliar in-group and out-group adults. Participants were more likely to report negative events than positive events in free recall assessments, but were more accurate about positive events than negative events in recognition memory assessments. Despite support for the hypothesis from previous work, no significant in-group preferences were observed on explicit and implicit measures of attitude or memory of stories. Despite limitations, findings provide potential knowledge about the reliability of witness testimony and their susceptibility to ingroup-outgroup bias. Keywords: minimal groups, ingroup-outgroup bias, memory, attitude
- 3. EFFECT OF MINIMAL GROUP BIAS ON MEMORY 3 The Effect of Minimal Group Bias on Memory and Attitude Over Time Every day, individuals rely upon associations between themselves and others to make conscious and unconscious decisions. Individuals have a tendency to see themselves as either part of an ingroup or part of an outgroup. Ingroup associations can have a lasting effect on the way we perceive others. The social identities that we ascertain have the power to shape social cognition (Van Bavel & Cunningham, 2011). Ingroup associations play a powerful role in the memories we have about ingroup and outgroup members (Tajfel, Billig, Bundy, & Flament, 1971). Exactly how small association this needs to be is the question we seek to answer. Group Associations in the Context of Memory The group that we ascribe ourselves to can impact our memory for people and events. For example, many researchers have shown that people from various racial identities show better recognition memory for faces of their own race than faces of another race (Malpass & Kravitz, 1969). The field of social psychology has deemed this phenomenon own-race bias (Malpass & Kravitz, 1969). Similarly, people tend to report other-race faces as looking alike but seeing same-race faces as individuals (Malpass & Kravitz, 1969; Meissner & Brigham, 2011). This is called the out-group homogeneity effect - the tendency for people to see ingroups as heterogeneous and outgroups as homogeneous. The potential consequences of this phenomenon are concerning, such as wrongful convictions based on eyewitness testimony (Brigham & Ready, 1985). Social Categorization as a Cause of Ingroup Bias In the past few decades there has been a push towards discovering the cause of ingroup-outgroup bias. Researchers have investigated social categorization as an
- 4. EFFECT OF MINIMAL GROUP BIAS ON MEMORY 4 explanation of both racial and minimal group biases (Hugenberg & Sacco, 2008; Levin, 1996; Sporer, 2001). The theory is that when an individual encodes a face, he immediately categorizes the individual as an ingroup member or an outgroup member. The faces of ingroup members spark a deeper and different type of processing compared to those of outgroup members. Ingroup members are viewed more as individual entities, while outgroup members are viewed as part of a social category (Sporer, 2001). Despite the arbitrary nature of the social categories, this categorizing process is enough for individuals to create an ingroup bias in face memory (Bernstein, Young, & Hugenberg, 2007). Van Bavel, Swencionis, O’Connor, and Cunningham (2011) further added to this social categorization theory. In one study, the researchers examined social identity and its impact on memory and social attention. Participants that tended to identify most highly with their ingroup had the largest degree of outgroup bias (Van Bavel, Packer, & Cunningham, 2011). In a further investigation of this phenomenon, the researchers showed that social belonging needs were a strong force behind ingroup-outgroup biases. Specifically, participants who indicated a higher need to belong showed greater ingroup bias in the memory tasks and participants that were more socially excluded also showed greater ingroup bias in the memory tasks (Van Bavel et al., 2011). Hartstone & Augoustinos (1995) depart from simple social categorization theory. These researchers suggest that the minimal group effect relies on dichotomous categorization, or the use of two minimal groups. They discovered that adults display ingroup bias with two minimal groups but do not display the bias in a three-group context (Hartstone & Augoustinos, 1995). Spielman (2000) supported this; he duplicated the two-
- 5. EFFECT OF MINIMAL GROUP BIAS ON MEMORY 5 group versus three-group results but also found that adults will show ingroup bias in a three-group context when competitively primed (Spielman, 2000). Both studies support the theory that the competitive nature of dichotomous categorization leads to ingroup bias in minimal groups. Minimal Groups Researchers have shown that this ingroup bias occurs across many different groups. Dating back to the 1970s, Tajfel and other researchers investigated the minimum requirements necessary to lead to ingroup discrimination. This group of researchers created what is now known as the minimal group paradigm: They attempted to create a situation so free of psychological meaning that ingroup bias would be prevented. What they found was that despite an arbitrary distinction, ingroup bias still persisted. For instance, in a resource allocation experiment participants were more likely to favor those in their ingroup even though it was based on completely arbitrary distinctions (Tajfel, Billig, Bundy, & Flament, 1971). Minimal groups share a much less significant relationship than race and are often created using something as insignificant as a color of shirt or a team name, both randomly assigned and with pre-experimental associations. The results of many studies suggest that newly learned and arbitrary group associations can still lead to the memory-altering bias seen with racial groups (Bernstein, Young, & Hugenberg, 2007; Van Bavel, Packer, & Cunningham, 2008). Superior recognition memory is seen in ingroups despite the groups being arbitrary and recent (Bernstein, Young, & Hugenberg, 2007). No stereotype- inducing measures, prior conflict, or competition for resources is needed to induce the ingroup-outgroup differentiation (Tajfel, 1970).
- 6. EFFECT OF MINIMAL GROUP BIAS ON MEMORY 6 The effects of experimentally created minimal groups can even be so powerful as to override other factors. In one study where the minimal group paradigm was induced, participants tended to show more ingroup bias toward the minimal group, regardless of the race of its members. Many researchers believe that these differences in memory for ingroup and outgroup members are caused by the way in which those individuals and the actions associated with them are originally encoded (Van Bavel & Cunningham, 2011). The precise differences in how they are encoded require further investigation. Furthermore, in a study conducted by Otten and Moskowitz (2000), participants demonstrated positive affect toward novel, randomly-assigned ingroup members; the results demonstrated that participants were more likely to categorize an ingroup member with a positive trait than a negative trait (Otten & Moskowitz, 2000). Additionally, participants were more likely to assign these positive traits to ingroup members than to outgroup members. The researchers did not examine this effect on memory or other assessments (Otten & Moskowitz, 2000). Assignment in the Minimal Group Paradigm Researchers have created experimentally created minimal groups in a variety of ways. Often, participants are told that they belong to a certain group or team. For example, Spielman (2000) utilized circle, square, and triangle tokens to assign participants to the circle, square, or triangle groups. In another study, Dunham, Baron, and Carey (2011) gave participants colored tokens and matching colored t-shirts to create minimal groups. In this study, the researchers examined explicit attitudes, resource allocation, behavioral attribution, implicit attitudes, and expectations of reciprocity, but they did not examine memory-related assessments. The study was conducted with
- 7. EFFECT OF MINIMAL GROUP BIAS ON MEMORY 7 children and the results demonstrated that ingroup biases affected all measures, including explicit attitudes, resource allocation, behavioral attribution, implicit attitudes, and expectation of reciprocity (Dunham, Baron, and Carey, 2011). The Current Study One notable gap in the literature has to do with the manner in which ingroup- outgroup status affects behavioral predictions. No known study to date has examined how minimal group associations affect behavioral inferences over time. The current study seeks to close this gap. This information could shed light on the behavioral attributions individuals make in the face of little external information. Behavioral inferences, in addition to memory, were measured at two time points to examine how these measures change over time. The current study utilized the same paradigm as Dunham, Baron, and Carey (2011) but examined the impact of minimal group membership on memory, explicit liking, and behavioral attributions across time in undergraduate students. The aim of the study was to explore the minimal group paradigm with undergraduates not only in the context of memory, but in trait and behavioral predictions as well. It was hypothesized that ingroup biases stemming from minimal group associations would lead participants to recall their ingroup members more positively and outgroup members more negatively. Specifically, it was posited that participants would more accurately recall positive ingroup actions than positive outgroup actions and would more accurately recall negative outgroup actions than negative ingroup actions. Additionally, it was hypothesized that participants would evaluate ingroup members more favorably during explicit liking and behavioral attribution assessments.
- 8. EFFECT OF MINIMAL GROUP BIAS ON MEMORY 8 Methods Participants The participants in this study consisted of 56 adults (69.6% female). Undergraduate students were recruited through the Cornell University psychology experiment online sign-up system. Participants from the community were also recruited through email. Adults ranged from 18-37 years of age (M = 19.92, SD = 2.63). The racial makeup consisted of 42.9% Caucasian, 28.6% Asian, 16.1% Hispanic, and 12.5% African American. All participants had at least some college. Three participants were excluded from the analysis after they mentioned they had previous knowledge of the stimuli presented. Cornell undergraduates received extra credit for their participation while participants from the community were entered into a raffle to win a gift card. Design The current study examined the impact of ingroup-outgroup membership on memory, explicit liking, and behavioral attribution. Ingroup-outgroup membership was manipulated through the use of t-shirt color. Participants were randomly assigned to one of three t-shirt colors: orange, green, and yellow. The orange and green groups served to elicit ingroup-outgroup membership while the yellow group served as a control. The dependent variables included memory for people and events and trait assessments. These dependent variables were measured immediately (time 1) and one week after (time 2) the stimuli was presented. Stimuli All stimuli and time 1 questionnaires were presented in person. With the assistance of a research assistant, all content was presented on a laptop computer via
- 9. EFFECT OF MINIMAL GROUP BIAS ON MEMORY 9 Qualtrics, an online survey tool. Stimuli consisted of 16 still frames of eight adult volunteers (50% female) (see Appendix A). These adult volunteers ranged from 19-22 years of age (M = 20.25, SD = .89). Each volunteer was photographed twice - once in an orange t-shirt and once in a green t-shirt. The volunteers had hair pulled back and wore no makeup. Each participant viewed eight still frames (two females in orange t-shirts, two females in green t-shirts, two males in orange t-shirts, and two males in green t- shirts). Color and volunteer were counterbalanced so that for each volunteer, 50% of participants saw that person in an orange t-shirt, and 50% of volunteers saw that person in a green t-shirt. As each still frame appeared on Qualtrics survey tool, a research assistant read one good story or one bad story about the individual shown. Good stories included positive actions such as sharing food with coworkers, picking up trash in a park, donating clothes, and picking up dropped papers. Bad stories included negative actions such as tripping another person, stealing a computer, breaking into a professor’s office, and throwing water in a coworker’s face. There were a total of eight stories between 33 and 48 words (Appendix B). Stories and still frames were counterbalanced to create four surveys. Measures Memory assessments. The memory assessment consisted of two parts. The first part involved a free recall task. The research assistant asked open-ended questions such as, “Tell me everything you can remember about the stories you just heard.” As the participant responded, the research assistant recorded the information. The second part consisted of eight multiple-choice questions. Participants were presented with one still frame at a time and asked, “Which action did this person commit?” The answer options
- 10. EFFECT OF MINIMAL GROUP BIAS ON MEMORY 10 consisted of all eight actions described in the stories (e.g., “This person stole a computer”, “This person shared food with others”). The research assistant inputted all responses into the survey tool (see Appendix C). Liking assessments. The trait assessment consisted of two parts. The first part- the explicit liking assessment- involved a series of eight questions. Here, participants were presented with a still frame of a novel individual wearing either an orange or a green t-shirt (Appendix D). The new still frames were adult volunteers (50% female). These adult volunteers ranged from 19-20 years of age (M = 19.88, SD = .35). The new still frames were photographed in the same manner as the previous eight stimuli still frames. As the still frame was presented, participants were asked. “How much do you like this person?” and indicated liking on a 4-point Likert scale. The 4 options included “1-dislike very much”, “2-dislike moderately”, “3-like moderately”, and “4-like very much” (see Appendix E). The second part- the behavioral attribution assessment- involved eight more questions. Participants were presented with still frames from the second volunteer group described above and asked, “Please pick one adjective that describes this person.” Answer choices included “friendly”, “nice”, “smart”, “considerate”, “mean”, “selfish”, “unfriendly”, and “rude” (see Appendix F). Procedure Group assignment. Participants performed the experimental tasks individually. Participants were instructed to pick a token out of a bag that was said to include green, orange, and yellow tokens. However, unbeknownst to them, three different bags existed with entirely green, orange, or yellow tokens. Thus, participants were pre-assigned to a t-
- 11. EFFECT OF MINIMAL GROUP BIAS ON MEMORY 11 shirt color and pulled a token out of the corresponding bag filled with that color. After pulling a token, participants were given a t-shirt of the same color and instructed to wear the t-shirt for the duration of the experiment. Twenty-one participants were in the orange group, 19 participants were in the green group, and 16 participants were in the yellow group. Time 1. Color assignment occurred at time 1. After putting on the t-shirt, participants were told that they would hear a series of stories and were instructed to look at the accompanying photos. As the research assistant read the story for each action, he/she presented the associated photo of the person alleged to have performed it. The photo presented along with each story was randomized to account for latency and recency effects as well as individual differences among the photos. After the stimuli were presented, participants entered a unique participant identification number into Qualtrics. This identification number was used to connect participants’ Time 1 and Time 2 survey results. Next, participants were asked to answer some questions about what they saw and heard. The first task completed was the memory assessment. Participants first were asked to tell the research assistant everything they remembered from the stories. They were then asked to recall anything positive the people mentioned did and anything bad the people mentioned did. Next, the participants were asked the eight specific questions, “What action did this person commit?” After the memory assessment was completed, participants completed the trait assessment. Participants first answered the eight Likert scale questions and then answered the eight adjective questions instructing them to, “Please pick one adjective that describes this person.” After the trait assessment, the research assistant thanked the participants and
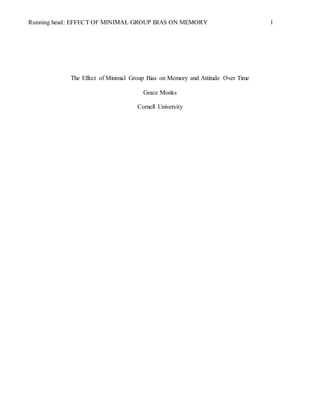
- 12. EFFECT OF MINIMAL GROUP BIAS ON MEMORY 12 told them they would receive a survey consisting of the second part of the study via email in one week. Time 2. Participants received a survey one week later via email. The survey consisted of the same memory assessment and trait assessment utilized in Time 1. Participants completed the recognition memory assessment first, followed by the explicit liking assessment, and finally the behavioral attribution assessment. After all assessments, participants were debriefed. Results Free-Recall Memory The mean number of positive events recalled was compared with the mean number of negative events recalled through a dependent t-test. The analysis revealed a tendency to remember more negative actions (M = 2.91, SD = .78) than positive actions (M = 2.55, SD = .86, p < .001). Mean free-recall memory rates for positive and negative actions are presented in Figure 1. Figure 1. Free recall as a function of action valence (positive and negative) expressed as
- 13. EFFECT OF MINIMAL GROUP BIAS ON MEMORY 13 the mean number of actions recalled (of four total actions for each valence). Recognition Memory Accuracy for actions was analyzed using a repeated measures analysis of variance with three within-participant factors (Time: Time 1 vs. Time 2 x Group: Ingroup vs. Outgroup x Valence: Positive vs. Negative actions). This analysis revealed a tendency to recall more accurate actions at time 1 compared to time 2 (p < .001). There was also a slight tendency to recall more accurate ingroup actions than outgroup actions (p = .32). Furthermore, there was a slight tendency to recall more accurate positive outgroup (M = 1.47, SD = .65) than positive ingroup actions (M = 1.36, SD = .76) at time 1. At time 2, this trend reversed: Participants recalled more accurate positive ingroup actions (M = .78, SD = .59) than positive outgroup actions (M = .64, SD = .64). These tendencies are displayed in Figure 2. Figure 2. Recognition memory for positive actions as a function of time (time 1 and time 1) and group (ingroup and outgroup) expressed as the mean number of actions accurately recalled (for a total of four actions). Lastly, as displayed in Figure 3, there was a slight tendency for participants to recall more accurate negative ingroup actions (M = 1.31, SD = .71) than negative outgroup
- 14. EFFECT OF MINIMAL GROUP BIAS ON MEMORY 14 actions (M = 1.19, SD = .71) at time 1. The same tendency occurred at time 2 (ingroup: M = .83, SD = .77; outgroup: M = .61, SD = .69). The mean accuracy rates across time, valence, and group are presented in Table 1. There was no three-way interaction of time (time 1 and time 2), group (ingroup and outgroup), and valence (positive and negative). Figure 3. Recognition memory for negative actions as a function of time (time 1 and time 1) and group (ingroup and outgroup) expressed as the mean number of actions accurately recalled (for a total of four actions). Table 1. Mean accuracy rates across time, valence, and group in the recognition memory assessment. Time 1 Time 2 Positive Negative Positive Negative Ingroup 1.36 1.31 .78 .83 Outgroup 1.47 1.19 .64 .61 The mean number of accurately remembered positive actions was compared with accurately remembered negative actions, including both ingroup and outgroup at time 1. This analysis revealed a tendency to more accurately remember positive actions (M = 2.66, SD = 1.12) than negative actions (M = 2.43, SD = 1.14; p = .07). Mean memory rates are presented in Figure 4.
- 15. EFFECT OF MINIMAL GROUP BIAS ON MEMORY 15 Figure 4. Recognition memory as a function of valence (positive or negative) expressed as the mean number of actions accurately recalled (for a total of four actions for each valence). Explicit Liking Mean ingroup and outgroup liking scores were analyzed using a repeated measures analysis of variance with two within-participant factors (Time: time 1 vs. time 2 x Group: ingroup and outgroup). This analysis revealed a very slight preference for ingroup members (M = 2.74, SD = .41) as compared to outgroup members (M= 2.70, SD = .48) at time 1. The same trend was also seen at time 2 (ingroup: M = 2.71, SD = .46; outgroup: M= 2.69, SD = .36). However, there was no significant effect of group on ingroup or outgroup score (p =.76). An index of group preference (mean ingroup score – mean outgroup score) was calculated for both time 1 and time 2 (time 1: .04; time 2: .02). There were no significant interactions, but the tendency for ingroup preference is displayed in Figure 5.
- 16. EFFECT OF MINIMAL GROUP BIAS ON MEMORY 16 Figure 5. Explicit liking as a function of time (time 1 and time 1) and group (ingroup and outgroup) expressed as the mean score for ingroup or outgroup members (for a highest score of 4 for either group). Behavioral Attribution Adjective assignment was analyzed using a repeated measures analysis of variance with three within-participant factors (Time: time 1 vs. time 2 x Group: ingroup vs. outgroup x Valence: positive actions vs. negative adjectives). This analysis revealed a tendency to assign more positive adjectives than negative adjectives overall (p < .001). There was also an effect of time by valence (p < .05). Furthermore, there was a slight tendency for participants to assign more positive adjectives to their outgroup than ingroup at time 1(ingroup: M = 2.61, SD = 1.02; outgroup: M = 2.89, SD = 1.14). At time 2, this trend reversed- participants assigned more positive adjectives to their ingroup than outgroup (ingroup: M = 2.42, SD = 1.18; outgroup: M = 2.28, SD = 1.23). These tendencies are displayed in Figure 6.
- 17. EFFECT OF MINIMAL GROUP BIAS ON MEMORY 17 Figure 6. Behavioral attribution for positive adjective assignment as a function of time (time 1 and time 1) and group (ingroup and outgroup) expressed as the mean number of positive adjectives assigned to ingroup or outgroup members (for a maximum of 4 adjectives for either group). Lastly, there was a slight tendency for participants to assign more negative adjectives to their ingroup than outgroup at time 1 (ingroup: M = 1.39, SD = 1.02; outgroup: M = 1.11, SD = 1.14). At time 2, this trend reversed- participants assigned more negative adjectives to their outgroup than ingroup (ingroup: M =1.58, SD = 1.18; outgroup: M = 1.72, SD = 1.23) These tendencies are displayed in Figure 7. The mean number of adjectives assigned across time, valence, and group are presented in Table 2. There were no effects as a three-way interaction of time (time 1 and time 2), group (ingroup and outgroup), and valence (positive and negative). Table 2. Mean number of adjectives assigned across time, valence, and group in the behavioral attribution assessment. Time 1 Time 2 Positive Negative Positive Negative Ingroup 2.61 1.39 2.42 1.58 Outgroup 2.89 1.11 2.28 1.23
- 18. EFFECT OF MINIMAL GROUP BIAS ON MEMORY 18 Figure 7. Behavioral attribution for negative adjective assignment as a function of time (time 1 and time 1) and group (ingroup and outgroup) expressed as the mean number of negative adjectives assigned to ingroup or outgroup members (for a maximum of 4 adjectives for either group). Discussion The purpose of the current study was to examine the effect of ingroup bias on memory and attitude across time. It was predicted that participants would more accurately remember positive ingroup actions than positive outgroup actions. It was also hypothesized that participants would more accurately remember negative outgroup actions than negative ingroup actions. Finally, we also expected participants to more accurately remember ingroup actions than outgroup actions. In the current experiment, individuals were more likely to recall negative events than positive events in a free-recall setting. This finding is supported by previous research by Dunham, Baron, and Carey (2011). However, due to the nature of the free recall assessment, the vast majority of participants did not state which person completed which actions. Therefore, this assessment provides us with little information regarding ingroup bias and how it affects memory.
- 19. EFFECT OF MINIMAL GROUP BIAS ON MEMORY 19 While in the free-recall experiment participants were more likely to recall negative events, the same was not the case with accuracy. In the recognition memory assessment, participants were more accurate about positive events than negative events. In other words, memory was better for remembering who completed positive actions than for who completed negative actions. These two findings together raise an interesting point; it seems that while individuals might remember negative actions better than positive actions, they might be more accurate about the person committing the positive actions. When considering ingroup bias specifically, the current study did not yield any significant findings. There were, however, some notable trends among the memory and attitude assessments. Participants were more accurate about actions committed by their ingroup than actions committed by their outgroup. This finding provides support for social categorization as a cause for ingroup bias. It may be possible that even in arbitrary minimal groups, the faces of ingroup members lead to a different type of processing than with those of outgroup members. To examine how exactly this process occurs requires more investigation (Sporer, 2001). In terms of ingroup preference, an unexpected trend was discovered. Previous research utilizing the minimal group paradigm has found an ingroup preference in memory. For example, Dunham and colleagues (2011) found a tendency to remember more positive ingroup events than positive outgroup events. In the current study, however, the opposite trend was found at time 1. Although not statistically significant, participants were more accurate with positive outgroup actions than with positive ingroup
- 20. EFFECT OF MINIMAL GROUP BIAS ON MEMORY 20 actions. This trend reversed at time 2 to support ingroup preference- participants were more accurate with positive ingroup actions than positive outgroup actions. The trend reversal found in the recognition memory assessment was also discovered in the behavioral attribution assessment. Despite findings of ingroup preference in a study conducted by Otten and Moskowitz (2000), an ingroup preference in behavioral attribution was also not found at time 1. Although not significant, there was a trend of participants assigning more positive adjectives to their outgroup than to their ingroup at time 1. Additionally, participants trended toward being more likely to assign negative adjectives to their ingroup than their outgroup at time 1. However, as with recognition memory, both of these unexpected trends reversed in time 2 to show ingroup preference. At time 2, participants were slightly more likely to assign positive adjectives to their ingroup than to their outgroup and were also more likely to assign negative adjectives to their outgroup than ingroup. However, there was not a significant difference. In the behavioral attribution assessment, participants were more likely to assign positive adjectives than negative adjectives overall. A similar finding was discovered in the explicit liking assessment; participants assigned almost equal scores to their ingroup and outgroup. It appears that the majority of participants had fairly positive feelings to both groups in both explicit liking and implicit liking as measured by behavioral attributions. It is possible that more severe actions may lead to different results. There is also potential for a lack of ingroup preference in adults in terms of liking assessments. Limitations
- 21. EFFECT OF MINIMAL GROUP BIAS ON MEMORY 21 Despite several interesting findings and notable trends, the current study contained several limitations. The largest drawback of the experiment was the low sample size. A larger sample size would afford more statistical power. It is possible that with more power, we may have seen more significant findings (i.e., the trends observed here could have been significant). In addition to size, the makeup of the sample is also a limitation as the majority of participants were college-educated Caucasian females. On a similar note, because the experiment was completed on a university campus, it is possible that there were some participants that may have seen the volunteer stimuli before. Although participants that mentioned that they knew one or more of the stimuli were excluded, it is possible that some participants may have known the stimuli before the experiment. Finally, as the stimuli are stories read by a research assistant accompanied by photographs, there is a lower level of ecological validity than with experiments using videotaped actions or actions witnessed live. Similarly, in an eyewitness case, an individual would potentially witness one action for a longer period of time rather than multiple actions for a shorter period of time, as was the case in the current study. Implications The current study adds to the existing knowledge regarding ingroup bias and the minimal group paradigm. As the findings regarding ingroup preference were not significant, it could be possible that the previously seen ingroup preference in children is not present or as strong in adults. A large portion of the minimal group paradigm has examined how ingroup bias affects explicit liking, behavioral attribution, and resource allocation, little research has examined its effect on memory over time (Dunham, Baron,
- 22. EFFECT OF MINIMAL GROUP BIAS ON MEMORY 22 & Carey, 2011; Spielman, 2000). However, as previously mentioned, these findings might be significant with a larger sample size. In that case, it is notable that the trend of ingroup preference remained at time 2. The reversals of trends seen in the recognition memory assessment and behavioral attribution assessment are also notable. In those cases, an unexpected outgroup preference was discovered at time 1, while a hypothesized ingroup preference was discovered at time 2. This interesting finding could be due to a defensive mechanism occurring at time 1. It is possible that after hearing stories of their ingroup performing negative actions, participants became defensive of their association to this group and viewed their ingroup less favorably. However, this theory needs a great deal more of investigation and should be studied more intently in future research. Future Research In addition to further investigation into a possible defensive mechanism in ingroup-outgroup studies, future research should continue examining the minimal group paradigm and ingroup bias as a whole. As previously mentioned, ecological validity would be greater with the use of a video or witnessing the actions live. Witnessing one action for a longer time could also increase ecological validity, which in turn would or would not support the use of eyewitness testimony in court. Therefore, future research should examine if the same trends occur with these changes. Additionally, future research should examine whether ingroup preference occurs in the case of more severe actions. In cases with eyewitnesses, the crimes could be as severe as rape or murder, which are more emotionally salient than the negative actions
- 23. EFFECT OF MINIMAL GROUP BIAS ON MEMORY 23 used in the current experiment. It is possible that memory could be more or less accurate as the severity of the actions is higher or lower. Finally, future research should examine the area of ingroup bias as a whole. Understanding how reliable or unreliable eyewitness testimony can be continues to be a pressing issue in the legal system. As admissible eyewitness testimony can serve as the foundation of a case, knowing its potential reliability and credibility is of the utmost significance. How much weight should be given to this testimony is a question that still plagues the legal system; more research in this area could help to answer this question.
- 24. EFFECT OF MINIMAL GROUP BIAS ON MEMORY 24 References Bernstein, M., Young, S., & Hugenberg, K. (2007). The cross-category effect: Mere social categorization is sufficient to elicit an own-group bias in face recognition. Psychological Science, 18, 709–712. Brigham, J., & Ready, D. (1985). Own-race bias in lineup construction. Law and Human Behavior, 9, 415–424. Dunham, Y., Baron, A.S., & Carey, S. (2011). Consequences of “minimal” group affiliations in children. Child Development, 82, 793-811. Hartstone, M., & Augoustinos, M. (1995). The minimal group paradigm: Categorization into two versus three groups. European Journal of Social Psychology, 25, 179- 193. Hugenberg, K., & Sacco, D. F. (2008). Social categorization and stereotyping: How social categorization biases face perception and face memory. Social and Personality Psychology Compass, 2, 1052-1072. Levin, D. T. (1996). Classifying faces by race: The structure of face categories. Journal of Experimental Psychology: Learning, Memory, and Cognition, 22, 1364–1382. Malpass, R. S., & Kravitz, J. (1969). Recognition for faces of own and other “race.” Journal of Personality and Social Psychology, 13, 330–334. Meissner, C. A., & Brigham, J. C. (2001). Thirty years of investigating the own-race bias in memory for faces: A meta-analytic review. Psychology, Public Policy, and Law, 7, 3–35. Otten, S. & Moskowitz, G.B. (2000). Evidence for implicit evaluative in-group bias: Affect-biased spontaneous trait inference in a minimal group paradigm. Journal
- 25. EFFECT OF MINIMAL GROUP BIAS ON MEMORY 25 of Experimental Social Psychology, 36, 77-89. Spielman, D.A. (2000). Young children, minimal groups, and dichotomous categorization. Personality and Social Psychology Bulletin, 26, 1433-1441. Sporer, S. L. (2001). Recognizing faces of other ethnic groups: An integration of theories. Psychology, Public Policy, and Law, 7, 36-97. Tajfel, H. (1970). Experiments in intergroup discrimination. Scientific American, 223, 96–102. Tajfel, H., Billig, M., Bundy, R., & Flament, C. (1971). Social categorization and intergroup behaviour. European Journal of Social Psychology, 1, 149–178. Van Bavel, J. J., Swencionis, J. K., O’Connor, R. C., & Cunningham, W. A. (2012). Motivated social memory: Belonging needs moderate the own-group bias in face recognition. Journal of Experimental Social Psychology, 48, 707-713. Van Bavel, J. J., Packer, D. J., & Cunningham, W. A. (2011). Modulation of the Fusiform Face Area following minimal exposure to motivationally relevant faces: Evidence of in-group enhancement (not out-group disregard). Journal of Cognitive Neuroscience, 23, 3343–3354.
- 26. EFFECT OF MINIMAL GROUP BIAS ON MEMORY 26 Appendix A Photo headshots presented in stimuli:
- 27. EFFECT OF MINIMAL GROUP BIAS ON MEMORY 27 Appendix B Stories presented as stimuli: 1. Jessica was unhappy that her computer was broken. Jessica was working in the library and saw the person working next to her leave the library and a computer behind to take a phone call. Jessica decided she would take the computer for her own. 2. Sara was walking to class and overheard a classmate talking about how easy an exam was. Sara did poorly on the exam and this upset her to hear. As the classmate was walking by, Sara stuck out her foot and tripped the classmate. 3. Emily had a meeting in the afternoon. Emily had made food and decided to make extra. Emily brought the food to the afternoon meeting to share with the rest of the people there. 4. Laura was walking through the park on her way home. Laura noticed that a group of people left a large amount trash behind after a picnic. Laura stopped walking, picked up all of the trash left behind, and threw it away in a nearby garbage can. 5. Michael was walking through Collegetown after a long day of classes. Michael saw someone on College Avenue drop a pile of papers on the sidewalk. Michael went over to the person and helped pick up all of the dropped papers, even though Michael just wanted to get home. 6. Chris realized that he had a lot of clothes in the closet that he did not wear often. Chris remembered that there was a clothing drive going on at the school in town. Chris took a box of clothes and brought them to the school to be donated. 7. Josh realized that he had made a huge mistake on his midterm. Josh knew that the midterms were kept in the professor’s office after 5pm. Josh picked the lock to the professor’s office to break in and changed his midterm. 8. Tyler and his coworker always disagreed. One day at work, Tyler and the coworker got into a big fight. The coworker made an offhanded comment. Tyler became very angry and threw water in the coworker’s face.
- 28. EFFECT OF MINIMAL GROUP BIAS ON MEMORY 28 Appendix C Memory recognition assessment sample question: Appendix D
- 29. EFFECT OF MINIMAL GROUP BIAS ON MEMORY 29 Headshots presented in the explicit liking assessment and the behavioral attribution assessment:
- 30. EFFECT OF MINIMAL GROUP BIAS ON MEMORY 30 Appendix E Explicit liking assessment sample question:
- 31. EFFECT OF MINIMAL GROUP BIAS ON MEMORY 31 Appendix F Behavioral attribution assessment sample question: