SlideShare a Scribd company logo
1 of 4
Download to read offline
National Media Release
Media enquiries contact:
Mitch Koper, CoreLogic National Communications Manager –1300 472 767 or media@corelogic.com.au
Media enquiries contact:
Mitch Koper, CoreLogic National Communications Manager –1300 472 767 or media@corelogic.com.au
Annual change in dwelling values
Highlights over the three months to December 2017
▶ Best performing capital city: Hobart +3.1%
▶ Weakest performing capital city: Darwin -2.9%
▶ Highest rental yield: Darwin 5.9%
▶ Lowest rental yields: Melbourne 2.9%
Index results as at December 31, 2017The transition towards weaker housing market conditions has
been clear but gradual and is likely to continue throughout
2018 according to CoreLogic head of research Tim Lawless.
Commenting on the results, Mr Lawless said, “From a macro
perspective, late 2016 marked a peak in the pace of capital
gains across Australia with national dwelling values rising at
the rolling quarterly pace of 3.7% over the three months to
November.”
“In 2017 we saw growth rates and transactional activity
gradually lose steam, with national month-on-month capital
gains slowing to 0% in October and November before turning
negative in December.”
According to CoreLogic, the 0.3% fall in December was the
catalyst for dragging the quarterly capital gains result into
negative territory for the first time since the three months
ending April 2016. Nationally, dwelling values were 4.2%
higher over the 2017 calendar year which is a slower pace of
growth relative to 2016 when national dwelling values rose
5.8% and in 2015 when values nationally were 9.2% higher.
Across Australia, Mr Lawless confirmed that the shift to falling
national dwelling values is being driven by the capital cities,
with the combined capitals tracking half a percent lower over
the December quarter, while across the combined regional
areas of Australia, values were half a percent higher over the
quarter.
Amongst the capitals, the weakest conditions are
concentrated in Sydney and Darwin.
Mr Lawless said, “Sydney’s housing market has become the
most significant drag on the headline growth figures.”
Sydney dwelling values were down 0.9% over the month to be
2.1% lower over the December quarter and 2.2% lower relative
to their August 2017 peak. The city’s annual rate of growth is
now tracking at just 3.1%; a stark difference to the recent
cyclical peak when values were rising at the annual rate of
17.1% only seven months ago. Despite the reversal in growth
rates since August 2017, Sydney dwelling values remain
70.8% higher than their cyclical low point in February 2012.
For Darwin, Mr Lawless believes the housing downturn is
entrenched, with values trending lower since May 2014. The
calendar year saw Darwin values down 6.5%. Since the 2014
peak, Darwin housing values have fallen by a cumulative
21.5%. While conditions for capital gains have been
exceptionally weak across Darwin, rental prices are down by
only 1.5% over the year. The substantial fall in values relative
to rents has pushed Darwin rental yields to their highest level
since July 2015 (5.9%) and Darwin rental yields are the
highest of any capital city.
National dwelling values fall 0.3% in December, setting the scene
for softer housing conditions in 2018
According to the CoreLogic December Hedonic Home Value Index results, national dwelling values slipped lower over
the month, led by falls across Sydney, Darwin, Melbourne and Perth
CoreLogic Hedonic Home Value Index, December 2017 Results
Released: Tuesday January 2, 2018 | www.corelogic.com.au/news
Month Quarter Annual
Sydney -0.9% -2.1% 3.1% 6.3% $895,342
Melbourne -0.2% 0.9% 8.9% 12.1% $720,417
Brisbane 0.0% 0.3% 2.4% 6.5% $491,391
Adelaide 0.2% 0.3% 3.0% 7.4% $432,772
Perth -0.1% 0.1% -2.3% 1.6% $463,886
Hobart 1.5% 3.1% 12.3% 17.8% $403,800
Darwin -0.9% -2.9% -6.5% -1.3% $424,901
Canberra 0.2% 1.0% 4.9% 9.6% $591,011
Combined capitals -0.4% -0.5% 4.3% 7.8% $656,161
Combined regional 0.2% 0.5% 3.8% 9.2% $355,994
National -0.3% -0.3% 4.2% 8.1% $548,817
Total
return
Median
value
Change in dwelling values
National Media Release
Media enquiries contact:
Mitch Koper, CoreLogic National Communications Manager –1300 472 767 or media@corelogic.com.au
Media enquiries contact:
Mitch Koper, CoreLogic National Communications Manager –1300 472 767 or media@corelogic.com.au
Melbourne, also posted a negative month-on-month change
with dwelling values slipping 0.2% lower in December; the first
monthly fall recorded since February 2016. Mr Lawless said,
“The city’s housing market has been far more resilient to
negative growth compared with Sydney due to factors such as
stronger population growth, lower affordability hurdles and a
higher rate of jobs growth, however the growth trend has been
clearly moderating since late 2016 and Melbourne’s annual
rate of capital gain, at 8.9%, has fallen below double digits for
the first time in eleven months.”
For Brisbane the housing market continued along a steady
growth trajectory with dwelling values unchanged in December
and only 0.3% higher over the December quarter. Annual
capital gains are only slightly higher than inflation, tracking at
2.4% over the calendar year. The performance gap between
houses and units is stark across Brisbane, with house values
up 3.1% over the year while unit values have slipped 1.2%
lower. The decline in unit values can be attributed to concerns
around over supply in key sectors of the Brisbane market.
Conditions across the Adelaide housing market remained
stable with dwelling values continuing to edge higher, up 0.2%
month-on-month and 0.3% over the final quarter of 2017 to be
3.0% higher over the year.
In Perth, the housing market remained soft, however, Mr
Lawless noted that the rate of decline continued to improve
with the annual fall at -2.3%; the smallest year-on-year drop
since May 2015. The improving conditions are most visible
across Perth’s unit sector, where values are up 0.4% over the
December quarter and supply issues are generally healthier
relative to Perth’s detached housing market.
The best performing capital city over the 2017 calendar year
was Hobart, where dwelling values rose by 12.3%: almost five
times higher than Hobart’s decade average annual rate of
capital gain (2.5%). Despite the strong capital gains, housing
prices remain extremely low in Hobart relative to the larger
mainland capital cities, with the median house value tracking at
$424,251; 54% ($634,000) lower than Sydney values and 49%
($408,000) lower than Melbourne.
Canberra dwelling values edged 0.2% higher in December to
be up 1.0% over the final quarter of the year and 4.9% higher
throughout 2017. Houses are rising at more than double the
rate of unit values, with house values up 5.8% over the year
while unit values are only just beating inflation at 2.1%.
e SA4 region (+11.7%) of New Rental Market Activity:
While the pace of capital gains is slowing, and in some cases
turning negative, rents are gradually rising. According to Mr
Lawless, evidence is mounting to suggest that rental yields
may have bottomed out and are now on the rise. Nationally
yields have edged slightly higher, but in Sydney, where yields
reached a record low of 3.04% in July 2017, they are now at a
twelve month high of 3.12%, but still well below the decade
average of 4.10%.
With a subtle fall in dwelling values across Melbourne last
month, gross rental yields have stabilised around their record
lows of 2.89%; the lowest of any capital city. Mr Lawless said,
“If housing market conditions continue to soften across
Melbourne, particularly as rents rise at around 4.3% per
annum, we could start to see yields firming.”
Across the regional markets of Australia conditions
remain diverse. Dwelling values continued to trend lower
in 2017 across regional Western Australia (-4.3%) while
values were steady across regional South Australia (-0.1%)
and up across the remaining ‘rest of state’ areas. Regional
New South Wales stands out as offering up the best capital
gains, with dwelling values up 7.4% over the calendar year
while values across regional Victoria were 4.2% higher.
The Newcastle and Lake MacquariSouth Wales has seen the
strongest capital gains of any regional market, followed by
Southern Highlands and Shoalhaven (+10.3%) and Geelong
(9.7%).
Gross rental yieldsGross rental yields, dwellings
Houses Units
National Media Release
Media enquiries contact:
Mitch Koper, CoreLogic National Communications Manager –1300 472 767 or media@corelogic.com.au
Media enquiries contact:
Mitch Koper, CoreLogic National Communications Manager –1300 472 767 or media@corelogic.com.au
The weakest regional markets continue to be in
Australia’s outback regions and areas dependent on
the mining sector. The largest fall in dwelling values over
2017 was recorded in Outback Queensland, a region
which encompasses a vast but sparsely populated area of
western Queensland, where dwelling values were down
14.3% in 2017. Rounding out the top five for largest value
falls across the regional areas of Australia were Darling
Downs–Maranoa in Queensland (-8.2%), Outback South
and Outback North in Western Australia (-7.6% and -7.3%)
and Townsville in Queensland (-5.6%).
Mr Lawless said, “In 2018, the housing market
performance is likely to be significantly different relative to
previous years. We’re likely to see lower to negative growth
rates across previously strong markets, more cautious buyers,
and ongoing regulator vigilance of credit standards and
investor activity.”
“Previous downturns have seen the annual number of sales fall
by around 20-25% from peak to trough; considering the cyclical
peak in transactional activity occurred over the twelve months
ending August 2015, year on year transactional activity is
already 13.2% lower than the most recent peak.”
Mr Lawless attributes tighter credit policies as the primary
driver for a softer phase in the housing market cycle over the
coming year. He said, “The trajectory of the housing market
through 2017 has been similar to conditions in 2015/16 when
the first round of macro prudential measures announced by
APRA impacted the availability of credit for investment
purposes. Capital city dwelling values fell by 1.6% between
late 2015 and early 2016; with falls more substantial in Sydney
where investment activity has been more concentrated.
Growth rates rebounded in mid-2016 as lenders
comprehensively achieved their APRA credit limits and interest
rates were slashed by 50 basis points.”
According to Mr Lawless, we’re not likely to see a similar
lifeline thrown to the housing market this time around via lower
interest rates or loosening credit conditions. “Regulators are
likely to be keeping a close eye on credit trends with particular
focus on investment credit and interest only lending, and the
next move in interest rates is more likely to be up not down.
“Although credit policies are likely to remain tight, we expect
mortgage rates to remain low in 2018, providing a positive
lending environment for those who are able to secure credit,”
Mr Lawless said.
In conclusion, Mr Lawless summarises key points that will
underpin a slower but still relatively active housing market:
• Regulators and policy makers are likely to encourage
households who hold high levels of debt to reduce their
exposure while interest rates remain low. Household debt
levels are at record highs, a factor which has been called
out by the Reserve Bank repeatedly, as well as international
institutions such as the OECD, BIS and IMF. With interest
rates remaining low, the opportunity for households to pay
down debt could come at the expense of broader spending
on retail and discretionary items.
• Prospective borrowers, particularly investors, may find
securing a mortgage won’t get any easier in 2018, with
APRA restrictions on both investment related credit growth
and interest only loan settlements likely to remain in place.
Lenders are likely to remain cautious around lending in
higher risk areas such as inner city apartment markets
where current and pending supply pipelines are substantial.
• Labour markets have tightened, with a renewed trend
towards more full-time jobs rather than part-time. Jobs
growth is becoming broader based, ramping up in the
previously weak states of Queensland, Western Australia
and South Australia. A firmer labour market will help to
support consumer confidence and mortgage serviceability
and potentially place some upwards pressure on the near
record low level of wages growth. Strong labour markets
and low rates of unemployment will support a continued
trend of low mortgage arrears despite softer housing market
conditions.
• Migration rates have been trending higher which is likely
to continue into 2018, providing a driver for housing
demand. Overseas migration into Victoria and New South
Wales reached record highs in 2018 and interstate
migration has been on a clear upwards trajectory across
Victoria, Queensland, Tasmania and the ACT.
CoreLogic Australia is expecting softer housing market
conditions through 2018, driven by a continuation of the
slowdown that is clearly evident across Sydney and to a lesser
extent, Melbourne.
Mr Lawless said, “While the headline figures are set to weaken,
below the surface the individual cities and regions of Australia
will continue to operate under their own distinct cycles which
are subject to more localised forces of demand and supply.
Top ten regional markets (SA4 regions) for capital
gain, 12 months to December 2017
National Media Release
Media enquiries contact:
Mitch Koper, CoreLogic National Communications Manager –1300 472 767 or media@corelogic.com.au
Media enquiries contact:
Mitch Koper, CoreLogic National Communications Manager –1300 472 767 or media@corelogic.com.au
CoreLogic Home Value Index tables
Methodology: The CoreLogic Hedonic Home Value Index
is calculated using a hedonic regression methodology that
addresses the issue of compositional bias associated with
median price and other measures. In simple terms, the
index is calculated using recent sales data combined with
information about the attributes of individual properties such
as the number of bedrooms and bathrooms, land area and
geographical context of the dwelling. By separating each
property into its various formational and locational attributes,
observed sales values for each property can be
distinguished between those attributed to the property’s
attributes and those resulting from changes in the
underlying residential property market. Additionally, by
understanding the value associated with each attribute of a
given property, this methodology can be used to estimate
the value of dwellings with known characteristics for which
there is no recent sales price by observing the
characteristics and sales prices of other dwellings which
have recently transacted. It then follows that changes in the
market value of the entire residential property stock can be
accurately tracked through time. The detailed
methodological information can be found at:
https://www.corelogic.com.au/research/rp-data-corelogic-
home-value-index-methodology/
CoreLogic is able to produce a consistently accurate and
robust Hedonic Index due to its extensive property related
database, which includes transaction data for every home
sale within every state and territory. CoreLogic augments
this data with recent sales advice from real estate industry
professionals, listings information and attribute data
collected from a variety of sources.
Recent upgrade to the CoreLogic Hedonic Home Value
Index – September 2017
As a result of the continued expansion of CoreLogic data
assets, changing market dynamics and the availability of
enhanced infrastructure, CoreLogic has undertaken an
extensive exercise to overhaul its Hedonic Home Value
Index. This change introduces numerous improvements to
the methodology and its implementation to ensure it aligns
with leading global best practice as endorsed by the
International Monetary Fund and Bank for International
Settlements. The full details of changes can be found at
https://www.corelogic.com.au/research/rp-data-corelogic-
home-value-index-methodology/. This change is part of
CoreLogic’s continued to endeavour to expand its data
assets and identify opportunities to optimise its analytics in
order to provide the market the most timely and accurate
read on property market conditions. The changes are
applied across the history of the series, providing a
consistent methodology from the commencement through to
the most recent values.
* The median value is the middle estimated value of all
residential properties derived through the hedonic
regression methodology that underlies the CoreLogic
Hedonic Home Value Index.
Sydney Melbourne Brisbane Adelaide Perth Hobart Darwin Canberra
Combined
capitals
Combined
regional National
Month -0.9% -0.2% 0.0% 0.2% -0.1% 1.5% -0.9% 0.2% -0.4% 0.2% -0.3%
Quarter -2.1% 0.9% 0.3% 0.3% 0.1% 3.1% -2.9% 1.0% -0.5% 0.5% -0.3%
YTD 3.1% 8.9% 2.4% 3.0% -2.3% 12.3% -6.5% 4.9% 4.3% 3.8% 4.2%
Annual 3.1% 8.9% 2.4% 3.0% -2.3% 12.3% -6.5% 4.9% 4.3% 3.8% 4.2%
Total return 6.3% 12.1% 6.5% 7.4% 1.6% 17.8% -1.3% 9.6% 7.8% 9.2% 8.1%
Yield 3.1% 2.9% 4.3% 4.2% 3.9% 5.0% 5.9% 4.4% 3.3% 4.9% 3.6%
Median value $895,342 $720,417 $491,391 $432,772 $463,886 $403,800 $424,901 $591,011 $656,161 $355,994 $548,817
Month -1.1% -0.4% 0.1% 0.3% -0.1% 1.5% -0.5% 0.4% -0.5% 0.4% -0.3%
Quarter -2.9% 0.6% 0.5% 0.3% 0.1% 3.0% -2.4% 1.5% -0.8% 0.6% -0.5%
YTD 2.1% 9.1% 3.1% 3.3% -2.6% 12.9% -5.3% 5.8% 4.0% 3.9% 4.0%
Annual 2.1% 9.1% 3.1% 3.3% -2.6% 12.9% -5.3% 5.8% 4.0% 3.9% 4.0%
Total return 5.0% 11.9% 7.2% 7.6% 1.3% 18.4% -0.2% 10.2% 7.3% 9.3% 7.7%
Yield 2.9% 2.6% 4.1% 4.1% 3.8% 4.9% 5.7% 4.1% 3.1% 4.9% 3.5%
Median value $1,058,306 $832,735 $531,248 $458,806 $484,562 $424,251 $469,083 $669,642 $693,736 $361,236 $562,294
Month -0.6% 0.4% -0.4% -0.2% -0.1% 1.4% -1.7% -0.3% -0.2% -0.5% -0.3%
Quarter -0.4% 1.8% -0.6% 0.2% 0.4% 3.4% -4.0% -0.6% 0.3% -0.1% 0.3%
YTD 5.4% 8.4% -1.2% 0.5% -0.9% 9.1% -8.8% 2.1% 5.1% 3.6% 4.9%
Annual 5.4% 8.4% -1.2% 0.5% -0.9% 9.1% -8.8% 2.1% 5.1% 3.6% 4.9%
Total return 9.3% 12.6% 3.7% 5.5% 3.1% 14.8% -3.5% 7.5% 9.3% 9.0% 9.2%
Yield 3.7% 3.8% 5.3% 5.0% 4.3% 5.0% 6.1% 5.4% 3.9% 5.2% 4.1%
Median value $774,124 $574,052 $383,752 $331,325 $408,488 $335,289 $356,992 $431,048 $580,485 $337,049 $516,551
Capitals Aggregate indices
DwellingsHousesUnits

More Related Content

More from LJ Gilland Real Estate Pty Ltd

FIRB 2019 20 ANNUAL REPORT - Queensland is quickly becoming the a choice dest...
FIRB 2019 20 ANNUAL REPORT - Queensland is quickly becoming the a choice dest...FIRB 2019 20 ANNUAL REPORT - Queensland is quickly becoming the a choice dest...
FIRB 2019 20 ANNUAL REPORT - Queensland is quickly becoming the a choice dest...LJ Gilland Real Estate Pty Ltd
 
12 05 20 national vacancy rate increase in apr 2020_media release
12 05 20 national vacancy rate increase in apr 2020_media release12 05 20 national vacancy rate increase in apr 2020_media release
12 05 20 national vacancy rate increase in apr 2020_media releaseLJ Gilland Real Estate Pty Ltd
 
Core logic october 2018 property and economic overview
Core logic october 2018 property and economic overviewCore logic october 2018 property and economic overview
Core logic october 2018 property and economic overviewLJ Gilland Real Estate Pty Ltd
 

More from LJ Gilland Real Estate Pty Ltd (20)

FIRB 2019 20 ANNUAL REPORT - Queensland is quickly becoming the a choice dest...
FIRB 2019 20 ANNUAL REPORT - Queensland is quickly becoming the a choice dest...FIRB 2019 20 ANNUAL REPORT - Queensland is quickly becoming the a choice dest...
FIRB 2019 20 ANNUAL REPORT - Queensland is quickly becoming the a choice dest...
 
Htw month-in-review-march-2021-residential
Htw month-in-review-march-2021-residentialHtw month-in-review-march-2021-residential
Htw month-in-review-march-2021-residential
 
Core logic home value index jan 2021 final
Core logic home value index jan 2021 finalCore logic home value index jan 2021 final
Core logic home value index jan 2021 final
 
Htw month-in-review-september-2020-residential
Htw month-in-review-september-2020-residentialHtw month-in-review-september-2020-residential
Htw month-in-review-september-2020-residential
 
12 05 20 national vacancy rate increase in apr 2020_media release
12 05 20 national vacancy rate increase in apr 2020_media release12 05 20 national vacancy rate increase in apr 2020_media release
12 05 20 national vacancy rate increase in apr 2020_media release
 
Core logic home value index may 2020 final
Core logic home value index may 2020 finalCore logic home value index may 2020 final
Core logic home value index may 2020 final
 
Covid 19_vs_property_2020
Covid 19_vs_property_2020Covid 19_vs_property_2020
Covid 19_vs_property_2020
 
htw-month-in-review-march-2020-residential
htw-month-in-review-march-2020-residentialhtw-month-in-review-march-2020-residential
htw-month-in-review-march-2020-residential
 
Core logic home value index feb 2020 final 0
Core logic home value index feb 2020 final 0Core logic home value index feb 2020 final 0
Core logic home value index feb 2020 final 0
 
Core logic home value index jan 2020 final
Core logic home value index jan 2020 finalCore logic home value index jan 2020 final
Core logic home value index jan 2020 final
 
htw-month-in-review-november-2019 v2-residential
htw-month-in-review-november-2019 v2-residentialhtw-month-in-review-november-2019 v2-residential
htw-month-in-review-november-2019 v2-residential
 
Core logic home value index Nov 19 final
Core logic home value index Nov 19 finalCore logic home value index Nov 19 final
Core logic home value index Nov 19 final
 
The QBE - Australian-Housing-Outlook-2019-2022
The QBE - Australian-Housing-Outlook-2019-2022The QBE - Australian-Housing-Outlook-2019-2022
The QBE - Australian-Housing-Outlook-2019-2022
 
htw-month-in-review-july-2019 residential
htw-month-in-review-july-2019 residentialhtw-month-in-review-july-2019 residential
htw-month-in-review-july-2019 residential
 
HTW-month-in-review-june-2019 residential
HTW-month-in-review-june-2019 residentialHTW-month-in-review-june-2019 residential
HTW-month-in-review-june-2019 residential
 
htw-month-in-review-april-2019 residential-1
htw-month-in-review-april-2019 residential-1htw-month-in-review-april-2019 residential-1
htw-month-in-review-april-2019 residential-1
 
Core logic home value index - January 2019
Core logic home value index - January 2019Core logic home value index - January 2019
Core logic home value index - January 2019
 
Australian property-market-report-october-2018
Australian property-market-report-october-2018Australian property-market-report-october-2018
Australian property-market-report-october-2018
 
Core logic october 2018 property and economic overview
Core logic october 2018 property and economic overviewCore logic october 2018 property and economic overview
Core logic october 2018 property and economic overview
 
2018 08--cl18 quarterly-economic_and_property_review
2018 08--cl18 quarterly-economic_and_property_review2018 08--cl18 quarterly-economic_and_property_review
2018 08--cl18 quarterly-economic_and_property_review
 

Recently uploaded

Cyberagent_For New Investors_EN_240424.pdf
Cyberagent_For New Investors_EN_240424.pdfCyberagent_For New Investors_EN_240424.pdf
Cyberagent_For New Investors_EN_240424.pdfCyberAgent, Inc.
 
Collective Mining | Corporate Presentation - April 2024
Collective Mining | Corporate Presentation - April 2024Collective Mining | Corporate Presentation - April 2024
Collective Mining | Corporate Presentation - April 2024CollectiveMining1
 
slideshare_2404_presentation materials_en.pdf
slideshare_2404_presentation materials_en.pdfslideshare_2404_presentation materials_en.pdf
slideshare_2404_presentation materials_en.pdfsansanir
 
No 1 AMil Baba In Islamabad No 1 Amil Baba In Lahore No 1 Amil Baba In Faisl...
No 1 AMil Baba In Islamabad  No 1 Amil Baba In Lahore No 1 Amil Baba In Faisl...No 1 AMil Baba In Islamabad  No 1 Amil Baba In Lahore No 1 Amil Baba In Faisl...
No 1 AMil Baba In Islamabad No 1 Amil Baba In Lahore No 1 Amil Baba In Faisl...First NO1 World Amil baba in Faisalabad
 
如何办理(UTS毕业证书)悉尼科技大学毕业证学位证书
如何办理(UTS毕业证书)悉尼科技大学毕业证学位证书如何办理(UTS毕业证书)悉尼科技大学毕业证学位证书
如何办理(UTS毕业证书)悉尼科技大学毕业证学位证书Fis s
 
如何办理伦敦大学毕业证(文凭)London学位证书
如何办理伦敦大学毕业证(文凭)London学位证书如何办理伦敦大学毕业证(文凭)London学位证书
如何办理伦敦大学毕业证(文凭)London学位证书Fis s
 
Collective Mining | Corporate Presentation - April 2024
Collective Mining | Corporate Presentation - April 2024Collective Mining | Corporate Presentation - April 2024
Collective Mining | Corporate Presentation - April 2024CollectiveMining1
 
Osisko Gold Royalties Ltd - Corporate Presentation, April 23, 2024
Osisko Gold Royalties Ltd - Corporate Presentation, April 23, 2024Osisko Gold Royalties Ltd - Corporate Presentation, April 23, 2024
Osisko Gold Royalties Ltd - Corporate Presentation, April 23, 2024Osisko Gold Royalties Ltd
 
如何办理密苏里大学堪萨斯分校毕业证(文凭)UMKC学位证书
如何办理密苏里大学堪萨斯分校毕业证(文凭)UMKC学位证书如何办理密苏里大学堪萨斯分校毕业证(文凭)UMKC学位证书
如何办理密苏里大学堪萨斯分校毕业证(文凭)UMKC学位证书Fir La
 
The resilient U.S. late-cycle expansion contributed to a stalling pattern in ...
The resilient U.S. late-cycle expansion contributed to a stalling pattern in ...The resilient U.S. late-cycle expansion contributed to a stalling pattern in ...
The resilient U.S. late-cycle expansion contributed to a stalling pattern in ...Kumaran637735
 
如何办理东俄勒冈大学毕业证(文凭)EOU学位证书
如何办理东俄勒冈大学毕业证(文凭)EOU学位证书如何办理东俄勒冈大学毕业证(文凭)EOU学位证书
如何办理东俄勒冈大学毕业证(文凭)EOU学位证书Fir La
 
9654467111 Low Rate Call Girls In Tughlakabad, Delhi NCR
9654467111 Low Rate Call Girls In Tughlakabad, Delhi NCR9654467111 Low Rate Call Girls In Tughlakabad, Delhi NCR
9654467111 Low Rate Call Girls In Tughlakabad, Delhi NCRSapana Sha
 
WheelTug PLC Pitch Deck | Investor Insights | April 2024
WheelTug PLC Pitch Deck | Investor Insights | April 2024WheelTug PLC Pitch Deck | Investor Insights | April 2024
WheelTug PLC Pitch Deck | Investor Insights | April 2024Hector Del Castillo, CPM, CPMM
 
Methanex Investor Presentation (April 2024)
Methanex Investor Presentation (April 2024)Methanex Investor Presentation (April 2024)
Methanex Investor Presentation (April 2024)Methanex Corporation
 

Recently uploaded (20)

Model Call Girl in Udyog Vihar Delhi reach out to us at 🔝9953056974🔝
Model Call Girl in Udyog Vihar Delhi reach out to us at 🔝9953056974🔝Model Call Girl in Udyog Vihar Delhi reach out to us at 🔝9953056974🔝
Model Call Girl in Udyog Vihar Delhi reach out to us at 🔝9953056974🔝
 
Cyberagent_For New Investors_EN_240424.pdf
Cyberagent_For New Investors_EN_240424.pdfCyberagent_For New Investors_EN_240424.pdf
Cyberagent_For New Investors_EN_240424.pdf
 
Collective Mining | Corporate Presentation - April 2024
Collective Mining | Corporate Presentation - April 2024Collective Mining | Corporate Presentation - April 2024
Collective Mining | Corporate Presentation - April 2024
 
young call girls in Hauz Khas,🔝 9953056974 🔝 escort Service
young call girls in Hauz Khas,🔝 9953056974 🔝 escort Serviceyoung call girls in Hauz Khas,🔝 9953056974 🔝 escort Service
young call girls in Hauz Khas,🔝 9953056974 🔝 escort Service
 
slideshare_2404_presentation materials_en.pdf
slideshare_2404_presentation materials_en.pdfslideshare_2404_presentation materials_en.pdf
slideshare_2404_presentation materials_en.pdf
 
young call girls in Govindpuri 🔝 9953056974 🔝 Delhi escort Service
young call girls in Govindpuri 🔝 9953056974 🔝 Delhi escort Serviceyoung call girls in Govindpuri 🔝 9953056974 🔝 Delhi escort Service
young call girls in Govindpuri 🔝 9953056974 🔝 Delhi escort Service
 
young call girls in Yamuna Vihar 🔝 9953056974 🔝 Delhi escort Service
young  call girls in   Yamuna Vihar 🔝 9953056974 🔝 Delhi escort Serviceyoung  call girls in   Yamuna Vihar 🔝 9953056974 🔝 Delhi escort Service
young call girls in Yamuna Vihar 🔝 9953056974 🔝 Delhi escort Service
 
No 1 AMil Baba In Islamabad No 1 Amil Baba In Lahore No 1 Amil Baba In Faisl...
No 1 AMil Baba In Islamabad  No 1 Amil Baba In Lahore No 1 Amil Baba In Faisl...No 1 AMil Baba In Islamabad  No 1 Amil Baba In Lahore No 1 Amil Baba In Faisl...
No 1 AMil Baba In Islamabad No 1 Amil Baba In Lahore No 1 Amil Baba In Faisl...
 
Escort Service Call Girls In Shalimar Bagh, 99530°56974 Delhi NCR
Escort Service Call Girls In Shalimar Bagh, 99530°56974 Delhi NCREscort Service Call Girls In Shalimar Bagh, 99530°56974 Delhi NCR
Escort Service Call Girls In Shalimar Bagh, 99530°56974 Delhi NCR
 
如何办理(UTS毕业证书)悉尼科技大学毕业证学位证书
如何办理(UTS毕业证书)悉尼科技大学毕业证学位证书如何办理(UTS毕业证书)悉尼科技大学毕业证学位证书
如何办理(UTS毕业证书)悉尼科技大学毕业证学位证书
 
如何办理伦敦大学毕业证(文凭)London学位证书
如何办理伦敦大学毕业证(文凭)London学位证书如何办理伦敦大学毕业证(文凭)London学位证书
如何办理伦敦大学毕业证(文凭)London学位证书
 
young Call girls in Dwarka sector 1🔝 9953056974 🔝 Delhi escort Service
young Call girls in Dwarka sector 1🔝 9953056974 🔝 Delhi escort Serviceyoung Call girls in Dwarka sector 1🔝 9953056974 🔝 Delhi escort Service
young Call girls in Dwarka sector 1🔝 9953056974 🔝 Delhi escort Service
 
Collective Mining | Corporate Presentation - April 2024
Collective Mining | Corporate Presentation - April 2024Collective Mining | Corporate Presentation - April 2024
Collective Mining | Corporate Presentation - April 2024
 
Osisko Gold Royalties Ltd - Corporate Presentation, April 23, 2024
Osisko Gold Royalties Ltd - Corporate Presentation, April 23, 2024Osisko Gold Royalties Ltd - Corporate Presentation, April 23, 2024
Osisko Gold Royalties Ltd - Corporate Presentation, April 23, 2024
 
如何办理密苏里大学堪萨斯分校毕业证(文凭)UMKC学位证书
如何办理密苏里大学堪萨斯分校毕业证(文凭)UMKC学位证书如何办理密苏里大学堪萨斯分校毕业证(文凭)UMKC学位证书
如何办理密苏里大学堪萨斯分校毕业证(文凭)UMKC学位证书
 
The resilient U.S. late-cycle expansion contributed to a stalling pattern in ...
The resilient U.S. late-cycle expansion contributed to a stalling pattern in ...The resilient U.S. late-cycle expansion contributed to a stalling pattern in ...
The resilient U.S. late-cycle expansion contributed to a stalling pattern in ...
 
如何办理东俄勒冈大学毕业证(文凭)EOU学位证书
如何办理东俄勒冈大学毕业证(文凭)EOU学位证书如何办理东俄勒冈大学毕业证(文凭)EOU学位证书
如何办理东俄勒冈大学毕业证(文凭)EOU学位证书
 
9654467111 Low Rate Call Girls In Tughlakabad, Delhi NCR
9654467111 Low Rate Call Girls In Tughlakabad, Delhi NCR9654467111 Low Rate Call Girls In Tughlakabad, Delhi NCR
9654467111 Low Rate Call Girls In Tughlakabad, Delhi NCR
 
WheelTug PLC Pitch Deck | Investor Insights | April 2024
WheelTug PLC Pitch Deck | Investor Insights | April 2024WheelTug PLC Pitch Deck | Investor Insights | April 2024
WheelTug PLC Pitch Deck | Investor Insights | April 2024
 
Methanex Investor Presentation (April 2024)
Methanex Investor Presentation (April 2024)Methanex Investor Presentation (April 2024)
Methanex Investor Presentation (April 2024)
 

2018 01-cl hedonic-homevalueindexresults
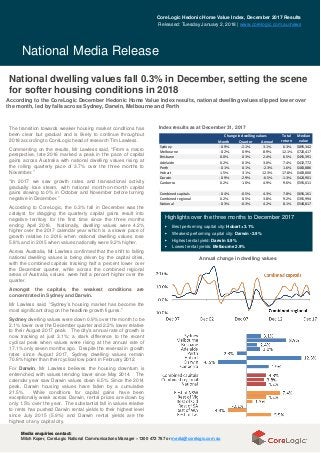
  • 1. National Media Release Media enquiries contact: Mitch Koper, CoreLogic National Communications Manager –1300 472 767 or media@corelogic.com.au Media enquiries contact: Mitch Koper, CoreLogic National Communications Manager –1300 472 767 or media@corelogic.com.au Annual change in dwelling values Highlights over the three months to December 2017 ▶ Best performing capital city: Hobart +3.1% ▶ Weakest performing capital city: Darwin -2.9% ▶ Highest rental yield: Darwin 5.9% ▶ Lowest rental yields: Melbourne 2.9% Index results as at December 31, 2017The transition towards weaker housing market conditions has been clear but gradual and is likely to continue throughout 2018 according to CoreLogic head of research Tim Lawless. Commenting on the results, Mr Lawless said, “From a macro perspective, late 2016 marked a peak in the pace of capital gains across Australia with national dwelling values rising at the rolling quarterly pace of 3.7% over the three months to November.” “In 2017 we saw growth rates and transactional activity gradually lose steam, with national month-on-month capital gains slowing to 0% in October and November before turning negative in December.” According to CoreLogic, the 0.3% fall in December was the catalyst for dragging the quarterly capital gains result into negative territory for the first time since the three months ending April 2016. Nationally, dwelling values were 4.2% higher over the 2017 calendar year which is a slower pace of growth relative to 2016 when national dwelling values rose 5.8% and in 2015 when values nationally were 9.2% higher. Across Australia, Mr Lawless confirmed that the shift to falling national dwelling values is being driven by the capital cities, with the combined capitals tracking half a percent lower over the December quarter, while across the combined regional areas of Australia, values were half a percent higher over the quarter. Amongst the capitals, the weakest conditions are concentrated in Sydney and Darwin. Mr Lawless said, “Sydney’s housing market has become the most significant drag on the headline growth figures.” Sydney dwelling values were down 0.9% over the month to be 2.1% lower over the December quarter and 2.2% lower relative to their August 2017 peak. The city’s annual rate of growth is now tracking at just 3.1%; a stark difference to the recent cyclical peak when values were rising at the annual rate of 17.1% only seven months ago. Despite the reversal in growth rates since August 2017, Sydney dwelling values remain 70.8% higher than their cyclical low point in February 2012. For Darwin, Mr Lawless believes the housing downturn is entrenched, with values trending lower since May 2014. The calendar year saw Darwin values down 6.5%. Since the 2014 peak, Darwin housing values have fallen by a cumulative 21.5%. While conditions for capital gains have been exceptionally weak across Darwin, rental prices are down by only 1.5% over the year. The substantial fall in values relative to rents has pushed Darwin rental yields to their highest level since July 2015 (5.9%) and Darwin rental yields are the highest of any capital city. National dwelling values fall 0.3% in December, setting the scene for softer housing conditions in 2018 According to the CoreLogic December Hedonic Home Value Index results, national dwelling values slipped lower over the month, led by falls across Sydney, Darwin, Melbourne and Perth CoreLogic Hedonic Home Value Index, December 2017 Results Released: Tuesday January 2, 2018 | www.corelogic.com.au/news Month Quarter Annual Sydney -0.9% -2.1% 3.1% 6.3% $895,342 Melbourne -0.2% 0.9% 8.9% 12.1% $720,417 Brisbane 0.0% 0.3% 2.4% 6.5% $491,391 Adelaide 0.2% 0.3% 3.0% 7.4% $432,772 Perth -0.1% 0.1% -2.3% 1.6% $463,886 Hobart 1.5% 3.1% 12.3% 17.8% $403,800 Darwin -0.9% -2.9% -6.5% -1.3% $424,901 Canberra 0.2% 1.0% 4.9% 9.6% $591,011 Combined capitals -0.4% -0.5% 4.3% 7.8% $656,161 Combined regional 0.2% 0.5% 3.8% 9.2% $355,994 National -0.3% -0.3% 4.2% 8.1% $548,817 Total return Median value Change in dwelling values
  • 2. National Media Release Media enquiries contact: Mitch Koper, CoreLogic National Communications Manager –1300 472 767 or media@corelogic.com.au Media enquiries contact: Mitch Koper, CoreLogic National Communications Manager –1300 472 767 or media@corelogic.com.au Melbourne, also posted a negative month-on-month change with dwelling values slipping 0.2% lower in December; the first monthly fall recorded since February 2016. Mr Lawless said, “The city’s housing market has been far more resilient to negative growth compared with Sydney due to factors such as stronger population growth, lower affordability hurdles and a higher rate of jobs growth, however the growth trend has been clearly moderating since late 2016 and Melbourne’s annual rate of capital gain, at 8.9%, has fallen below double digits for the first time in eleven months.” For Brisbane the housing market continued along a steady growth trajectory with dwelling values unchanged in December and only 0.3% higher over the December quarter. Annual capital gains are only slightly higher than inflation, tracking at 2.4% over the calendar year. The performance gap between houses and units is stark across Brisbane, with house values up 3.1% over the year while unit values have slipped 1.2% lower. The decline in unit values can be attributed to concerns around over supply in key sectors of the Brisbane market. Conditions across the Adelaide housing market remained stable with dwelling values continuing to edge higher, up 0.2% month-on-month and 0.3% over the final quarter of 2017 to be 3.0% higher over the year. In Perth, the housing market remained soft, however, Mr Lawless noted that the rate of decline continued to improve with the annual fall at -2.3%; the smallest year-on-year drop since May 2015. The improving conditions are most visible across Perth’s unit sector, where values are up 0.4% over the December quarter and supply issues are generally healthier relative to Perth’s detached housing market. The best performing capital city over the 2017 calendar year was Hobart, where dwelling values rose by 12.3%: almost five times higher than Hobart’s decade average annual rate of capital gain (2.5%). Despite the strong capital gains, housing prices remain extremely low in Hobart relative to the larger mainland capital cities, with the median house value tracking at $424,251; 54% ($634,000) lower than Sydney values and 49% ($408,000) lower than Melbourne. Canberra dwelling values edged 0.2% higher in December to be up 1.0% over the final quarter of the year and 4.9% higher throughout 2017. Houses are rising at more than double the rate of unit values, with house values up 5.8% over the year while unit values are only just beating inflation at 2.1%. e SA4 region (+11.7%) of New Rental Market Activity: While the pace of capital gains is slowing, and in some cases turning negative, rents are gradually rising. According to Mr Lawless, evidence is mounting to suggest that rental yields may have bottomed out and are now on the rise. Nationally yields have edged slightly higher, but in Sydney, where yields reached a record low of 3.04% in July 2017, they are now at a twelve month high of 3.12%, but still well below the decade average of 4.10%. With a subtle fall in dwelling values across Melbourne last month, gross rental yields have stabilised around their record lows of 2.89%; the lowest of any capital city. Mr Lawless said, “If housing market conditions continue to soften across Melbourne, particularly as rents rise at around 4.3% per annum, we could start to see yields firming.” Across the regional markets of Australia conditions remain diverse. Dwelling values continued to trend lower in 2017 across regional Western Australia (-4.3%) while values were steady across regional South Australia (-0.1%) and up across the remaining ‘rest of state’ areas. Regional New South Wales stands out as offering up the best capital gains, with dwelling values up 7.4% over the calendar year while values across regional Victoria were 4.2% higher. The Newcastle and Lake MacquariSouth Wales has seen the strongest capital gains of any regional market, followed by Southern Highlands and Shoalhaven (+10.3%) and Geelong (9.7%). Gross rental yieldsGross rental yields, dwellings Houses Units
  • 3. National Media Release Media enquiries contact: Mitch Koper, CoreLogic National Communications Manager –1300 472 767 or media@corelogic.com.au Media enquiries contact: Mitch Koper, CoreLogic National Communications Manager –1300 472 767 or media@corelogic.com.au The weakest regional markets continue to be in Australia’s outback regions and areas dependent on the mining sector. The largest fall in dwelling values over 2017 was recorded in Outback Queensland, a region which encompasses a vast but sparsely populated area of western Queensland, where dwelling values were down 14.3% in 2017. Rounding out the top five for largest value falls across the regional areas of Australia were Darling Downs–Maranoa in Queensland (-8.2%), Outback South and Outback North in Western Australia (-7.6% and -7.3%) and Townsville in Queensland (-5.6%). Mr Lawless said, “In 2018, the housing market performance is likely to be significantly different relative to previous years. We’re likely to see lower to negative growth rates across previously strong markets, more cautious buyers, and ongoing regulator vigilance of credit standards and investor activity.” “Previous downturns have seen the annual number of sales fall by around 20-25% from peak to trough; considering the cyclical peak in transactional activity occurred over the twelve months ending August 2015, year on year transactional activity is already 13.2% lower than the most recent peak.” Mr Lawless attributes tighter credit policies as the primary driver for a softer phase in the housing market cycle over the coming year. He said, “The trajectory of the housing market through 2017 has been similar to conditions in 2015/16 when the first round of macro prudential measures announced by APRA impacted the availability of credit for investment purposes. Capital city dwelling values fell by 1.6% between late 2015 and early 2016; with falls more substantial in Sydney where investment activity has been more concentrated. Growth rates rebounded in mid-2016 as lenders comprehensively achieved their APRA credit limits and interest rates were slashed by 50 basis points.” According to Mr Lawless, we’re not likely to see a similar lifeline thrown to the housing market this time around via lower interest rates or loosening credit conditions. “Regulators are likely to be keeping a close eye on credit trends with particular focus on investment credit and interest only lending, and the next move in interest rates is more likely to be up not down. “Although credit policies are likely to remain tight, we expect mortgage rates to remain low in 2018, providing a positive lending environment for those who are able to secure credit,” Mr Lawless said. In conclusion, Mr Lawless summarises key points that will underpin a slower but still relatively active housing market: • Regulators and policy makers are likely to encourage households who hold high levels of debt to reduce their exposure while interest rates remain low. Household debt levels are at record highs, a factor which has been called out by the Reserve Bank repeatedly, as well as international institutions such as the OECD, BIS and IMF. With interest rates remaining low, the opportunity for households to pay down debt could come at the expense of broader spending on retail and discretionary items. • Prospective borrowers, particularly investors, may find securing a mortgage won’t get any easier in 2018, with APRA restrictions on both investment related credit growth and interest only loan settlements likely to remain in place. Lenders are likely to remain cautious around lending in higher risk areas such as inner city apartment markets where current and pending supply pipelines are substantial. • Labour markets have tightened, with a renewed trend towards more full-time jobs rather than part-time. Jobs growth is becoming broader based, ramping up in the previously weak states of Queensland, Western Australia and South Australia. A firmer labour market will help to support consumer confidence and mortgage serviceability and potentially place some upwards pressure on the near record low level of wages growth. Strong labour markets and low rates of unemployment will support a continued trend of low mortgage arrears despite softer housing market conditions. • Migration rates have been trending higher which is likely to continue into 2018, providing a driver for housing demand. Overseas migration into Victoria and New South Wales reached record highs in 2018 and interstate migration has been on a clear upwards trajectory across Victoria, Queensland, Tasmania and the ACT. CoreLogic Australia is expecting softer housing market conditions through 2018, driven by a continuation of the slowdown that is clearly evident across Sydney and to a lesser extent, Melbourne. Mr Lawless said, “While the headline figures are set to weaken, below the surface the individual cities and regions of Australia will continue to operate under their own distinct cycles which are subject to more localised forces of demand and supply. Top ten regional markets (SA4 regions) for capital gain, 12 months to December 2017
  • 4. National Media Release Media enquiries contact: Mitch Koper, CoreLogic National Communications Manager –1300 472 767 or media@corelogic.com.au Media enquiries contact: Mitch Koper, CoreLogic National Communications Manager –1300 472 767 or media@corelogic.com.au CoreLogic Home Value Index tables Methodology: The CoreLogic Hedonic Home Value Index is calculated using a hedonic regression methodology that addresses the issue of compositional bias associated with median price and other measures. In simple terms, the index is calculated using recent sales data combined with information about the attributes of individual properties such as the number of bedrooms and bathrooms, land area and geographical context of the dwelling. By separating each property into its various formational and locational attributes, observed sales values for each property can be distinguished between those attributed to the property’s attributes and those resulting from changes in the underlying residential property market. Additionally, by understanding the value associated with each attribute of a given property, this methodology can be used to estimate the value of dwellings with known characteristics for which there is no recent sales price by observing the characteristics and sales prices of other dwellings which have recently transacted. It then follows that changes in the market value of the entire residential property stock can be accurately tracked through time. The detailed methodological information can be found at: https://www.corelogic.com.au/research/rp-data-corelogic- home-value-index-methodology/ CoreLogic is able to produce a consistently accurate and robust Hedonic Index due to its extensive property related database, which includes transaction data for every home sale within every state and territory. CoreLogic augments this data with recent sales advice from real estate industry professionals, listings information and attribute data collected from a variety of sources. Recent upgrade to the CoreLogic Hedonic Home Value Index – September 2017 As a result of the continued expansion of CoreLogic data assets, changing market dynamics and the availability of enhanced infrastructure, CoreLogic has undertaken an extensive exercise to overhaul its Hedonic Home Value Index. This change introduces numerous improvements to the methodology and its implementation to ensure it aligns with leading global best practice as endorsed by the International Monetary Fund and Bank for International Settlements. The full details of changes can be found at https://www.corelogic.com.au/research/rp-data-corelogic- home-value-index-methodology/. This change is part of CoreLogic’s continued to endeavour to expand its data assets and identify opportunities to optimise its analytics in order to provide the market the most timely and accurate read on property market conditions. The changes are applied across the history of the series, providing a consistent methodology from the commencement through to the most recent values. * The median value is the middle estimated value of all residential properties derived through the hedonic regression methodology that underlies the CoreLogic Hedonic Home Value Index. Sydney Melbourne Brisbane Adelaide Perth Hobart Darwin Canberra Combined capitals Combined regional National Month -0.9% -0.2% 0.0% 0.2% -0.1% 1.5% -0.9% 0.2% -0.4% 0.2% -0.3% Quarter -2.1% 0.9% 0.3% 0.3% 0.1% 3.1% -2.9% 1.0% -0.5% 0.5% -0.3% YTD 3.1% 8.9% 2.4% 3.0% -2.3% 12.3% -6.5% 4.9% 4.3% 3.8% 4.2% Annual 3.1% 8.9% 2.4% 3.0% -2.3% 12.3% -6.5% 4.9% 4.3% 3.8% 4.2% Total return 6.3% 12.1% 6.5% 7.4% 1.6% 17.8% -1.3% 9.6% 7.8% 9.2% 8.1% Yield 3.1% 2.9% 4.3% 4.2% 3.9% 5.0% 5.9% 4.4% 3.3% 4.9% 3.6% Median value $895,342 $720,417 $491,391 $432,772 $463,886 $403,800 $424,901 $591,011 $656,161 $355,994 $548,817 Month -1.1% -0.4% 0.1% 0.3% -0.1% 1.5% -0.5% 0.4% -0.5% 0.4% -0.3% Quarter -2.9% 0.6% 0.5% 0.3% 0.1% 3.0% -2.4% 1.5% -0.8% 0.6% -0.5% YTD 2.1% 9.1% 3.1% 3.3% -2.6% 12.9% -5.3% 5.8% 4.0% 3.9% 4.0% Annual 2.1% 9.1% 3.1% 3.3% -2.6% 12.9% -5.3% 5.8% 4.0% 3.9% 4.0% Total return 5.0% 11.9% 7.2% 7.6% 1.3% 18.4% -0.2% 10.2% 7.3% 9.3% 7.7% Yield 2.9% 2.6% 4.1% 4.1% 3.8% 4.9% 5.7% 4.1% 3.1% 4.9% 3.5% Median value $1,058,306 $832,735 $531,248 $458,806 $484,562 $424,251 $469,083 $669,642 $693,736 $361,236 $562,294 Month -0.6% 0.4% -0.4% -0.2% -0.1% 1.4% -1.7% -0.3% -0.2% -0.5% -0.3% Quarter -0.4% 1.8% -0.6% 0.2% 0.4% 3.4% -4.0% -0.6% 0.3% -0.1% 0.3% YTD 5.4% 8.4% -1.2% 0.5% -0.9% 9.1% -8.8% 2.1% 5.1% 3.6% 4.9% Annual 5.4% 8.4% -1.2% 0.5% -0.9% 9.1% -8.8% 2.1% 5.1% 3.6% 4.9% Total return 9.3% 12.6% 3.7% 5.5% 3.1% 14.8% -3.5% 7.5% 9.3% 9.0% 9.2% Yield 3.7% 3.8% 5.3% 5.0% 4.3% 5.0% 6.1% 5.4% 3.9% 5.2% 4.1% Median value $774,124 $574,052 $383,752 $331,325 $408,488 $335,289 $356,992 $431,048 $580,485 $337,049 $516,551 Capitals Aggregate indices DwellingsHousesUnits