
Recommended
Recommended
More Related Content
Similar to Determination of medical waste composition in hospitals of Sana'a city, Yemen GAWAD M. A. ALWABR د. جواد الوبر اليمن المخلفات الطبية .pdf
Similar to Determination of medical waste composition in hospitals of Sana'a city, Yemen GAWAD M. A. ALWABR د. جواد الوبر اليمن المخلفات الطبية .pdf (20)
More from Dr. Gawad Alwabr
More from Dr. Gawad Alwabr (15)
Recently uploaded
Recently uploaded (20)
Determination of medical waste composition in hospitals of Sana'a city, Yemen GAWAD M. A. ALWABR د. جواد الوبر اليمن المخلفات الطبية .pdf
- 1. alwabr2000@gmail.com mail: - Corresponding author E * JASEM ISSN 1119-8362 All rights reserved J A S E M . OURNAL OF PPLIED CIENCE AND NVIRONMENTAL ANAGEMENT J. Appl. Sci. Environ. Manage. June., 2016 Vol. 20 (2) 343 – 347 Full-text Available Online at and www.ajol.info www.bioline.org.br/ja Determination of medical waste composition in hospitals of Sana'a city, Yemen GAWAD M. A. ALWABR 1 * , AHMED S. AL-MIKHLAFI 2 , SAIF A. AL-HAKIMI 2 , MUNIRA A. DUGHISH 3 Sana'a Community College, Sana'a, Yemen. Department of Earth and Environmental Sciences, Faculty of Science, University of Sana'a, Yemen. University of Sana'a, Yemen. , Medicine Department of Biochemistry, Faculty of * Corresponding author E-mail: alwabr2000@gmail.com; Tel: (+967) 777160932. ABSTRACT: The composition analysis of medical waste is generally considered to be the fundamental information for the most basic steps in the development of a plan for solid hospitals waste management. The objectives of this study were to determine the quantity, generation rate, and the physical composition of medical waste generated in hospitals of Sana'a city, Yemen. This cross-sectional, descriptive study was conducted on the composition of hospital wastes generated in four governmental hospitals in Sana'a City. Purposive sampling was used in the selection of the hospitals, which included (Al-Thawra, Al-Kuwait, Republic, and Military). Results of this study showed that the daily average of the waste generated from the studied hospitals was 5615 kg/day. Approximately 26% of the total waste was hazardous (infectious, pathological, and chemical wastes). While 74% was a general (non-hazardous) waste. The average rate of the total waste generation was 3 kg/patient/day, and 2.5 kg/bed/day. The mean individual components of generated waste in the studied hospitals were; foods 27%, plastic 22%, paper/cardboard 22%, glass 11%, metals 10%, and others 8%. In conclusion, about 26% of the waste was hazardous. The physical component analysis of the waste indicated that the foods, plastic, and paper/cartoon has the highest content of the hospitals waste. Decision makers in Yemen can use this study information for designing and plan the properly management for the collecting system and the healthy disposal of the hazardous waste. Also, for estimating the total policy of required facilities, manpower, and other related costs. © JASEM http://dx.doi.org/10.4314/jasem.v20i2.15 KEYWORDS: Composition; medical waste; hospitals waste; Yemen. Introduction There are currently several terms used to describe waste that is generated from the health care facilities. This type of waste results from the treatment, diagnosis, or immunization of humans and/or animals in the hospitals, veterinary and health-related research facilities, and medical laboratories (Bendjoudi et al., 2009). Healthcare waste is defined as the total waste stream generated in a healthcare facilities, including solid waste and wastewater. Healthcare solid waste consists of all the waste produced by health care facilities (primary, secondary and tertiary), research centers, and laboratories, which classified into two main categories: general (non-hazardous), and hazardous waste. Only 10–25% of medical solid waste is regarded as hazardous and the remaining 75 - 90% is a general healthcare's solid waste (Mesdaghinia et al., 2009). General solid waste produced in the hospitals is related to food preparation, administrative departments, and landscaping, this type of waste is similar to household waste and city waste. The hazardous wastes are contents of infectious wastes, sharp objects contaminated with patients’ blood and secretions, radioactive wastes and chemical materials (Pruss et al., 2013). The minimization and effective management of biomedical waste are through identification and segregation of the hazardous waste. To tackle the problem of identification of biomedical waste different types of color code plastic bags or containers are used which is the most appropriate way (Dwivedi et al., 2009). The objectives of this study were to determine the quantity, generation rate, and the physical composition of medical waste generated in hospitals of Sana'a city, Yemen. MATERIALS AND METHODS Purposive sampling was used in the selection of the hospitals which included four governmental hospitals (Al-Thawra, Al-Kuwait, Republic, and Military). These hospitals are the largest hospitals in the country, comprise many departments, and comprehensive medical compounds. In order to determine the total daily rate and characteristics of wastes from the studied hospitals, each department of these hospitals has been visited every month for a period of over ten months. Medical waste that was
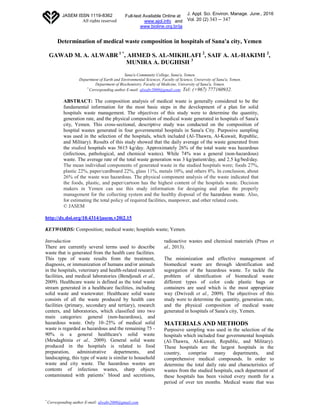
- 2. etermination of medical waste composition in hospitals of Sana'a city, Yemen 344 GAWAD M. A. ALWABR 1 * , AHMED S. AL-MIKHLAFI 2 , SAIF A. AL-HAKIMI 2 , MUNIRA A. DUGHISH 3 generated in each department of the studied hospitals were practically examined for their compositions, classified and segregated, and weighed on a daily basis for a period of up to 28 days. The twenty-eight days distributed over a ten months (from August 2012 to June 2013) to get a real picture of the average quantity and quality of the generated waste. The materials used for segregation and weighing the waste were colored bags, spring balance, and forks. The segregation and measurements of the waste were made after arrangements with the occupational and public health officers in the hospitals. All the generated waste were segregated and weighed each day during a period of 28 days, and the data was recorded in the data sheets. The quantity of the waste was presented in terms of kg/day, kg/bed/day and kg/patient/day for hazardous and general waste, separately, and combined. And also, the general waste was sorted into various components (such as paper, glass, plastic, metal), the weight of each component was estimated and recorded. RESULTS AND DISCUSSION Waste Generation and Composition: The daily average of the total amount of all the studied hospitals' waste was 5615 kg, 4161 kg/day (74%) consisted of general waste and 1474 kg/day (26%) consisted of hazardous waste (Table 1). The amount of waste generated in the hospitals depended on various factors such as a number of beds/patients, types of the health services provided, the socio- economic status of the patients and the general condition of the area where the hospital is situated. The percentage of the hazardous fraction of hospital waste in hospitals Military, Al-Kuwait, Republic, and Al-Thawra were; 25%, 33%, 20%, and 27% respectively (Fig. 1). The difference between the percentage of the hazardous waste refers to the quality of the waste sorting in each hospital. This study result was similar to a previous study result conducted in Bangladesh (Hassan et al., 2008). While in contrast with previous studies conducted in Egypt (Abd EL-Salam, 2010), Libya (Sawalem et al., 2009), Iran (Taghipour and Mosaferi, 2009), Bangladesh (Razzak et al., 2014), and Nepal (Majumder et al., 2007), These differences refers to the quality of waste segregation and the hospitals' activities. The results of this study showed that the average generation rate of the hazardous waste in all the studied hospitals was 0.7 kg/bed/day, and 0.8 kg/patient/day. And the average generation rate of the non-hazardous waste was 1.8 kg/bed/day, and 2.3 kg/patient/day. Mainly, the average rate of the total waste generation was (3 kg/patient/day), and (2.5 kg/bed/day) in the range of (2.7 - 3.3 kg/patient/day), and (2.3 - 2.8 kg/bed/day). This range is within the range of value estimated by the WHO which was (1.3 - 3 kg/bed/day) for the countries in the Middle East (Pruss et al., 2013). In terms of waste generation, this study finding was similar to a previous studies' results conducted in Iran (Taghipour and Mosaferi, 2009), Bangladesh (Razzak et al., 2014), India (Patil and Pokhrel, 2005), and Taiwan (Cheng et al., 2009). In contrast, this study has shown lower figures compared with the figures of the previous studies conducted in Jordan (Bdour et al., 2007), and Iran (Dehghani et al., 2008). However, were higher than the figures of other previous studies conducted in Libya (Sawalem et al., 2009), Tanzania (Kagonji and Manyele, 2011), South Africa (Nemathaga et al., 2008), Bangladesh (Biswas et al., 2011), Nepal (Majumder et al., 2007), Pakistan (Pandit et al., 2007), and China (Ruoyan et al., 2010). These differences in the findings might attribute to the differences in some factors such as the type of the hospital, the level of instrumentation, the location of the hospital, the cultural features of the population, the traditional in the country, the socioeconomic, and the style of living. The results obtained in this study showed that the mean individual components of generated waste in the studied hospitals were; food 27%, plastic 22%, paper/cardboard 22%, glass 11%, metals 10%, and others 8%. The maximum percentages of the components are related to the food (Fig. 2). The high volume of the food waste indicates the importance of managing food preparation and serving in the hospitals in ways that reduce the waste generation rate. Also, the high volume of the plastic and paper/cardboard waste were due to the widespread using of disposables rather than reusable materials for various purposes (e.g. bottles, packaging materials, and bags used for foods). A comparison of the present study results with the some related studies that were conducted in various countries does not show full agreement (Table 2). The composition of the waste was varied between the different countries. This variation depends on the hospital specializations, hospital size, socioeconomic of the population, cultural features of the patients. Furthermore, the use of disposable instruments and packaging materials and waste management practices. Waste Generation Rate at Level of Department/Units of the Studied Hospitals : The amount of waste generated in each department/unit was affected by several major factors such as "the number of beds, the number of patients present at the time of the measurement, and type of services offered". According to these factors, the waste generation rate
- 3. etermination of medical waste composition in hospitals of Sana'a city, Yemen 345 GAWAD M. A. ALWABR 1 * , AHMED S. AL-MIKHLAFI 2 , SAIF A. AL-HAKIMI 2 , MUNIRA A. DUGHISH 3 of each department in the Military, Al-Kuwait, Republic and Al-Thawra hospitals were determined and results are given below. Military Hospital: The average number of inpatients in the Military hospital were 435 and the number of beds was 602. The percentage of the total solid waste in each department of the hospital in decreasing order were as the following: Cardiology and Cardio care center (12.7 %), Orthopaedics (10.7%), Renal dialysis, (11%) Internal medicine (7.80%), General surgery (7.60%), Laboratory (5.40%), Operation theaters (5.20%), the chest (4.30 %), Neurosurgery (3.30 %), I.C.U. (3.20%), Emergency (3.10%), Urology (2.80%) and blood vessels and Pharmacy (2.40%). The highest volume of the hazardous waste that was generated from the Cardiology and Cardio care center, and Laboratory (15.10%) each. While the least volume of the hazardous waste was generated in the Special ward (1.40%). Al-Kuwait Hospital:The average number of inpatients in the Al-Kuwait hospital were 232 and the number of beds was 268. The percentage of the total solid waste in each department of the hospital in decreasing order were as the following: General surgery (16.50%), Obstetrics and Gynecology (13.30%), Emergency (9.40%), Internal medicine (9.10%), Operation theaters (8.60%), Laboratory (6.10%), Outpatient Clinics (5.50%), I.C.U. (4.50%), Children (3.60%), Cardiac Catheterization. (2.70%), tissues (1.90%) and E.N.T. (1.40%). The highest volume of the hazardous waste that was generated from the Obstetrics and Gynecology, and General surgery (23.6%) each. While the least volume of the hazardous waste was generated in the Cardiac Catheterization (0.90 %). Republic Hospital: The average number of inpatients in the Republic hospital were 326 and the number of beds was 450. The percentage of the total solid waste in each department of the hospital in decreasing order were as the following: Internal medicine (11.80%), Emergency (10.70%), Obstetrics and Gynecology, (9.90%), I.C.U. (8.80%), Burn center (7.80%), General surgery (6.80%), Orthopedics and Neurosurgery (5.90%), Operation theaters (3.70%), Laboratory, and Pharmacy (2.90%), Children (2.10%) and Outpatient clinics (1.90%). The highest volume of the hazardous waste that was generated from the Burn center (24%) and the least volume of the hazardous waste was generated from Children's department (2.4%), Outpatient clinics, and Pharmacy (2.4%) each. Al-Thawra Hospital: The average number of inpatients which is 813 and the number of beds was 882. The percentage of the total solid waste in each department of the hospital in decreasing order were as the following: Renal center (16%), Obstetrics and Gynecology (10.60%), Operation theatres and I.C.U., (10.40%), Internal medicine (7.80%), Burn center (7.80%), Emergency and Emergency care (7.60%), Cardiology and Cardio care center and blood vessels (6.00%), Orthopaedics and Joints (5.20%), Outpatient clinics (4.80%), Urology (4.40%), Neurosurgery (3.40%), and Premature children and newborns (2.50%). The highest volume of the hazardous waste that was generated from the Operation theaters and I.C.U. (22.4%), and Obstetrics and Gynecology (22.4%). The least volume of the hazardous waste was generated from the Psychiatric department (0.60%), and Nuclear medicine center (0.60%). The waste generation rate of each department and hospital was different, the difference was because of the characteristics of each department which each department requires a different type of diagnosis and treatment. Some diagnosis and treatment methods produce more waste than others. Conclusion : The average of the total waste generated in the studied hospitals was 2.5 kg/bed/day. The major portion of the waste was the general (non- hazardous) waste (74%) while hazardous waste was (26%). The composition analysis of the general waste indicated that the foods, plastic, and paper/cartoon have the highest content of the general waste. Acknowledgements: The authors would like to express thanks to the hospitals' managers for their assistance. The authors would also like to acknowledge the valuable comments and contributions received from En. Ali Al-Dobhani, Deputy Director of the detoxification unit in the General Authority for Environmental Protection. REFERENCES Abd EL-Salam, MM (2010). Hospital waste management in EL-Beheira Governorate, Egypt. Journal of environmental management. 91 (3): 618 - 629. Alhumoud, JM; Alhumoud, HM (2007). An analysis of trends related to hospital solid wastes management in Kuwait. Management of environmental quality international journal. 18 (5): 502 - 513. Altin, SAA; Cerit, BEO (2003). Determination of hospital waste composition and disposal methods: a case study. Polish journal of environmental studies. 12 (2): 251 - 255. Bdour, A; Altrabsheh, B; Hadadin, N; Al-Shareif, M (2007). Assessment of medical wastes management practice: A case study of the northern part of Jordan. Waste management. 27 (6): 746 - 759.
- 4. etermination of medical waste composition in hospitals of Sana'a city, Yemen 346 GAWAD M. A. ALWABR 1 * , AHMED S. AL-MIKHLAFI 2 , SAIF A. AL-HAKIMI 2 , MUNIRA A. DUGHISH 3 Bendjoudi, Z; Taleb, F; Abdelmalek, F; Addou, A (2009). Healthcare waste management in Algeria and Mostaganem department. Waste management. 29 (4): 1383 - 1387. Biswas, A; Amanullah, ASM; Santra, SC (2011). Medical waste management in the tertiary hospitals of Bangladesh: An empirical enquiry. ASA university review. 5 (2): 149 - 158. Cheng, YW; Sung, FC; Yang, Y; Lo, YH; Chung, YT; Li, KC (2009). Medical waste production at hospitals and associated factors. Waste management. 29 (1): 440 - 444. Dehghani, MH; Azam, K; Changani, F; Fard, ED (2008). Assessment of medical waste management in educational hospitals of Tehran university medical sciences. Iran J. environ. health. sci. eng. 5 (2): 131 - 136. Dwivedi, AK; Pandey, S; Shashi (2009). Fate of hospital waste in India. Biology and medicine. 1 (3): 25 - 32. Hassan, MM; Ahmed, SA; Rahman, KA; Biswas, TK (2008). Pattern of medical waste management: existing scenario in Dhaka city, Bangladesh. BioMed. central public health. 8 (36): 1 - 10. Kagonji, IS; Manyele, SV (2011). Analysis of the measured medical waste generation rate in Tanzanian district hospitals using statistical methods. African journal of environmental science and technology. 5 (10): 815 - 833. Majumder, AK; Khanal, SN; Chaudhary, G; Bhochhibhoya, S; Yadav, SK; Vaidya, A; Wenju, R (2007). Characterization, quantification, and management situation of medical waste in Nepal. Kalmar ECO-TECH ´07. Kalmar, Sweden: November 26 - 28, 2007. Mesdaghinia, A; Naddafi, K; Mahvi, AH; Saeedi, R (2009). Waste management in primary healthcare centres in Iran. Waste manage. res. 27 (4): 354 - 361. Mohee, R (2005). Medical wastes characterisation in healthcare institutions in Mauritius. Waste management. 25 (6): 575 - 581. Nemathaga, F; Maringa, S; Chimuka, L (2008). Hospital solid waste management practices in Limpopo province, South Africa: A case study of two hospitals. Waste management. 28 (7): 1236 - 1245. Pandit, NA; Tabish, SA; Qadri, GJ; Ajaz, M (2007). Biomedical waste management in a large teaching hospital. JK-Practitioner. 14 (1): 57 - 59. Patil, GV; Pokhrel, K (2005). Biomedical solid waste management in an Indian hospital: A case study. Waste management. 25 (6): 592 - 599. Pruss, A; Giroult, E; Rushbrook, P (2013). Safe management of wastes from healthcare activities. Second edition. WHO Geneva. Razzak, NRB; Chowdhury, S; Chowdhury, F (2014). A study on health care waste management in some selected hospitals of Dhaka city. Journal of applied science and research. 2 (1): 161 - 168. Ruoyan, G; Lingzhong, X; Huijuan, L; Chengchao, Z; Jiangjiang, H; Yoshihisa, S; Wei, T; Chushi, K (2010). Investigation of health care waste management in Binzhou district, China. Waste management. 30 (2): 246 - 250. Sawalem, M; Selic, E; Herbell, JD (2009). Hospital waste management in Libya: A case study. Waste management. 29 (4): 1370 - 1375. Taghipour, H; Mosaferi, M (2009). Characterization of medical waste from hospitals in Tabriz, Iran. Journal of science of the total environment. 407 (5): 1527 - 1535. Table 1. The daily average of the generated waste in the studied hospitals. Hospital's name No. of beds Average No. of inpatients Average of the general waste/ kg/day Average of the hazardous waste/ kg/day Average of the total medical waste/kg/day Military hospital 602 435 1091 364 1455 Al-Kuwait hospital 268 232 425 212 637 Republic hospital 450 326 815 208 1023 Al-Thawra hospital 882 813 1830 670 2500 An average of the total amount in all the studied hospitals/ day. 2202 1806 4161 1454 5615
- 5. etermination of medical waste composition in hospitals of Sana'a city, Yemen 347 GAWAD M. A. ALWABR 1 * , AHMED S. AL-MIKHLAFI 2 , SAIF A. AL-HAKIMI 2 , MUNIRA A. DUGHISH 3 Table 2. The percentages of the general waste composition in the different countries. Country name Glass % Plastic % Papers & cartoon% Metals % Foods% Others% References Kuwait 5 24 31 --- 26 14 (Alhumoud JM, Alhumoud HM, 2007) Iran 4 23 13 1 31 28 (Taghipour and Mosaferi, 2009) Libya 8 24 20 1 38 9 (Sawalem et al., 2009) Mauritius island 3.5 22 25 --- 14 35.5 (Mohee, 2005) Turkey 7 41 21 1 17 13 (Altin and Cerit, 2003) Yemen 11 22 22 10 27 8 The present study Fig. 1: The percentage rate of the hazardous, and general waste in each hospital. Fig. 2: The percentage rate of the composition of the general waste in the hospitals.