1. Forecasting Global Silicone Demand
Current State
Goals
Dow Corning is a leading manufacturer of silicone products.
Silicone, a highly versatile element, is used widely across
many industries including aviation, personal care products,
and electronics.
Stepwise Regression
Principle Component Analysis
Quarterly Adjustment
Outlined below is an overview and outcome of each of the methods used in
creating the forecasting model.
Lasso Regression
Model Validation
Regression Equation
Quarterly Adjustment Factors
Dow Corning has tasked this team with developing a model to
forecast global silicone demand.
Dow Corning Data Set (Y)
Oxford Economics Data Set (X’s)
Dow Corning provided the team with 2 data sets to use in
creating the forecasting model. Both data sets were partitioned
into a training set, used to create the forecasting model, and a
validation set reserved to test model accuracy. Both data sets
were also normalized to adjust for differences in orders of
magnitude.
After carefully analyzing the industrial indicators from Oxford
Economics and the GDP’s of major industrial countries, the
team finalized a forecasting model for global silicone demand.
Using the regression equation as a base forecast, the
outputted values were also given a quarterly adjustment.
Historic end market applications of silicone are distributed
across 5 major categories that support the industry specific
factors in the regression equation.
• Ensures model adequately reflects historic patterns in quarterly demands
• Calculated quarterly adjustment factors based on average variance of a
given quarter from the weighted average of annual demand.
The many uses and applications of silicone make sizing the
overall demand particularly challenging.
However, the ability to accurately forecast demand can better
enable strategic decisions with regards to production
planning, contract negotiations, and product pricing.
0.8
0.9
1
1.1
1.2
1.3
1.4
1.5
Q1 Q2 Q3 Q4 Q1 Q2 Q3 Q4 Q1 Q2 Q3 Q4 Q1 Q2 Q3 Q4 Q1 Q2 Q3 Q4 Q1 Q2 Q3 Q4
NormalizedDemand
Quarters since 2010
Forecasted Actual
• Systematically builds a regression model by adding or removing
indicator variables based on the t-statistics of their estimated coefficients
• Narrowed down the possible industrial indicators from 112 to 23
• 112 industrial indicators and GDP’s of major industrial
countries from Q1 2010 - Q4 2015
• Analyzed as possible indicator variables for forecasting
model
Evan Field, Kimberly Louie, Evan Tomita, Miki Patel
• Actual global silicone demand from Q1 2010 - Q4 2015
• Performs both variable selection and normalization to enhance prediction
accuracy and interpretability of a statistical model
• Further narrowed down possible indicators from 23 to 11
• Provides insight on the amount of variability within the data that can be
explained by a model with 1, 2, …, x indicators
• Indicated a model with 97% variability accounted for could be created with
5 indicator variables
• Verified the accuracy of the forecasted demand using actual demand from
the validation data set
• The model forecasts within 1.4% error
0.8
1
1.2
1.4
1.6
1.8
2
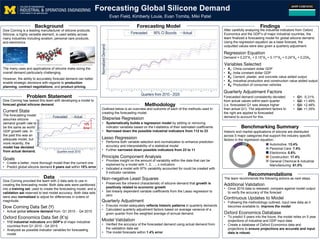
Q1 Q2 Q3 Q4 Q1 Q2 Q3 Q4 Q1 Q2 Q3 Q4 Q1 Q2 Q3 Q4 Q1 Q2 Q3 Q4 Q1 Q2 Q3 Q4 Q1 Q2 Q3 Q4 Q1 Q2 Q3 Q4 Q1 Q2 Q3 Q4 Q1 Q2 Q3 Q4 Q1 Q2 Q3 Q4
NormalizedDemand
Quarters from 2010 - 2020
Forecasted 95% CI Bounds Actual
Siloxane forms the basic building block of many silicone products. Silicones are often used as sealants for automobiles.
Additional Validation
Oxford Economics Database
• Create a better, more thorough model than the current one
• Predict global silicone demand 5 years out within 10% error
• Following the methodology outlined, input new data as it
becomes available to. improve the model
Continuous Updates to Model
Demand = 0.23*X1 + 0.15*X2 + 0.17*X3 + 0.24*X4 + 0.23X5
Variables Selected
• Once 2016 data is released, compare against model output
to verify the accuracy of the forecast
Forecasted demand consistently deviated
from actual values within each quarter
(i.e. forecasted Q1 was always higher
than actual Q1). The adjustment factors to
the right are applied to forecasted
demand to account for this.
• X1: China constant dollar GDP
• X2: India constant dollar GDP
• X3: Cement, plaster, and concrete value added output
• X4: Industrial production and construction value added output
• X5: Production of consumer vehicles
2010 2011 2012 2013 2014 2015 2016 2017 2018 2019 2020
• To predict 5 years into the future, the model relies on 5 year
projections of industrial and GDP input data
• Create a database of Oxford Economics data and
projections to ensure projections are accurate and input
data is robust.
• Q1: -5.31%
• Q2: +1.49%
• Q3: +2.48%
• Q4: +1.35%
Non-negative Least Squares
Automotive: 13.4%
Personal Care: 7.4%
Electronics: 0.8%
Construction: 17.4%
General Chemical & Industrial
Manufacturing: 61.0%
• Preserves the inherent characteristic of silicone demand that growth is
positively related to economic growth
• Set linearly dependent variable coefficients from the Lasso regression to
zero
The team recommends the following actions as next steps.
The forecasting model
assumes silicone
demand growth rate to
be the same as world
GDP growth rate. In
the past this was an
adequate model, but
more recently, the
model has deviated
from actual demand.
15%
Error
2010 2011 2012 2013 2014 2015
FindingsBackground
Data
Problem Statement
Benchmarking Summary
Recommendations
Forecasting Model
Methodology
Silicones have many applications in healthcare.