1. Neurophysiological Profile of Gains and Loss in a Gambling Task
Methods
Participants: 27 patients in treatment for depression and/or
anxiety problems.
Brain Measurement: 64 Channel EEG electrodes
EEG measure using average ERP components
1) P300
2) Feedback-Related Negativity (FRN)
Time-frequency decomposition
1) Theta (3-9 Hz)
2) Delta (0-3 Hz)
Task: Gambling task with forced choice and feedback
(Gehring)
· Participant has unlimited time to respond
· Feedback presented 1000ms after choice
· Alternated between red and green representing either loss
or gain
Abstract
In patients in treatment for psychological problems, we
examined EEG brain responses in a reward responsivity
measure called the gambling task. The task involved a choice
between two monetary amounts and then provides feedback
to indicate gain or loss of that amount. In addition to time-
locked event-related potentials, we also examined time-
frequency principal components to better identify underlying
brain processes. We looked closely at the P300 which is the
3rd positive wave following stimulus presentation, and has
been shown to be greater following novel or unexpected
stimuli. We also examined the feedback-related negativity
(FRN) component, which is a negative deflection on loss
trials after receiving feedback. Time-frequency analysis
identified two components in the theta (3-7 hz) and delta
(0-3hz) range, and were the underlying components of the
FRN and P300, respectively. Theta was larger on loss trials
and delta larger on gain trials, suggesting these two brain
measures index loss and reward sensitivity, respectively. The
delta component was also smaller among those in
psychological treatment suggesting neurological deficits in
the processing of reward and loss information among this
population.
Results
● Theta was sensitive to loss
● Delta was increased to gains
● Paradigm provides an objective
neurological measure of reward and loss
sensitivity
● Gambling task elicited an FRN and P300
with underlying theta and delta
components
Alternatives Choice Feedback
Conclusions
• Successful replication of Bernat et al. 2011
in a patient sample.
• Provide tool to measure and understand
neurological mechanisms of reward vs.
punishment sensitivity
• Provides a paradigm to study the
neurobiology of psychological disorders
characterized by low reward reactivity
(major depression) or high reward
sensitivity and low punishment sensitivity
(substance abuse).
Fig 1. During the task an image was flashed while the participant was making the
decision, the photos were either pleasant, unpleasant, or neutral.
Eva Kool, Sally Plank, Kristin Mannella, Matthew Bachman, Brad Schmidt, Brian Hicks,
Edward Bernat
Department of Psychiatry, Rachel UpJohn Center, East Medical Campus
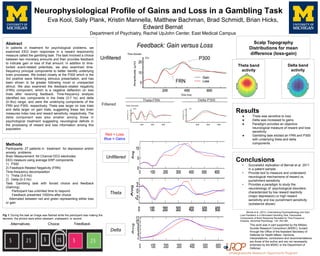
Unfiltered
Delta
Theta
Red = Loss
Blue = Gains
Theta band
activity
Delta band
activity
Scalp Topography
Distributions for mean
difference (loss-gain)
This work was in part supported by the Military
Suicide Research Consortium (MSRC), funded
through the Office of the Assistant Secretary of
Defense for Health Affairs. Opinions,
interpretations, conclusions and recommendations
are those of the author and are not necessarily
endorsed by the MSRC or the Department of
Defense.
lowest and highest quartiles of the distribution of scores on an
abbreviated version of the Externalizing Spectrum Inventory
(ESI; see below) were oversampled in the selection process to
enhance the representation of individuals extreme (low and
high) in externalizing proneness. Of the 149 participants com-
prising the final sample, 57 scored as high and 40 scored as low,
Measures
Participants completed a 100-item version of the ESI, a self-
report measure that was developed to assess a broad range of
behavioral and personality characteristics associated with external-
izing psychopathology (Krueger et al., 2007). The 100-item ver-
Theta-FRN Delta-P300
Time Domain
Feedback: Gain versus Loss
Time-Frequency PC: Loss-Gain Difference
Filtered
Unfiltered
Time Domain
Loss
Gain
P300
FrequencyHz
0
10
20
Amplitude(µV)
Time (ms)
200 400 600 200 400 600
200 400 600
FrequencyHz
Amplitude(µV)
Amplitude(µV)
FCz
FRN
5
0
5
0
0
4
-4
10
20
0
TF-PC Difference
-
+
0
CzFCz
Figure 2. Time-domain and time-frequency (TF) representations of feedback-related negativity (FRN) and
P300 differences for loss versus gain trials. Top: Line plot. Average response-locked event-related potential
(ERP) waveforms at FCz, depicting the expected negativity for loss versus gain trials associated with the FRN
as well as the time-domain P300. Second row: Waveform plots. Average time-domain ERP activity for loss and
gain trials separately, frequency-filtered to capture activity in the theta (3–9 Hz) range corresponding to FRN
response (left: FCz) and activity in the delta (3 Hz) range corresponding to the P300 response (right: Cz). These
plots demonstrate that theta and delta show opposing effects for loss compared with gain feedback such that theta
is stronger for loss versus gain, whereas delta is stronger for gain versus loss. Third row: Color surface plots.
Loss–gain difference scores for the principal component loadings on theta-FRN (left map) and delta-P300 (right
map), derived from a TF decomposition of average EEG activity following loss and gain trials. Bottom:
Topographical maps. Scalp topography distributions for the mean condition difference (loss–gain) of TF–
principal components analysis (TF-PCA) loadings for theta-FRN (left map) and delta-P300 (right map). Similar
to the time-domain FRN and P300, electrodes FCz and Cz, respectively, were most proximal topographically to
the maximum theta and delta gain–loss differences. However, compared with the highly correlated time-domain
FRN and P300, the gain–loss difference scores for theta and delta were uncorrelated. The implication is that these
theta and delta TF measures index separate processes that differentiate between loss and gain feedback outcomes.
355EXTERNALIZING PRONENESS AND FEEDBACK PROCESSING
ThisdocumentiscopyrightedbytheAmericanPsychologicalAssociationoroneofitsalliedpublishers.
Thisarticleisintendedsolelyforthepersonaluseoftheindividualuserandisnottobedisseminatedbroadly.
Bernat et al. (2011). Externalizing Psychopathology and Gain-
Loss Feedback in a Stimulated Gambling Task: Dissociable
Components of Brain Response Revealed by Time-Frequency
Analysis. Abnormal Psychology, 120, 352-364.