1. Control of Hybrid Ship Drive Systems
Hugo Grimmelius, Delft University of Technology, Delft/The Netherlands,
h.t.grimmelius@tudelft.nl
Peter de Vos, Delft University of Technology, Delft/The Netherlands, p.devos@tudelft.nl
Moritz Krijgsman, Alewijnse Marine Technology, Nijmegen/The Netherlands,
b.krijgsman@alewijnse.nl
Erik van Deursen, Alewijnse Marine Technology, Nijmegen/The Netherlands,
e.w.vandeursen@student.tudelft.nl
Abstract
Stricter regulations on emissions force ship owners and designers to come up with new solutions for
ship propulsion systems. Hybrid drive systems consisting of prime movers and batteries, like in the
Toyota Prius, show great potential, especially in special ships like harbour tugs. Economic and
environmental performance of such systems strongly depends on the way it is controlled. Dynamic
computer models of system components were built to compare different system lay-outs and different
control strategies and thus support the ship system designer with design decisions. A combination of
fuzzy rule-based and optimization-algorithm control offer the best results. The modeling method, the
different simulations, the optimization methods and resulting consequences for the ship system design
are the main topics of this paper.
1. Introduction
Concerns about the sustainability of the currently used, fossil fuel dependent power systems (in ships)
drive authorities to enforce stricter regulations on emissions. These stricter regulations force ship
owners, and thus ship designers, to re-evaluate their designs of ship propulsion and powering systems.
In the car industry this issue is addressed in different ways by different car producers, but one of the
possibilities that has been realized is application of hybrid drive systems, e.g. Toyota Prius.
Thus the question can be raised whether or not it is sensible, from an economic as well as an
environmental perspective, to apply this type of technology in ships as well. This depends mostly on
the operational profile of the ship. It is argued that ships with a power demand that consists of
significant, short-term peaks or long periods of very low load benefit the most of hybrid system
technology. Examples of ship types that satisfy this description are yachts, dredgers, tugs, offshore
support vessels, cruise ships and other complex specials. The reason why, and what design choices
need to be made in hybrid system design for ships is explained in the section on hybrid system design
and application.
Note that in this paper systems that contain one or more prime movers (e.g. diesel engines) and
devices that can store a significant amount of energy (e.g. batteries) are considered hybrid (drive)
systems. This definition of hybrid system is in contrast to for instance a ship that is equipped with
power kites, which would also be referred to as utilizing a hybrid (propulsion) system.
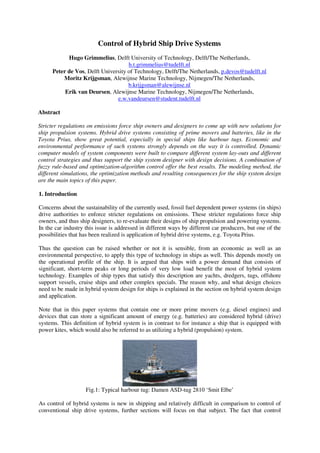
Fig.1: Typical harbour tug: Damen ASD-tug 2810 ‘Smit Elbe’
As control of hybrid systems is new in shipping and relatively difficult in comparison to control of
conventional ship drive systems, further sections will focus on that subject. The fact that control
2. requires more attention in ship system design calls for a new mind-set of marine system designers.
The control strategy contains “switching points” that have a large impact on the fuel efficiency of a
hybrid system. A proposition is made in this paper for optimal control, i.e. resulting in the best fuel
efficiency, of a hybrid system consisting of diesel engines and batteries.
2. Hybrid system design and application
Marine diesel engines normally operate most efficiently at 70 – 85% nominal load. This is the reason
an Engine Margin (EM) is chosen that distinguishes between Continuous Service Rating (CSR) and
Maximum Continuous Rating (MCR) of an engine when it is matched to a propeller in merchant ship
design. This method works very well for typical freighters that operate at design speed for the
majority of their lifetime. In their case it makes sense to speak of typical service conditions, to which
the engine and propeller can be tuned. But for other, more complex ships it is usually harder to define
typical service conditions or at least a distinction is made between different operational modes during
service. Each mode sets different requirements to the power system of the ship but the total installed
power during complex special design is usually dictated by the operational mode with the highest
power requirement. This leads to frequent part load operation of the engines when the ship is
operating in another mode than high-power mode. It is mainly in these cases that hybrid technology
offer significant opportunities to reduce fuel consumption and emissions.
A good example is the operational profile of a typical harbour tug, which contains three operational
modes; moored at quay, transit and assist. All three modes occur frequently but typically the high-
power mode (assist) occurs only for very short durations, yet it dictates the total installed power as the
required bollard pull is the most important aspect of tug design. In Fig. 2 the difference in operational
profile between a typical freighter and a tug is shown qualitatively. The propulsion power of a
freighter is almost constant as it is sailing at a certain speed (design speed) for most of the time. The
electric power demand is much smaller than the propulsion power and is therefore generated by
separate generator sets or by power take-off. In case of the harbour tug the propulsion power varies
and depends on the operating mode. A typical job is shown in the figure, starting with the tug being
moored at the quay. During transit relatively little power is needed for propulsion as the tug is free
sailing and usually is not in much of a hurry. During stand-by the tug is waiting for the ship to be
assisted to enter the harbour and propulsion power is almost zero, i.e. very low load for propulsion
engines. During assist temporarily a large amount of propulsion power is required to manoeuvre the
assisted (larger) ship. Then the tug returns to its mooring place. Electric power regularly is in the
same order of magnitude as propulsion power, which could be a reason to consider an all electric
power system to obtain the usually associated benefits of all electric ships.
Fig.2: Qualitative comparison of operational profile of typical freighter (left) and harbour tug (right)
Especially in case of a harbour tug hybrid technology is very interesting as load levelling (peak
shaving and dip filling) becomes possible. Peak shaving would then occur during assist; part of the
required propulsion power would come from the battery, the other part from the engines. Dip filling
could be used to increase the load of the engine during stand-by, when the load of the engines is very
3. low and thus the specific fuel consumption very high. This would mean the engine is better loaded
and possible fouling does not occur. The extra power that is produced is stored in the battery, from
which it is later extracted during assist or transit (or for auxiliary load).
The possibility of load levelling with hybrid systems results in an extra degree of freedom in system
design, namely the hybridization degree, Pede (2004), which was discussed in de Vos (2010). The
hybridization degree is the ratio between the installed power (maximum power of diesel engines) and
the maximum required power of the ship: in case of the harbour tug the sum of the propulsion power
during assist and auxiliary load. Because the battery can temporarily deliver power as well, it is no
longer necessary to install as much power as is required at maximum, meaning the total installed
engine power can be designed for average power instead of maximum power. Actually in hybrid
system design there is a large interdependency between the load profile, the lay-out of the hybrid
system, the control strategy and the size of the components (engines and batteries). Adjustment of one
should lead to adjustment of the others during system design. In this paper we discuss the control
strategy of a hybrid system, meaning that we should first know about the load profile, Fig. 2, but also
about the size of components of and lay-out of the hybrid system. This is discussed in the next
section.
3. Lay-out of engine room
First the lay-out of the current engine room on a typical harbour tug, Fig. 1, is presented in an Energy
Flow Diagram (EFD, Klein Woud (2002)) in Fig. 3.
Fig.3: Energy Flow Diagram (EFD) of typical harbour tug “Smit Elbe”
The electric power generation system is separate from the propulsion system, which consists of two
main engines (port and starboard), each mechanically driving a propeller through a gear. The main
engines each have a maximum power output of 1865 kW. The generator sets produce a maximum
power output of 105 kVA. As said the power of the main engines is determined by the set bollard pull
which is only needed during assist. From the operational profile of a tug, Fig. 2, it can easily be seen
that these engines will operate at part load the majority of the time.
Given the high, short-term peaks in power demand of a harbour tug a relatively low hybridization
degree, meaning a large dependency on batteries, can be anticipated. However, with that the lay-out
of the hybrid system is not yet known. The number of power generating units (diesel engines) and
how components are connected (series, parallel, all electric, geared) still has to be chosen. As we
focus on control strategy in this paper just one system configuration has been chosen (for now): the
parallel hybrid system. This system is applied both on port and on starboard. An EFD is shown in Fig.
4.
This system resembles the parallel hybrid system that is used in typical hybrid cars, but in cars there
is of course only one engine combined with one or more electric machines to drive the wheels. In the
hybrid system of Fig. 4 a main engine can drive both a propeller and an electric machine. If this is the
4. case the ship would be sailing at a certain speed while the battery is being charged and the electric
consumers are supplied with electric energy. In this situation both main engines could be running,
splitting the load of propellers, electric consumers and battery charge, or one engine provides all
power. When the tug is in ‘assist’ mode the propellers need maximum driving power; meaning that
both main engines will be running, all of their power is transmitted to the propellers. At the same time
the electric machines will act as motors and also provide power to the propellers. The electric
machine obtains its power from the battery. A ‘silent mode’ is also possible with this system: none of
the main engines are running and power needed for propulsion and electric consumers is provided by
the battery. This can of course only be done for a limited amount of time depending on the capacity
and initial state of charge of the battery.
Fig.4: Energy Flow Diagram (EFD) of parallel hybrid system for a harbour tug.
More options are available, giving more flexibility in the way propellers are driven than the
conventional system of the typical harbour tug, shown in Fig. 3. This flexibility in itself can be a
reason for applying hybrid technology, but in case the system is well controlled it can also reduce
overall fuel consumption, which of course makes it much more attractive. The energy management
system should be able to decide which driving option results in the best efficiency and automatically
switch to that mode. Of course this could best be done when upcoming events, or even the complete
sailing profile is known up front. However, as this is very hard to realise (prediction of the future), a
traditional feedback control system will have to be applied. Several options are available for feedback
control, so which is the best energy management strategy and how do we test that?
4. Modelling of tug and system control
This section describes the simulation environment that is used for developing and evaluating the
energy management strategy. Two different models are distinguished: (1) a ship model and (2) a
control model. The ship model is used to analyse the performance and validate the control actions of
the energy management strategy. It is a forward facing -or integrating model, i.e. a dynamic model.
The ship model simulates the behaviour of the real ship as close as possible and has a flexible
interface for connection of the control model. The control model simulates the energy management
strategy that has been designed. The energy management strategy determines the optimal power split
between the diesel engine and electric machine by means of optimization algorithm. The control
model needs drastic component model reduction to fit in the specific optimization structure of the
real-time implementation of the energy management strategy.
4.1. Ship model
The ship model accurately represents all relevant characteristics of a real ship and is used to evaluate
the energy management strategies and their influence on the sailing behaviour of the ship. The model
is based on the general ship modelling approach as applied by the marine engineering section at Delft
University of Technology of which an overview is shown in Fig. 5.
5. Propulsion
Control
System
ShipF Ship
Resistance
opPrFPropeller
Thrust
-+
Ship
translation
dynamics
1
m ∫
vA
1-w
÷
J
Disturbances
Disturbances
J
Propeller
Torque
opPrM
Propulsion
machine
ShaftM
+ -
Shaft
rotation
dynamics
1
2 Iπ ∫
ndem
θ
Pitch
Control
System
demθ
Command
Engine
Control
System
f
vS
n
n
n
n n
n
vS
ndem
vS
Fig.5: General ship propulsion model as presented in Grimmelius (2007)
The ship model is a forward facing -or integrating model, i.e. a dynamic model. The inputs for the
ship model are the speed settings for the diesel engine and electric machine and the pitch setting of
the thruster. The output amongst others is the resulting ship speed and propeller torque and thrust. As
said the model is based on the model as shown in Fig. 5, but some adjustments were necessary
because of the presence of the electric machine and battery. Also a more advanced ship manoeuvring
model has been developed for predicting the resistance. A schematic overview of the ship model is
shown in Fig. 6. The left part of this overview resembles one side (port or starboard) of the EFD of
the hybrid system shown in Fig. 4.
Control
System
shipF 2-D Ship
forces
PropFPropeller
Thrust
-+
Ship
dynamics
1
m ∫
Av
1-w÷
J
J
Propeller
Torque
PropMDiesel
Engine
EngM
+ -
Shaft
rotation
dynamics
1
2 Iπ ∫
Pitch
Control
demθ
Command
Governor
f
n
n
n n
n
sv
ndem
Electric
Machine
emM
( )Sv x,y,φ
+
Battery
System
batI
Electric
Consumers
-
auxI
Electric Control
θ
-
emI
U / s
n
emP
Fig.6: Schematic overview of ship model.
The model in Fig. 6 is driven by the control system sub-model. This includes the energy management
strategy and contains the control model as mentioned above. It will be discussed in more detail later
on.
The ship model also contains a model for the diesel engine and its governor. The diesel engine model
determines the engine torque from the engine speed and the amount of injected fuel; the model is
based on a five points Seiliger process. The governor model determines the amount of injected fuel on
basis of the difference in engine speed and engine speed set point, which is supplied by the control
model, Shi, (2010).
The electric machine sub-model can operate in motor mode condition and generator mode condition.
This model calculates the torque delivered or required by the electric machine, which is determined
from the difference of the rotor speed and the rotor speed set point, Trzynadlowski (1994).
The shaft rotation dynamics sub-model has three inputs: the torque delivered by the diesel engine and
6. electric machine and the torque required by the propeller. The required propeller torque will be
reduced by the gearbox and is compared with the combined torque of the diesel engine and electric
machine. The difference between the combined torque and the required torque of the propeller results
in the rotational speed of the propeller shaft according to Newton’s second law of rotational motion.
The propeller sub-model calculates the required torque and resulting thrust of the propeller on basis of
the pitch setting, the shaft speed and the ship speed, Shi (2010).
The ship dynamics sub-model shows some resemblance to the rotational dynamics sub-model.
However in this model three degrees of freedom are considered instead of only one. The input for
ship dynamics sub-model is the thrust delivered by the propeller and the forces resulting from the
movement of the ship (including rudders). The net forces and moments give the ship movements
using Newton’s equations of motions.
In the 2D ship manoeuvring model, which is based on the model of Inoue (1981) the ship resistance is
calculated as a function of speed and rudder angle. The ship resistance is a summation of the hull
forces and the resistance produced by the thrusters.
The battery system sub-model calculates the State of Charge (SoC) and operational voltage of the
battery as function of the supplied or received current, van der Nat (1999); de Vos (2010).
The electric consumers sub-model dictates the amount of electric energy as required by the electric
consumers on board the tug; this is the auxiliary load.
4.2. Control model
The control model determines the optimal power split between the diesel engine and the electric
machine. This is achieved by making use of a optimization routine which minimizes a cost function
of the hybrid drive train. The cost function used in the control model contains only relevant
components of the hybrid drive train which have a large influence on the energy management
strategy, i.e. the diesel engine, electric machine and battery. These components are already modelled
in the ship model above, but these sub-models need drastic model reduction in order to fit into a
certain optimization structure. The choice of a optimization routine in control engineering depends on
different objectives: (1) the behaviour of the relevant models and (2) if a real time implementation of
the controller is required, which of course is the case in for a practical application like a hybrid tug.
The diesel engine fuel map can be approximated by a linear relation: Fig. 7.
0 5 10 15 20 25 30 35 40 45 50
0
10
20
30
40
50
60
70
80
90
100
Engine power [% of nominal]
Chempower[%ofnominal]
180 RPM
720 RPM
1440 RPM
1800 RPM
Fig.7: Chemical power Pf as function of engine power Peng
The linear relation between delivered power and fuel consumption of the diesel engine is an important
observation with regard to the energy management strategy. Similar characteristics as for the diesel
7. engine can be found for the electric machine and battery. Both components can be approximated with
a linear relation. The relation between the electric power and mechanical power of the electric
machine in motor and generator condition and the battery characteristic are both shown in Fig. 8.
600
600
1000
1000
1000
1000
1400
1400
1400
1400
1700
1700
1700
1700
Power input [% of nominal]
Poweroutput[%ofnominal]
-100 -80 -60 -40 -20 0 20 40 60 80 100
-100
-80
-60
-40
-20
0
20
40
60
80
100
EM speed
-100 -80 -60 -40 -20 0 20 40 60 80 100
-100
-80
-60
-40
-20
0
20
40
60
80
100
Power at connectors [% of nominal]
Internalpower[%ofnominal]
SoC = 10%
SoC = 40%
SoC = 70%
SoC = 100%
Fig.8: Electric machine input-output power relation (left); battery characteristic (right)
Because of the linear behaviour of the relevant drive train components the logical outcome is to
search for a optimization routine with a linear structure. The routine that suits those requirements is
the Linear Programming (LP) routine, Hillier (2009). The Linear Programming is a collective of
several linear optimization routines. The routine that yields good results concerning linear problems is
the so called ‘Simplex’ method. The main advantage of the Simplex method is that it requires little
computational power of a CPU, which is preferred because real time implementation is required. The
main challenge is to fit the above described models into the Linear Programming structure. The
easiest way to perform a linearization within the Matlab/Simulink environment is by means of look-
up tables.
The input for the optimization routine is the power needed for the drive train (Pd), the power needed
for the auxiliary load (Paux) and the efficiencies of the diesel engine, electric machine and battery,
depending on the operational point. The output of the optimization routine is the optimal internal
battery power, which is constrained by the maximum power output of the diesel engine, electric
machine and battery. Knowing the optimal internal battery power in terms of fuel cost the power split
between the diesel engine and electric machine can be calculated mathematically. This procedure is
calculated in sub-block ‘Power split’. The schematic overview of the control model is given in Fig. 9.
Fig.9: Schematic overview of control model
5. Control of hybrid system
The previous section laid the groundwork for the design of the energy management system. The
mathematical models that are used for modelling the hybrid drive train show some important
characteristics towards the energy management system. The goal of the energy management system is
to find the optimal efficiency point of the complete hybrid drive train in terms of fuel cost. It can
8. happen that separate drive train components do not run in there optimal efficiency point but that the
overall efficiency of the drive train is optimal. This can be achieved by constantly controlling the
amount of power supplied by the diesel engine and the battery. The two power sources should always
deliver at least as much power as is currently demanded.
Power delivery in the hybrid system starts with fuel that is injected in the diesel engine. The resulting
mechanical power Peng splits up into two directions: one part Pd goes to the drive train for ship
propulsion, while the other part Pem goes to the electric machine. The electric machine provides
electric power Pe for electric consumers (auxiliary load) Phl but also takes care of charging the battery
Pb. Contrary to the auxiliary load, the power flow to the other components can be positive or negative.
A change in sign equals a change in direction of power. In the end, all power, except for losses, is
used for ship propulsion or for electric consumers connected to the electric network. The lay-out of
the hybrid system model is shown in Fig. 10.
Fig.10: Parallel hybrid system model
Selecting the optimal strategy that results in the best overall efficiency has a lot of challenges. The
difficulty lies in the fact that optimal solution has to be found in real time, so there is limited
calculation time to find the optimal solution. The next difficulty is that the exact power demand
during the next time step is not known in advance. Because of the lack of knowledge about the
upcoming power demand, the energy management strategy has to react on the real time power
demand and has also to anticipate what will happen during the next time step. A proven concept in the
automotive industry to deal with this complex problem is to derive a mathematical formulation of the
complete drive train and to construct a cost function from it. The cost function in combination with a
optimization routine is referred to as Equivalent Cost Minimization Strategy (ECMS), Guzzella
(2005).
5.1. Objective function
The shape of the objective has a big influence on the results of the optimization problem. The
minimum will be more difficult to find when the objective function has a non-convex character.
Another difficulty with a non-convex function is that it can have multiple local minima, so the result
of the optimization problem cannot be guaranteed to be the global minimum. The general idea behind
the ECMS is that all energy that will be drawn from the batteries in the future has to be compensated
by energy that is stored back in the batteries. This can be done using recuperated energy obtained
from ‘wind milling’ or using excessive energy from the diesel engine and use the electric machine in
generator mode to charge the batteries. Charging the batteries will result in extra fuel cost and power
supplied by the batteries can be expressed in terms of ‘equivalent fuel cost’. ECMS considers the
energy drawn from the batteries not as costless energy but eventually it will cost some fuel in the
future and vice versa, storing energy right now will save fuel in the future. Implementation of the
extra fuel cost or saving into the objective function will be achieved by adding an extra penalty for
the use of the battery power. The objective function when the electric machine operates in motor
condition is as follow:
9. eng
f
eng
P
P
η
= (1)
0eng d em eng d emP P P P P P− + = → = − (2)
Substitute Eq. (2) into Eq. (1):
d em
f
eng
P P
P
η
−
= (3)
Adding the penalty function for the use of the battery results in the following objective function:
d em
f s
eng
P P
P Pλ
η
−
= + (4)
0e b aux e b auxP P P P P P− + − = → = − (5)
The relation between the internal power and power measured at the connectors of the battery is
defined as follow:
b s batP Pη= (6)
Substitute Eq. (6) into Eq. (5):
e s bat auxP P Pη= − (7)
The relation between the mechanical- and electrical power of the electric machine is defined as
follow:
em
e em em e
em
P
P P Pη
η
= → = (8)
Therefore:
( )em
s bat aux em s bat aux em
em
P
P P P P Pη η η
η
= − → = − (9)
Substitute Eq. (9) into the Eq. (4):
( )
min
min
d em s bat aux
f s
eng
d em bat s em aux
f s
eng
P P P
P P
P P P
P P
η η
λ
η
η η η
λ
η
− −
= +
− +
= +
(10)
Eq. (10) needs to be rewritten to fit in the Linear Programming (LP) structure. LP is a collective of
different optimizations routines including the simplex method, a commonly used method for linear
optimization problems. The Simplex method has a specific structure regarding the objective function.
The formulation of the objective function in the specific Simplex structure is given by Eq. (11).
min
min em bat d em aux
f s
eng eng
Z cX
P P
P P
η η η
λ
η η
=
−
= − + +
(11)
The formulation of the objective function regards the operational point of the electric machine
operates in generator mode and the excessive power of the diesel engine is used for charging the
batteries.
eng
f
eng
P
P
η
= (12)
0eng d em eng d emP P P P P P− + = → = − (13)
Substitute Eq. (13) into Eq. (12):
d em
f
eng
P P
P
η
−
= (14)
Adding the penalty function for the use of the battery results in the following objective function:
10. d em
f s
eng
P P
P Pλ
η
−
= − (15)
0e b aux e b auxP P P P P P− − = → = + (16)
e
e em em em
em
P
P P Pη
η
= → = (17)
s
s b b b
bat
P
P P Pη
η
= → = (18)
min
s
aux
bat
d
em
f s
eng
P
P
P
P P
η
η
λ
η
+
+
= − (19)
Writing Eq. (19) in the specific LP structure:
min
1
min
1
min
d bat em s aux bat
f s
bat em eng
d bat em aux bat
f s
bat em eng bat em eng bat em eng
d aux
f s
bat em eng eng em eng
P P P
P P
P P
P P
P P
P P
η η η
λ
η η η
η η η
λ
η η η η η η η η η
λ
η η η η η η
+ +
= −
= − + +
= − + +
(20)
The optimal solution is found by comparing both solutions of the two defined objective functions and
selecting the one that yields the lowest solution, in other words the lowest fuel cost. Knowing the
solution that yields the lowest fuel cost, the power split of diesel engine and electric machine can be
determined mathematically. Since the optimization does not use any complicated operations the
optimization routine is computationally not very demanding and can easily be implemented in a real
time controller.
5.2. Constraints
The objective function is constrained in the actions it can take and has for this reason influence on the
solution of the objective function. This section covers four constraints in total: peak power of the
diesel engine, peak power of the electric machine, peak current of the battery during
charging/discharging and the battery state of charge. All the constraints have to be rewritten into
internal battery power Ps to corresponds with the above defined objective functions. The constraints
need to be formulated in a certain structure where the objective function is subjected to linear
constraints.
5.2.1 Diesel engine constraints
The diesel engine has physical limitations that constrain the actions the energy management can take.
The constraint for the diesel engine is defined by the maximum and minimum amount of power it can
produce:
_0 ≤ ≤eng eng maxP P (21)
The above constraint needs to be rewritten as a function of internal battery power so it suits LP
objective functions. The constraint for the engine peak power needs to be defined for two situations,
the first situation where the electric machine operates in motor condition and the second situation
11. where the electric machine operates in generator condition.
For the first situation the constraint is:
_ − +
≥
−
− +
≤
−
eng max d aux em
s_max
bat em
d aux em
s_min
bat em
P P P
P
P P
P
η
η η
η
η η
(22)
For the second situation the constraint is:
{ }_( )
( )
≤ − −
≥ − −
s_max eng max d em aux bat
s_min d em aux bat
P P P P
P P P
η η
η η
(23)
5.2.2 Electric machine constraints
The electric machine has a similar constraint on the peak power as the diesel engine. The constraint
for the electric machine is defined by a maximum and minimum amount of power it can produce:
_0 ≤ ≤em em maxP P (24)
For the first situation the constraint is:
_ +
≤
≤
em max aux em
s_max
bat em
aux em
s_min
bat em
P P
P
P
P
η
η η
η
η η
(25)
For the second situation the constraint is:
( )s_max em_max aux bat
s_min aux bat
P P P
P P
η
η
≥ −
≥ −
(26)
5.2.3 Battery constraints
The constraint for the battery is defined as a maximum discharge or charge current. To express the
maximum allowable current as function of internal battery power is more complicated as the two
previous defined constraints. The battery power measured at the connecters is a function of the
battery voltage and current. The relation can be defined by Ohms law:
bP UI= (27)
The maximum current during discharge condition is:
arg _ _≤disch e bat dis maxI I (28)
The maximum current during charge condition is:
arg _ _≤ch e bat charge maxI I (29)
The constraints for the charge - and discharge current is obtained from the technical specifications of
the battery manufacturer. The maximum allowable current as function of the internal battery power
can now be expressed as follows. For situation one:
12. _ _ ⋅
≤ bat, dis max bat
s
bat
I U
P
η
(30)
For the second situation the following constraint applies:
s bat,charge,max bat batP I U η≤ ⋅ (31)
5.2.4 Constraining SoC by controlling the equivalent weight factor λ
In the previous section all the constraints are defined concerning the different drive train components
except for the constraint to keep the state of charge (SoC) of the battery within certain limits. It is not
possible to define the SoC as function of the internal battery power. The strategy adopted here was
recommended by van Kessel (2007). It was applied as part of the control strategy for hybrid cars. The
schematic overview is shown in Fig. 11.
Fig.11: PI controller for approximation of λ.
A PI controller is introduced to keep track of the SoC by controlling the equivalent consumptions
weight factor λ. If the equivalent weight is too large the optimization will be too conservative,
resulting in low cycling over the batteries and too much use of the diesel engine. If the equivalent
weight factor is too small the optimization will use the battery too aggressively, resulting in too much
cycling over the battery, or even draining the battery fully. The influence of the equivalent cost factor
on the SoC of the battery can be used to check whether an optimal value for λ is found or not.
6. Results
The number of variations for this kind of systems is unlimited. To show some of the key features of
the system the preliminary results for two cases are presented: an artificial load case, Figs. 12 and 13,
and a real load case based on measurements, Figs. 14 and 15. The hybridization degree for both cases
is 64%, the battery has a rated capacity (100% to 0% SoC) equivalent to the energy needed to drive
the electric machine at the nominal power during 1.5 h. The optimization update period is set at 50 s.
13. 6.1 Artificial load
0 500 1000 1500 2000 2500 3000 3500 4000 4500 5000
-40
-20
0
20
40
60
80
100
time [s]
P[%ofnominal]
Pdemand
Pdelivered
Peng
Pem
SoC
Fig.12: Artificial load cycle: powers and SoC
0 500 1000 1500 2000 2500 3000 3500 4000 4500 5000
0
5
10
15
20
time [s]
penalty
lambda
Fig.13: Artificial load cycle: equivalent weight factor λ
The load in this case starts low (12%) then increases rapidly to 95% at 2000 s. After a period of high
power, power is reduced again and from 2800 s increases steadily. The battery is charged to 80% at
the start. The system opts for electric drive, until at 1900 s the demanded power exceeds the electric
machines capability and the engine is started. Because the battery is still well charged, λ remains low
and the electric machine keeps delivering (now maximum) power, assisting the engine to meet the
demanded power. The engine cuts out at 2800 s. At 3700 s the lower limit for SoC is reached and λ
increases rapidly. As a consequence, the engine takes over and the electric machine is used as a
generator to charge the battery. The available power for charging slowly decreases as the demanded
power increases. The equivalent weight factor λ stays relatively high because the reference SoC is not
reached yet.
The load sharing works fine, the only drawback with the chosen settings is the fact that in engine
assist mode the load variations are handled by the engine rather then by the electric machine.
6.2 Realistic load
This case is a typical assist job for a harbour tug. During this trip the ship is in transit (with some
manoeuvring between 900 s and 1500 s), Then the assist shows high power demands (3300 s – 4200
s), followed by another transit with the next assist starting around 7000 s. Here in two instances the
battery is drained (around 1000 s and 6000 s), leaving the engine to deliver all demanded power.
During the assist, both engine and electric machine are needed. During the (low power) transit
between 1500 s and 3200 s the battery is charged sufficient to reduce λ to zero again. During the
second transient this induces the system to select electric drive.
14. 0 1000 2000 3000 4000 5000 6000 7000
-40
-20
0
20
40
60
80
100
time [s]
P[%ofnominal]
Pdemand
Pdelivered
Peng
Pem
SoC
Fig.14: Real load case: powers and SoC.
0 1000 2000 3000 4000 5000 6000 7000
0
5
10
15
20
time [s]
penalty
lambda
Fig.15: Real load case: equivalent weight factor λ.
6.3 Discussion
Many parameters were not varied in the results shown here. These include the settings for the
λ controller, the associated SoC reference value, the limits of the SoC for the battery, the optimization
update period etcetera. Initial tests show a coherent and logical response to all key parameters,
opening the way for more detailed analysis.
7. Conclusion
A control method for hybrid ship drive systems has been presented in this paper. Preliminary results
show great potential for real time implementation for ships equipped with a hybrid diesel engines –
battery drive system. The influence of many of the parameters however still needs to be further
investigated. Further research and experimentation are underway and will have to prove the practical
applicability of this control system. A logical first extension of the approach is to include a
controllable pitch propeller, adding an extra dimension to the optimisation problem.
References
VOS, P. de; VERSLUIJS, E.; STAPERSMA, D.; BARENDRECHT, I. (2010), Application of
dynamic models during design of a hybrid diesel fuelled PEMFC system with fuel reformer, PRADS
2010, Rio de Janeiro.
GUZZELLA, L.; SCIARRETTA, A. (2005), Vehicle propulsion systems, Springer.
GRIMMELIUS, H.T.; MESBAHI, E.; SCHULTEN, P.J.M.; STAPERSMA D. (2007), The use of
Diesel engine simulation models in ship propulsion plant design and operation, CIMAC 2007,
15. Vienna.
HILLIER, F.S. (2009), Introduction to Operations Research, McGraw-Hill.
INOUE, S.; HIRANO, M.; KIJIMA, K. (1981), Hydrodynamic derivatives on ship manoeuvring,
International Shipbuilding Progress, Vol. 28.
KESSEL, J. van (2007), Energy management for Automotive Power Nets. PhD thesis, Technical
University of Eindhoven.
KLEIN WOUD, J.; STAPERSMA, D. (2003), Design of Propulsion and Electric Power
Generation Systems, IMarEST.
NAT, C.G.J.M. van der (1999), A knowledge-based Concept Exploration Model for Submarine
Design, PhD thesis, Delft University of Technology, Delft University Press
PEDE, G.; IACOBAZZI, A.; PASSERINI, S.; BOBBIO, A.; BOTTO, G. (2004): FC vehicle
hybridisation: an affordable solution for an energy-efficient FC powered drive train, Journal of
Power Sources 125(2).
SHI, W.; GRIMMELIUS, H.T.; STAPERSMA, D. (2010). Analysis of ship propulsion system
behaviour and the impact on fuel consumption, International Shipbuilding Progress, Vol. 57.
TRZYNADLOWSKI, A.M. (1994), The Field Orientation Principle in Control of Induction Motors,
Kluwer Academic Publishers.