
Recommended
Recommended
More Related Content
Similar to Accounts Receivables
Similar to Accounts Receivables (20)
Accounts Receivables
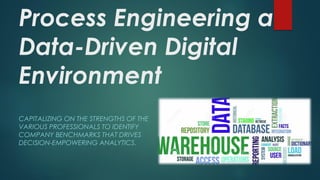
- 1. Process Engineering a Data-Driven Digital Environment CAPITALIZING ON THE STRENGTHS OF THE VARIOUS PROFESSIONALS TO IDENTIFY COMPANY BENCHMARKS THAT DRIVES DECISION-EMPOWERING ANALYTICS.
- 2. Why a Data-Driven Digital Environment? EFFICIENCY-DRIVEN TAILORED TO TEAMS EMPIRICALLY LEAD. 1. Know how each part effects another. 2. Cohesive & Distinct Data 1. Information readily available for any person to review. 3. High Level Reporting Potential Reporting Potential • Production & Marketing Opportunities Data Cohesion • Availability & Reliability Why it matters •No I in Team
- 3. Some Potentials to a Data-Driven Environment. • Field Performance Metrics • Tech Performance Metrics • CSR, SLA, & VPass Rankings • Billing trends by: • SQ FT • # of EQ • Days on Site • Category • Class • Etc • Identify due benchmarks • What those benchmarks are • Whom is responsible • How, if, and why something went wrong. MANAGEABLE ACCOUNTABILITY MARKETING POTENTIAL • Enhanced Communications • Internal Marketing to Insurance Teams • External Marketing to Insureds OPERATIONAL REPORTING
- 4. Accounts Receivables PHASE I OF THE DATA-DRIVEN DIGITAL ENVIRONMENT PROJECT. ADVOCATING THE BENEFITS OF A MORE INFORMED POSITION FOR DECISION-MAKERS. EASY EXCEL EXPORTS VIABLE W/ QBS CLICK-REPORTING IN CHRONICLE
- 5. Know where the money is. Current Action Reporting. • Comprehensive data graphics. • Transparent, At-A-Glance reporting perspectives. • Easily Identifying issue areas.
- 7. This will help identify: • Accounting errors (Credit Memos). • Department errors (Billed to wrong dept). • Or Administrative errors (Classing issues).
- 8. Catching up on Cash Reporting CHRONICLE’S CLICK-READY, REAL-TIME REPORTING.
- 9. Catching up on Cash Reporting As of building this file last Saturday the A/R stood at : $Private
- 10. Cash Flow Forecasting USE OF THE XA DATE IN ESTIMATICS SURVEY TO EXPORT A MORE DEFINED REPORT FOR DAILY CASH FORECASTING AND VARIANCE REPORTING. Estimatics Survey: • XA Date: (Important!) • Exception: Y/N • Exception Area: (EQ, Dmo, Labor, Chambers, etc) • Exception Cleared: Y/N • Exception Rehashed: Y/N • Exception C/M Cost: $xxx Click-Reporting Chronicle & Excel TiedtoCoreData XA Date DecisionPower Cash Flow Projections
- 11. How Accurate is Chronicle to QuickBooks? 5% Variance
- 12. How much work involved to get it working How do we get there? What steps to make this work Digital Dependence on Data Consolidated Processes How long to train on it
- 13. Let’s plan this out using Eric T’s extensive experience. After all, the more energies exhausted on collection is less time for potential for items to: • Fall in cracks • Get pushed aside • or become uncollectable. WHAT’S NEXT?
- 14. A/R •Increase collections and collection rates. Estimatics •Increase number of estimates written. Info from Field Increase Cash on Hand EFFICIENCY-DRIVEN, TEAM-ORIENTED ENVIRONMENT • Identify Field Benchmarks • Create Reporting Metrics • Streamline Processes & Responsibilities • Increase Estimatics Production to 20 a week per estimator. 1. Digitize Accounts Receivables. 2. Create Information Flows for the Field. 3. Optimize Estimatics Production. 4. Increase collection opportunities for A/R.
- 15. What about Restore 365? EVERYONE’S TALKING ABOUT IT . . . BUT WHAT IT IS, WE REALLY DON’T KNOW.
- 16. Questions?