1. Percent of Households Living Beneath Poverty Level
A field in the Census Bureau tract data was created to match the
TIGER Shapefiles for census tracts. The table was joined to the
shapefiles, exported to a geodatabase, and then reimported to
display attribute values. A field was added to display the number
of households below poverty level per total number of households.
The layer was converted to a raster based on this ratio, and then
normalized using raster calculator by dividing the raster by the
highest value, resulting in a scale from 0 to 1, where one reflects
the highest percent of households below poverty level.
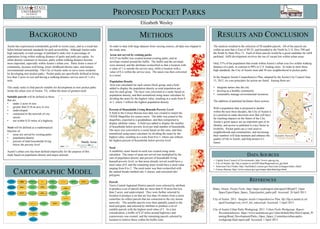
Need
A suitability raster based on need was created using raster
calculator. The raster of areas not served was multiplied by the
sum of population density and percent of households living
beneath poverty level, so that areas already served would have a
need value of 0, and the remaining areas would have a need value
ranging from 0 to 2. The need raster was then reclassified with
the natural breaks method into 5 classes, and converted into
polygons.
RESULTS AND CONCLUSION
Parcels
Travis Central Appraisal District parcels were selected by attribute
to produce a set of parcels that are more than 0.10 acres but less
than 2 acres, and undeveloped. They were further selected by
location to produce a set that are less than 10 meters from a street
centerline (to reflect parcels that are connected to the city streets
network). The suitable parcels were then spatially joined to the
need polygons, and selected by attribute to produce a set of
suitable parcels with the highest need value of 5. As a last
consideration, a buffer of 0.25 miles around highways and
expressways was created, and the remaining parcels selected by
location to remove those within the buffer zone.
Areas not served by existing parks
A 0.25 mi buffer was created around existing parks, and an
envelope created around the buffer. The buffer and the envelope
were unioned, and the attributes reclassified so that a location with
a value of 1 is outside the service area, while a location with a
value of 0 is within the service area. The union was then converted
to a raster.
Population Density
Area was calculated for each census block group, and a field
added to display the population density as total population per
area for each group. The layer was converted to a raster based on
population density, and then normalized using raster calculator by
dividing the raster by the highest value, resulting in a scale from 0
to 1, where 1 reflects the highest population density.
Elizabeth Wesley
PROPOSED POCKET PARKS
DATA SOURCES
Where would Batman live in Austin, Texas?
BACKGROUND
CARTOGRAPHIC MODEL
METHODS
Austin has experienced considerable growth in recent years, and as a result has
fallen behind national standards for park accessibility. Although Austin ranks
high nationally in total acreage of parkland it ranks low in percentage of
population living within walking distance of parks and parks per capita. As
urban density continues to increase, parks within walking distance become
more important, especially within Austin’s urban core. Parks foster a sense of
community, increase well being, lower childhood obesity rates, and nurture
environmental stewardship. The City of Austin seeks to serve more residents
by developing new pocket parks. Pocket parks are specifically defined as being
less than 2 acres in size and having a walking-distance service area of ¼ of a
mile.
This study seeks to find parcels suitable for development as new pocket parks
inside the urban core of Austin, TX, within the areas of greatest need.
• Capital Area Council of Governments, http://www.capcog.org
• City of Austin, ftp://ftp.ci.austin.tx.us/GIS-Data/Regional/coa_gis.html
• American Fact Finder, http://factfinder2.census.gov/faces/nav/jsf/pages/index.xhtml
• Census Bureau, http://www.census.gov/geo/maps-data/data/tiger.html
In order to deal with large datasets from varying sources, all data was clipped to
the study area.
REFERENCES
Blake, Alison. Pocket Parks. http://depts.washington.edu/open2100/pdf/2_Open
SpaceTypes/Open_Space_Types/pocket_parks.pdf. Accessed: 24 April 2013.
City of Austin. 2011. Imagine Austin Comprehensive Plan. ftp://ftp.ci.austin.tx.us/
npzd/Austingo/web_IACP_full_reduced.pdf. Accessed: 1 April 2013.
City of Austin Urban Parks Workgroup. 2011. Urban Parks Workgroup: Report
Recommendations. https://www.austintexas.gov//sites/default/files/files/Capital_Pl
anning/Bond_Development/Parks_Open_Space_Committee/urban-parks-
workgroup-final-report.pdf. Accessed: 1 April 2013.
Austin’s urban core has been defined empirically for the purpose of this
study based on population density and major arterials.
Suitable parcels will be defined as those
that are:
• under 2 acres in size
• greater than 0.10 an acre in size
• undeveloped
• connected to the network of city
streets
• not within 0.25 miles of a highway
Need will be defined as a mathematical
function of:
• areas not served by existing parks
• population density
• percent of total households living
below the poverty level
The analysis resulted in the selection of 50 suitable parcels. All of the parcels are
within an area that is East of IH-35, and bounded to the North by U.S. Hwy 290 and
the South by State Hwy 71. Each of these parcels would be a good candidate for infill
parkland. Infill development involves the use of vacant lots within urban areas.
Only 37% of the population that reside within Austin’s urban core live within walking
distance of a park, in contrast to 90% in U.S. leading cities. In order to meet these
high standards, the City of Austin must add 58 new neighborhood or pocket parks.
In the Imagine Austin Comprehensive Plan, adopted by the Austin City Council June
15, 2012, six core principles for action are listed. Among them are:
• integrate nature into the city
• develop as a healthy community
• sustainably manage environmental resources.
The addition of parkland facilitates these actions.
With a population that is projected to double
within the next three decades, the City of Austin is
in a position to make decisions now that will have
far reaching impacts on the future of the City.
Austin’s green spaces are an important part of its
identity, and access to parkland is a key factor in
livability. Pocket parks are a vital asset to
neighborhoods and communities, and increasing
their numbers will help maintain and enhance the
quality of life in Austin, and help protect it’s
future.