Breastfeeding & bariatric surgery / Amamentação em nutrizes submetidas à ciru...
Poster William
1. Analysis of Caesarian Section rates in Gestational Diabetes using
the Robson Groups to allow meaningful examination of Data:
Important implications to clinical practice and patient counseling
W Courtney, C Carroll, Dr D Courtney, Dr M Higgins, Dr M Robson, ProfF McAuliffe, Pr of M Foley
Introduction
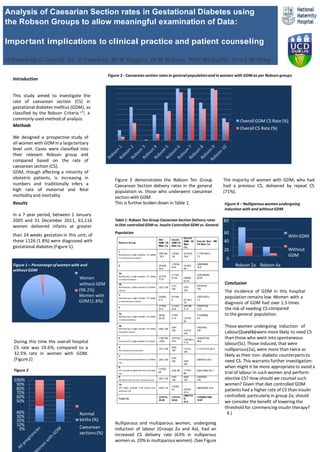
Figure 3 - Caesarean section rates in general populationand in women with GDM as per Robson groups
This study aimed to investigate the
rate of caesarean section (CS) in
gestational diabetes mellitus (GDM), as
classified by the Robson Criteria (1), a
commonly used method of analysis.
Methods
We designed a prospective study of
all women with GDMin a largetertiary
level unit. Cases were classified into
their relevant Robson group and
compared based on the rate of
caesarean section (CS).
GDM, though affecting a minority of
obstetric patients, is increasing in
numbers and traditionally infers a
high rate of maternal and fetal
morbidity and mortality.
Results
In a 7 year period, between 1 January
2005 and 31 December 2011, 61,116
women delivered infants at greater
Figure 3 demonstrates the Robson Ten Group
Caesarean Section delivery rates in the general
population vs. those who underwent caesarean
section with GDM.
This is further broken down in Table 1.
Table1: Robson Ten Group Caesarean Section Delivery rates
in Diet controlled GDM vs. Insulin Controlled GDM vs. General
Overall GDM CS Rate (%)
Overall CS Rate (%)
The majority of women with GDM, who had
had a previous CS, delivered by repeat CS
(71%).
Figure 4 – Nulliparous women undergoing
induction with and without GDM
80
than 24 weeks gestation in this unit; of
these 1126 (1.8%) were diagnosed with
gestational diabetes (Figure 1).
Figure 1 – Percentage ofwomen with and
without GDM
Population 60
40
20
0
Robson 2a Robson 4a
With GDM
Without
GDM
Women
without GDM
(98.2%)
Women with
GDM(1.8%)
During this time the overall hospital
CS rate was 19.6%, compared to a
32.5% rate in women with GDM.
(Figure2)
Figure 2
100%
90%
80%
70%
60%
50%
Conclusion
The incidence of GDM in this hospital
population remains low. Women with a
diagnosis of GDM had over 1.5 times
the risk of needing CS compared
to the general population.
Those women undergoing induction of
Labour(2aand4a)were more likely to need CS
than those who went into spontaneous
labour(SL).Those induced, that were
nulliparous(2a), were more than twice as
likely as their non- diabetic counterpartsto
need CS. This warrants further investigation:
when might it be more appropriate to avoid a
trial of labour in such women and perform
elective CS? How should we counsel such
women? Given that diet controlled GDM
patients had a higher rate of CS than insulin
controlled, particularly in group 2a, should
we consider the benefit of lowering the
threshold for commencing insulin therapy?
40%
30%
20%
10%
0%
Normal
births (%)
Caesarean
sections(%)
Nulliparous and multiparous women, undergoing
induction of labour (Groups 2a and 4a), had an
increased CS delivery rate (63% in nulliparous
women vs. 20% in multiparouswomen). (See Figure
4.)
Robson Group
Diet
GDM CS
Rate (%)
Insulin
GDM CS
Rate (%)
Overall
GDM CS
Rate
(%)
Overall Non- DM
CS Rate (%)
1
Nulliparous, single cephalic >37 weeks
in spontaneous labour
(28/159)
18.3
(13/65)
20
(41/218)
18.8
(1176/16421)
7.2
2 (23/29)
79.3
(18/34)
52.9
(41/63)
65.1
(2869/869)
33.6
2a
Nulliparous, single cephalic >37 weeks
in induced labour
(21/27)
77.8
(17/33)
51.52 (38/60)
63.33
(2323/8046)
28.87
2b
Nulliparous, single cephalic CS before
labour
(2/2) 100
(1/1)
100
(3/3)
100
(573/573)
100
3
Multiparous, single cephalic >37 weeks
in spontaneous labour
(2/282)
0.71
(0/109)
0 (2/ 391)
.51
(220/18321)
1.2
4
(17/45)
37.8
(11/43)
25.6
(28/ 88)
31.8
(765/6139)
12.5
4a
Multiparous, single cephalic >37 weeks
in induced labour
(8/36)
22.22
(7/39)
17.9 (15/75)
20
(312/5696)
5.5
4b
Multiparous, single cephalic >37 weeks
CS before labour
(9/9) 100
(4/4)
100 (13/13)
100
(443/443)
100
5
Previous CS, singlecephalic>37 weeks
(109/159
) 68.5
(78/102)
76.5
(187/261)
71.6
(3364/5735)
58.6
6
All nulliparous breeches
(7/7) 100
(6/6)
100
(13/13)
100
(1177/1273) 92.5
7
All multiparous breeches (incl. previous
CS)
(5/5) 100
(4/4)
100 (9/9)
100
(685/815) 84.1
8
All multiple pregnancies (incl. previous
CS)
(13/20)
65
(4/5) 80 (17/25)
68
(654/1066) 60.7
9
All abnormal lies (incl. previous CS)
(2/2) 100
(4/4)
100
(6/6)
100
(220/220)
100
10
All single, cephalic, <=36 weeks (incl.
previous CS)
(9/27) 33
(13/25)
52 (22/52)
37.9
(882/2546) 34.6
Total (%)
(215/72)
29.49
(151/37)
38.04
(366/112
6)
32.5
(12029/61166)
19.67