1. New Zealand Journal of Asian Studies 4, 2 (December, 2002): 115-133.
HUMAN DEVELOPMENT AND THE URBAN
INFORMAL SECTOR IN BANDUNG, INDONESIA:
THE POVERTY ISSUE
EDI SUHARTO1
Bandung School of Social Welfare
One of the most striking issues in the study of the urban informal sector has
been the relationship between the sector and poverty, a constant association
made over the last few decades (see McGee, 1975; McGee and Yeung, 1977;
Portes, Castells, and Benton, 1989; Mead, 1996; Cartaya, 1994; Thomas, 1995;
Firdausy, 1995). Such previous studies of the informal sector, however, were
often dominated by a ‘reductionist’ view of livelihoods, which focused on the
enterprise (Suharto, 2002). Economic measures were often employed as the
only yardstick to explore the many dimensions of the informal sector, with
access to education and health for the operators and their families often
overlooked as important determinants. Such research stressed wage-based
employment, whereas much of the informal sector continues to revolve
around livelihood-based activities. Such economic measures provided, at best,
only a partial picture of informal sector characteristics.
The issue of poverty in the urban informal sector is also prominent in
Indonesia since, in recent years, the combination of slower industrialisation,
increasing growth of urban centres, and the economic crisis of the late 1990s
have amplified the already alarming rates of urban poverty and
unemployment. The limits of industrialisation and emerging trends of
1 Edi Suharto (ediesuharto@hotmail.com) is Director of the Institute for Development
Studies at the Bandung School of Social Welfare, Indonesia. His research focuses on the
urban informal sector with particular emphasis on poverty, human development and coping
strategies. Much of the material for the article was collected while the author was doing PhD
in Development Studies, Massey University, New Zealand. Thanks are due to his thesis
supervisors, Professor John Overton and Dr Donovan Storey, for their invaluable comments.
The author would also like to acknowledge Dr Sarah Turner, McGill University and
anonymous referees for their constructive and invaluable comments.
2. 116 Suharto
urbanisation in the country have resulted in the proliferation of the informal
sector in the labour markets. This is particularly true during the period of
economic crisis between 1997 and 1999, when Indonesia suffered severe cuts
in the rate of expansion of employment within the industrial-formal sectors of
its economy (ILO, 1998; Ranis and Stewart, 1999; Tambunan, 2000; Suharto,
2002). Since many of the informal sector workers in Indonesia were amongst
the pre-existing poor, during the recession they have faced particular
difficulties arising from their reduced purchasing power, price rises, and
subsidy removals.
Indonesia has one of the largest informal sector economies in the world.
As in many other Third World countries, the informal sector in Indonesia still
accounts for most of the total employment. During the 1980s and 1990s, the
number of those who constitute the economically active population and who
depend on the informal sector as their main source of employment and income
has been consistently more than sixty per cent of the total labour force (see
Sethuraman, 1985; Evers and Mehmet, 1994; Firdausy, 1995; Azis, 1997;
CBS, 2001). In 1998, it consisted of 43 million people in rural areas and 14
million in urban areas, or about 65 per cent of the total working population
(CBS, 2001; Hugo, 2000:125).2
Despite the fact that the informal sector provides a livelihood for huge
numbers in the national labour force, this sector continues to have low
productivity, poor working conditions, low incomes and few opportunities for
advancement. Although some of the more structured groups of the informal
sector, such as street traders, tend to have an entrepreneurial character and
sometimes high incomes, it is widely recognised that the informal sector is still
vulnerable, with little capital, limited markets, inadequate economic returns,
and low levels of living standards. Many people in the informal sector of
Indonesia earn extremely low incomes (Sethuraman, 1985). According to
Firdausy (1995), at the macro level, the poor in Indonesia can be found in both
the formal and informal sectors, yet the proportion of poor households in the
informal sector is much higher than that in the formal sector. In 1993, the
percentage of poor households employed in the informal sector was very high,
accounting for 74 per cent of total poor households (Firdausy, 1995:285).
Evers and Mehmet (1994:7) also found that the activities of the informal sector
are full of risk and uncertainty which, due to a high probability of failure, is
manifest not only in ease of entry to this sector but also in quick exits.
2 The division of formal and informal employment in Indonesia can be attributed to a
category of employment status as defined by the Central Board of Statistics (CBS) (see
Evers and Mehmet, 1994; Azis, 1997; Firdausy, 1995:284; Firman, 1999:54; Hugo,
2000:125; McGee and Firman, 2000:325). The formal sector refers to workers involved in
wage employment, namely employers and employees. The informal sector refers to those
engaged in non–wage employment, namely the self–employed, self–employed assisted by
family, day labourers, and unpaid family workers. However, since the definition is broad in
nature, the figure is still open to debate.
3. Human Development and the Urban Informal Sector in Bandung 117
This study attempts to verify the above aggregate findings by providing
data on socio–economic characteristics of street traders, pedagang kakilima,3
on the basis of the human development perspective. Three main indicators of
human development, covering the economic, human and social capital of
pedagang kakilima, are examined to identify the relationship between the
urban informal sector and poverty.
Methodology
Using micro-level surveys, the fieldwork for this study was conducted in
Bandung over a five–month period, between April and August 1999.
Bandung is the capital of West Java province and is situated 180 kilometres
southeast of Jakarta. It serves as a regional centre of administrative and
business activities and is a destination for rural migrants in search of
employment. It has a large and varied informal sector, including pedagang
kakilima, pedagang asongan (mobile hawkers), and pedagang keliling
(itinerant petty traders).
The city selected as the study area shares much in common with other
large Indonesian cities in terms of the level and pace of urban development as
well as the severe economic downturn associated with the recent structural
adjustment period. Bandung administratively consists of two regions: the
district (kabupaten) and the municipality (kotamadya). The municipality
covers the metropolitan core of Bandung City and was selected as the focus of
this study. In 1998, the population of Kotamadya Bandung reached 2.5
million, with an average household size of 4.07 people (CBS-West Java, 1999).
Four research sites were then selected within the municipality region: Cicadas,
Simpang, Alun-alun, and Cicaheum. These sampling blocks respectively
represent the street, public market, commercial complex, and bus station –
areas which typically contain a cluster of street enterprises. The samples were
drawn using the “multistage cluster sampling technique” (de Vaus, 1991:67)
thus multi–stage classification before sampling (see Suharto, 1994: 31). After
refinements, the total sample selected was 150 people. On average, this
represented about 12.83 per cent of the population in the sampling frame.
Standardized questionnaires were mainly employed to collect information, but
informal interviews and observations were also conducted.
3 Technically, the term ‘kakilima’ is derived from two words: ‘kaki’ and ‘lima’ which are
commonly separated as ‘kaki lima’. This study joins these two words into ‘kakilima’,
following common perceptions of the kakilima as a single and distinct characteristic.
Historically, the term kakilima was attributed to the rule applied by the Dutch during
colonisation to free the pavement or walking area between street and stores which was about
five steps or feet.
4. 118 Suharto
An Overview of Indonesia’s Development
The performance of the Indonesian economy has been notable, measured on
the basis of economic indicators. Until the regional economic crisis hit
Indonesia in mid-1997, the economy expanded at a constant rate between the
1960s and 1990s. While income per capita rose thirteen-fold from US$50 to
US$650 between 1967 and 1995, the economic decline of the first half of the
1960s was substituted by strong positive growth for almost the entire period
of 1966-90 (see World Bank, 1994, Hill, 1994; Smyth, 1997: 29). The annual
real GDP growth during 1994-97 was 7.2 per cent, with average inflation of
9.0 per cent annually. In the period 1994-96, export and investment growth
were also relatively high, at 11.9 and 20.7 per cent respectively (Garnaut,
1998: 22-5). Following this economic prosperity, basic social indicators
pointed to the positive effects of such changes. Poverty declined from 70
million people or 60 per cent of the total population in 1970, to an estimated
22.5 million or 11.3 per cent in 1996;4 life expectancy improved from 52 to 65
years between 1976 and 1997; infant mortality declined from 108 to 50 per
thousand live–births; and the literacy rate during 1961-97 rose from 42.9 per
cent to 87.4 per cent of the total population (CBS, 1995; 1998; Smyth, 1997;
Booth, 1998, 1999).
A brief review of human development, comparing the socio–economic
conditions between 1980 and the mid–1990s, also shows that the
improvements were remarkable in many respects (see Table 1). The data in
Table 2, furthermore, suggests that, although its HDI rank is lower than that of
its two major Southeast Asian neighbours, Thailand and Malaysia, Indonesia
still performed modestly well by such comparative indicators. Data in Table 2
also suggests that the good performance of human development was due, in
large part, to the combination of high economic growth and its allocation,
especially on education and health expenditures. Ranis and Stewart
(1999:109–10) confirm that Indonesian government expenditure was not
particularly high by international standards and the lowest amongst its
neighbours, but it “was well distributed, with an emphasis on primary
education and health care”.
As many studies show, however, the achievements resulting from the
structural transformations were only partially successful (see ILO, 1998;
Booth, 1999; Ranis and Stewart, 1999; Tambunan, 2000; Suharto, 2002).
While the level of industrialisation continued to be surpassed by the level of
urbanisation, inappropriate macro– and micro–economic policies and bad
governance practices changed the past record of economic success into
economic collapse.
4 The official poverty line in Indonesia is based on basic physical needs (e.g. the income
required for a certain calorie intake) according to urban and rural areas. For example, at the
end of 1998, CBS established a standardised estimation of the poverty line for urban areas of
Rp.96,959 per capita per month (CBS, 1999:1).
5. Human Development and the Urban Informal Sector in Bandung 119
Table 1. Features of human development, Indonesia 1980-1994
Indicators 1980 1994
Economic Capital
GDP per capita (constant price 1983/rupiah)
GDP growth (constant price 1983/rupiah)
Inflation rate (%)
452,908
9.9
16.0
1,841,534
7.3
9.2
Human Capital
Literacy rate (%)
Educational attainment (%)
Junior High School and lower
Senior High School
Diploma/Academy/University
Life expectancy at birth (year)
Infant mortality per 1,000 births
Doctors per 1,000,000 people
Hospitals per 1,000,000 people
Public Health Centre per 1,000,000 people
Access to housing facilities (%)
Electricity
Piped drinking water
Private toilet facility with septic tank
Using non–land floor
71.8
93.3
6.0
0.7
52.2
109
74
51
43
14.2
7.0
8.9
61.9
87.2
86.2
11.7
2.1
63.5
(1995)
55
(1995)
163
51
98
60.9
16.1
22.0
75.2
Social Capital
Access to socio–cultural activities
Watch television
Listen to the radio
Read newspaper
Member of social organisation
(1984)
44.5
49.4
15.4
n.a.
69.4
63.9
23.1
38.1
Source: CBS (1995 various tables); UNDP (1997:186).
In terms of changes in employment, for example, the ILO study (1998) shows
that before the crisis, between 1990 and 1998, although most employment was
still concentrated in the agricultural sector, employment in that sector declined
rapidly from 55 per cent to 41 per cent of the total labour force. In the same
period, industrial employment rose from about 14 per cent to almost 20 per
cent. Following the economic crisis, however, the trend of the movement of
workers out of agriculture was reversed. It also witnessed the rise of the
informal sector. The study estimates that in the period of crisis between 1997
and 1998, the layoff of 5.4 million workers from the formal sector resulted in
the decline of waged employment from 35 per cent to 30 per cent. It is
estimated that at least half of the newly unemployed were absorbed by the
informal sector and other small–scale or cottage industries (Tambunan, 2000:
116).
6. 120 Suharto
Table 2. Indonesia’s human development in comparative perspective,
1980s-1990s.
Country
Indicators Indonesia Malaysia Thailand Philippines
HDI rank (1995)
Real GDP per capita (PPP$)
(1995)
Adult literacy rate (1995)
Life expectancy at birth (1995)
Social expenditures (1980–90):
Govt. expenditure (% of GDP)
Education exp. (% of govt.)
Health exp. (% of govt.)
Education plus health (% of
GDP)
96
3,971
83.8
64.0
20.2
8.9
2.5
2.3
60
9,572
83.5
71.4
28.9
16.4
4.4
6.0
59
7,742
93.8
69.5
16.4
12.1
4.2
2.7
98
2,762
94.6
67.4
16.5
9.1
5.0
2.3
Source: UNDP (1998:128–9); Ranis and Stewart (1999:110).
One of the striking results of this analysis is that a combination of urbanisation
and economic crisis has greatly affected the size and growth of the informal
sector, particularly in urban centres of Java, such as Jakarta, Bandung,
Surabaya and Yogyakarta. As widely reported by national and local
newspapers, the crash of the modern economy between 1997 and 1999,
involving the closure of banks, factories and service agencies, pushed the
newly unemployed into the informal sector and more than doubled its size. In
the case of street enterprises, the increase was dramatic. In Jakarta and
Bandung, for example, between the end of 1996 and 1999 the growth of the
pedagang kakilima was estimated at 300 per cent (Kompas, 23 November
1998; Pikiran Rakyat, 11 October 1999).
Human Development of Street Traders
It is clear that becoming a successful pedagang kakilima is not as simple as
one generally assumes. Basic requirements involve not only physical and
financial resources, but also human and social resources. In addition to suitable
trading premises, tools, and working capital, for example, street traders require
knowledge and entrepreneurial skills as well as a healthy body to run the
ongoing business properly and profitably. Based on these assumptions, it is
argued that the association between the informal sector and poverty cannot
simply be made on the basis of low incomes.
It is in this context that the human development perspective has been
chosen to identify the living standards of the street traders, and examine the
linkage between them and poverty. The human development approach
adopted by UNDP in 1990 basically argues that people are the real wealth of a
nation and hence the basic objective of development should focus on enlarging
7. Human Development and the Urban Informal Sector in Bandung 121
people's choices through the creation of “an enabling environment for people
to enjoy long, healthy, and creative lives” (UNDP, 1990: 9). The approach
then goes into great detail to define and develop the Human Development
Index (HDI). This index is an attempt to measure interrelated and un-weighted
aspects of economic (e.g. income), education (e.g. literacy rate), health (e.g. life
expectancy), and sociopolitical (e.g. social participation, freedom of speech,
multiparty system) determinants of development that can be used to make
cross–country comparisons.
The given definition of human development as enlarging people’s
choices “to enjoy long, healthy, and creative lives” is very broad (see UNDP,
1990; Ranis and Stewart, 1999; Suharto, 2002). For the purpose of exploring
the level of human development of pedagang kakilima, these measures need
to be empirically narrowed. This study therefore considers the indicators of
human development of street traders as consisting of economic, human and
social capital. Economic capital includes working capital, trading revenues and
household incomes. Human capital includes attainment of education, access to
health services, and access to housing facilities. Social capital covers access to
social institutions as indicated by the participation in socio–cultural activities.
Tables 3 to 5 sum up the main findings and show to what extent street traders
and their families in the study locations possess this economic, human and
social capital.
Economic capital
Two of the crucial economic variables affecting the business performance of
the street enterprises are working capital and trading revenues. Given the
nature of the survey data, it was decided to measure working capital and
trading revenues on the basis of the value of stock, and daily gross earnings of
the enterprise, respectively. Value of stock (that is, the estimated prices of
goods or wares of a given vendor) was felt to be the best indicator because it
generally represents the working capital of the street vendors, regardless of
their types of trading (McGee, 1975; McGee and Yeung, 1977). For example,
the working capital of street traders offering services is frequently rudimentary
since they are often ‘sweat-shops’ involving only simple tools and manual
labour. Thus, the value of stock can be used as a proxy to measure their
working capital in terms of the tools and resources used. Likewise, in a
pragmatic sense, gross earnings can be used to identify trading revenues. The
question about gross earnings (that is, daily gross revenues before a deduction
of all total costs used in the daily operation of the trading) was easily supplied
by street traders, since it did not involve complicated calculations. Overall,
these measures were less liable to errors of response since both traders and
interviewers could easily check the amount of stock on display in the vendor
unit of operation, as well as count the amount of money obtained from trading
each day. The data on working capital and trading revenues per day are
presented in the first and second rows of Table 3.
8. 122 Suharto
Table 3. Economic capital of pedagang kakilima.
Types of Trading (%)
Indicators Food Goods Services Total
Working capital 1
0 – 200,000
200,001 – 400,000
400,001 – 600,000
600,001 – 800,000
800,001 – 1,000,000
1,000,000 +
27
12
13
17
11
20
36
15
826
33
47
26
505
16
32
15
11
10
9
23
Trading revenue per day 2
0 – 10,000
10,001 – 20,000
20,001 – 30,000
30,001 – 40,000
40,000 +
15
41
26
7
11
31
44
84
13
42
42
11
50
24
42
18
6
10
Household income per day 3
0 – 10,000
10,001 – 20,000
20,001 – 30,000
30,001 – 40,000
40,000 +
12
41
23
8
16
29
39
12
2
18
37
47
16
00
20
42
18
5
15
Notes: N= 150;
1) the average (mean) working capital was Rp.1,059, 545 or, calculated at the rate of
NZ$ 1= Rp.4,000, about NZ$ 265;
2) the average (mean) gross profit per day was Rp.22,850 (NZ$ 6);
3) the average (mean) household income was Rp.32,454 or about NZ$8 per day.
Source: Field work (1999).
For very small enterprises, the amount of capital needed to start and operate a
business varies considerably from activity to activity, and the larger and more
technically skilled the establishment, the higher the demand for capital (see
House, Ikiara and McCormick, 1993: 1213). For example, street traders
offering services such as hair cutting and shoe-shining require little initial and
working capital, while traders operating a street restaurant, or selling clothes,
shoes, and fruit need substantially more. Based on the mean value of the
stock, the average working capital of the street vendors was estimated to be
slightly over Rp.1,000,000 (NZ$250). This relatively high capital was
especially true for 16 per cent, 19 per cent, and 33 per cent of those trading
services, food, and goods respectively. However, the majority of street trader
capital was minimal, under Rp. 200,000, while wide variations were found
among different activities, with vendors offering services having less capital
than vendors selling food and goods.
In terms of trading revenues, most pedagang kakilima seemed to have
no difficulty in remembering expenditures and profits, although they did not
keep written records on their cash flow. After weighing up their answer
against the observed daily cash flow, it was found that the vendor’s daily
9. Human Development and the Urban Informal Sector in Bandung 123
average profits were about Rp. 22,850 (NZ$6). These daily earnings,
especially those earned by 35 per cent of the vendors, placed their revenues up
to Rp.685,500 per month.
The data on working capital and trading revenues of the street vendors,
to some extent, show the incomes of the operators and their households.
However, to infer the standard of living of the traders and their families, the
enterprise capital and trading revenues could not be equated with household
incomes. As a part of a livelihood strategy, street vending is often not the sole
source of income – though it is a major one – for the traders’ households. It is
common that almost all household members contribute to provide additional
incomes for their family, either from similar activities, or from other sources of
income. Therefore, data on household incomes need to be identified as well.
The average household income of street vendors was found to be
Rp.32,454 or about NZ$8 per day, accounting for up to 30 per cent of total
household income. Bearing in mind that the overwhelming majority of street
traders had very low working capital of no more than Rp.200,000, it is not
surprising that most of them earned small profits from their trading, and that
they had low household incomes as well. Nevertheless, the findings appear to
show that street traders make a reasonable profit from their trading, and that
this return is relatively favourable in comparison to other available and
accessible alternative sources of income.
In addition, on a monthly basis, the earnings of pedagang kakilima,
counted either as enterprise earnings or total household incomes are well
above the standard minimum wage of formal employment, known as UMR or
upah minimum regional (regional minimum wages) of nearly Rp.300,000 per
month for Bandung, and substantially higher than the wage for unskilled
manual labour such as construction workers and cleaning service workers.
This income is also comparable to the salaries paid to new civil servants in
almost all government offices, to lower ranks of military officers, and to the
low–skilled labourers in banks and other private industrial factories (for
example clerks, or general assistants) (see Tinker, 1997; Turner, 2003).
At the end of 1998, CBS established a standardised estimation of the
poverty line for urban areas: Rp.96,959 per capita per month (CBS, 1999:1).
Noting that the average size of the street trader households interviewed was
four, the poverty line for a household was Rp.387,836 per month, or about
Rp.12,928 per household per day. On the basis of such an official poverty
line, both the average daily vendor profits, and the household incomes of the
pedagang kakilima interviewed, were nearly double the minimum basket of
poverty measures of the country.
However, such calculations alone should not be used to situate the street
traders in Bandung on a rich-poor continuum in the population. While the
poverty line can be used to gauge the capability of individuals or families in
meeting basic needs and hence get close to the idea of absolute or extreme
poverty, this yardstick varies among cities. The costs for purchasing basic
meals, for example, are higher in Bandung than in smaller cities. Moreover,
this poverty line is also very low (about NZ$1 per capita per day). It is based
10. 124 Suharto
only on very basic physical needs (calorie intake) and does not take into
account social needs, such as education, health and housing. As a result, while
those who are unable to purchase their basic needs can be labelled as being
extremely poor or destitute, those who are able even to meet the costs of the
basic necessities cannot automatically be labelled as ‘not poor’ since their
incomes are still in the lower tail of the income distribution of the country (see
Thomas, 1995). They are still likely to face problems of overcrowded housing,
and lack of access to transport and recreation facilities, which, although not
being life–threatening, represent deprivation compared to the rest of the
population (see Thomas, 1995:70).
Taking into account the limitation of the CBS’ poverty line, the link
between poverty and street trading in Bandung appears to be more adequate if
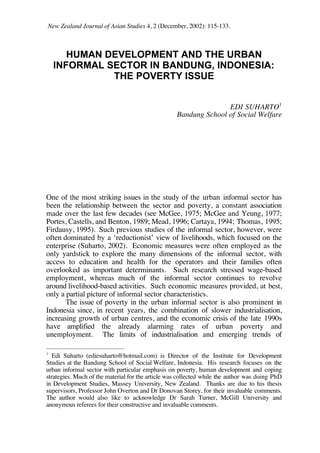
it is categorised into three groups on the basis of the multiplication of the
poverty line.5 Arranged in regards to trading revenues and household
incomes, pedagang kakilima in Bandung can be classified into three groups,
namely the poor, vulnerable, and better-off pedagang kakilima. As illustrated
in Figure 1, such a link between the pedagang kakilima and income-poverty is
manifested in a form of an hexagonal shape.
1. Group one: the poor pedagang kakilima, defined as the traders whose
daily earnings are lower than Rp.10,000. They are categorised as poor
since their economic situation is less than the basic poverty line of
Rp.12,928 / day. This group consisted of 24 per cent and 20 per cent
respectively of the traders based on their trading revenues and household
incomes per day.
2. Group two: the vulnerable pedagang kakilima, defined as those having
daily earnings between Rp.10,000 and 30,000. They are vulnerable
because their gross profits and incomes are higher than the poverty line,
but still around or only slightly above twice the minimum level (Rp.25,856).
Based on both trading revenues and household incomes, 60 per cent of the
traders were in this category.
3. Group three: the better–off pedagang kakilima, defined as those having
daily earnings higher than Rp.30,000 and hence above twice the poverty
line. Based on trading revenues and household incomes, respectively, the
number of pedagang kakilima categorised as the ‘well–off’ traders was 16
per cent and 20 per cent of the total sample population.
Human capital
Education, health, and housing have been regarded as essential human capital
for further economic and social development. In the context of development,
5 The rationale to use the approach of poverty line multiplication mirrors the Chilean
Ministry of Planning and Coordination (see Thomas, 1995:71-2).
11. Human Development and the Urban Informal Sector in Bandung 125
no country can secure economic well-being or poverty reduction without an
educated, healthy, and well–housed population. The evidence in Table 4
shows the level of human capital of the street traders interviewed with respect
to access to education, health services, and housing facilities. In general, the
findings show that street traders in Bandung have adequate access to such
human capital since the figure is relatively comparable to, or even better than,
the average welfare indicators of the Indonesian population. For example, in
1998 the percentage of Indonesian population aged 10 or above which did not
complete Primary School was 26 per cent in both urban and rural areas (CBS,
1998:58).
The Better-off
Pedagang Kakilima
24 % (trading income) and
20 % (household income)/ day.
The Vulnerable
Pedagang Kakilima
60 % (for both trading and
household incomes)
The Poor
Pedagang Kakilima
16 % (trading income) and
20 % (household income)/ day.
Figure 1. Street traders categorised as ‘better off’, ‘vulnerable’ or ‘poor’ based on
multiplication of the poverty line.
Source: Field work (1999).
In view of potential business success, street traders require not only their
natural talent, but also knowledge often acquired through formal schooling.
Competence in reading, writing and arithmetic is extremely useful for
operating small-scale enterprises. Table 4 shows that since almost all
pedagang kakilima have had some formal education, illiteracy is not a major
problem for street traders in Bandung. The data show that the majority of
pedagang kakilima have achieved primary school level and many have higher
levels of education. The pattern of educational level by types of trading is
even more striking, with street traders selling goods having had relatively
better education than those selling services and food respectively. According
to these types of commodities, the highest level of education attained ranges
sequentially: senior high school (12 years of schooling) for those selling goods,
junior high school (9 years of schooling) for those offering services, and
elementary school (6 years of schooling) for those trading food.
12. 126 Suharto
Table 4. Human capital of pedagang kakilima.
Types of Trading (%)
Indicators Food Goods Services Total
Level of education
No Schooling
Primary School
Junior High School
Senior High School
Tertiary Education
1
55
31
94
6
25
29
38
2
5
21
48
26
0
3
41
33
20
3
Access to health services
Doctor
Hospital
Health Centre
Health Personnel
Others
Average
79
45
89
22
29
53
56
33
71
26
5
38
68
42
79
33
12
47
70
41
81
25
18
47
Access to housing facilities
Water
Toilet
Electricity
Floor
Average
88
84
98
68
85
79
87
97
67
83
89
84
100
79
88
85
85
98
69
84
Note: N= 150. Source: Field work (1999).
The value of health as human capital is widely acknowledged. It is argued
that, like education, health is often taken to be a key indicator since it has
multiplier effects on both economic productivity and basic needs achievement
(Hicks, 1982; UNDP, 1990; Haq, 1995). Better health will permit street
traders to work harder and thus produce more, which can be used to satisfy
their basic needs, including those of their family. With reference to street
enterprises, furthermore, the health of the street traders was central to the
functioning, as well as the sustainability, of street trading. The importance of
health is not only because it relates to productivity but also because it relates to
the survival of street trading, as health problems can lead to the closure of a
business. At present there is no health insurance scheme for street traders in
Indonesia, and yet physical fitness is a fundamental constituent to the ongoing
operation of street enterprises. Tinker (1997) reveals that illness was found to
be a principal cause of temporary as well as permanent termination of most
street food enterprises in her study, since doctor and hospital bills often
consumed their entire assets.
The indicators in terms of health accessibility were measured on the
basis of the utilisation of health services or medical facilities. These facilities
can be ranked from those having high quality treatment to those with the
lowest, such as doctor, hospital, health centre, health personnel and others
(traditional healer or self–treatment). While a number of different approaches
to identifying health accessibility are available, the most empirically possible
approach is the utilisation of health service facilities. Theoretically, high
13. Human Development and the Urban Informal Sector in Bandung 127
utilisation of such medical facilities indicates the optimal access of health
facilities allowing people to cure health-related problems at best. This, hence,
decreases the propensity towards low life expectancy. However, since such an
indicator does not identify direct links between heath accessibility and health
condition, this limitation should be borne in mind in interpreting the findings
reported below.
Data on health in Table 4 show that 81 per cent of pedagang kakilima
used a health centre and 70 per cent of the traders saw a doctor when they
got sick, while 41 per cent of them went to hospital and 25 per cent to health
personnel (mantri kesehatan) when they felt unwell. The ‘others’ category in
the table indicated a range of other ways of curing sickness, such as traditional
healing or self–medication (using medicines not prescribed by a doctor) to cure
their sickness. The high utilisation of health centres seems to reflect the
cheaper cost of medical treatment available there, since most medical expenses
in health centres in Indonesia are heavily subsidised by the government. On
the whole, the figures reveal no striking differences in the pattern of health
conditions amongst the different types of traders.
Another important aspect associated with human capital is the
availability of adequate housing facilities, such as clean water supply, toilet
facilities with a septic tank, electricity, and a constructed floor. Such facilities
are substantial constituents of human well–being. Better housing facilities
improve resistance to disease. Clean water, for instance, can reduce the
incidence of water–borne disease, which, in turn, enables people to absorb
greater nutritional value from their food (Hicks, 1982: 489). Questions
concerning this issue were mainly pursued at the place of sale by using survey
questionnaires. Street trader homes were also visited, particularly to observe
the household environment, when qualitative approaches were used.
This study found that the proportion of pedagang kakilima’s shelters
equipped with housing facilities appear to be adequate: overall 85 per cent of
the trader houses were equipped with each of the facilities mentioned above.
Over three-quarters of the trader houses had access to water supply, electricity
and a toilet. Nonetheless, there was still 31 per cent of the houses with
earthen–floors built over the ground. Although there was no significant
difference in the accessibility to housing facilities amongst traders, on average
street service traders were more likely to have better housing facilities than
goods and food vendors.
Social capital
Standards of living of a society can also be reflected in the ways of using
leisure time for social and cultural activities. In this study, the access to
socio–cultural activities was measured approximately by the proportion of
street traders watching television, listening to the radio, reading newspapers, or
by the proportion of street traders participating in local organisation activities
(for example, Pendidikan Kesejahteraan Keluarga (PKK, women welfare
organisations), youth organisations of Karang Taruna, cooperatives and rotary
14. 128 Suharto
saving clubs, or religious groups).6
Table 5 below shows that in total, the social capital of pedagang
kakilima was very low. The proportion of street vendors having access to
each of the facilities was only 36 per cent. The proportion of service providers
having access to socio–cultural activities was relatively better than that of
goods and food vendors. The sequence of events in the table demonstrates
that watching television, listening to the radio, reading newspapers, and
participating in local organisations appear as the most regular to the lowest
regular activities that the vendors engaged in. When respondent houses were
observed, it was found that many street trader households in each kampung
(village area) owned a television and a radio separated or attached to a tape
recorder. Reflecting their extended family living patterns, however, the
ownership of the equipment was frequently shared among family members.
Also, reflecting their literacy, it was clear that some traders read newspapers
regularly, although they did not subscribe. They mostly purchased a
newspaper occasionally, or read an old copy, or for those selling newspapers
or trading near to a newspaper seller, they freely read a copy of a newspaper
while waiting for customers.
Table 5. Social capital of pedagang kakilima.
Types of Trading (%)
Indicators Food Goods Services Total
Access to socio-cultural
activities
Television
Radio
Newspaper
Local Organisations
Average
52
44
15
16
31
53
36
48
21
39
63
74
31
21
47
54
45
27
18
36
Note: N= 150.
Source: Field work (1999)
Conclusion
Measured by the level of income alone, the results of this study are quite
consistent with the findings of the pioneering work of McGee (1975), McGee
and Yeung (1997) as well as with recent empirical studies (see Cartaya, 1994,
Evers and Mehmet, 1994, Thomas, 1995, Firdausy, 1995 and Turner 2003)
that argue that whilst members of the informal sector need not include the
poorest in society, they are still often associated with poverty. In aggregate
and on average, the street traders interviewed were not the poorest in society
as the incomes of those interviewed were often higher than the official poverty
6 In Indonesia, these local organisations play important roles in the local community
development, including in a variety of poverty alleviation programmes (Suharto, 1994).
15. Human Development and the Urban Informal Sector in Bandung 129
line, and some street traders even had higher incomes relative to those in the
low skilled formal sector, and unskilled construction workers.
However, despite this calculation, the vast majority (80 per cent) of the
street traders interviewed could still be categorised as being poor and
vulnerable. Some 20 per cent of street traders’ incomes were found to be
below the poverty line. A further 60 per cent – the vulnerable pedagang
kakilima – had daily earnings between Rp.10,000 and 30,000. Whilst their
incomes were higher than the poverty line, they were still near or only slightly
above twice the minimum level (Rp.25,856). This means that although those
labelled as being extremely poor or destitute are only a minority, there are
many more who are only just able to meet the costs of basic necessities, and
are still living in vulnerable conditions. This becomes even more clear when
one notes just how low the poverty line is, as well as the problems with its
calculation.
As illustrated in Figure 1, when examining these income–poverty
relations, the profiles of pedagang kakilima in Bandung form an hexagonal
shape. This contrasts with the pyramid shape often portrayed in examinations
of the linkages between the informal sector and poverty in most developing
countries, notably in Latin America (see Marquez, 1994: 166; Thomas,
1995:129–30). At the top of the hexagon are a few more economically
successful street merchants or ‘petite bourgeoisie’ who tend to operate small
enterprises successfully and earn relatively high revenues and household
incomes from the business. In the mid–section are a large number of
vulnerable establishments operating businesses under unstable conditions.
Amongst this largest proportion, there are ‘petty entrepreneurs’ who could
potentially respond to market opportunities and/or graduate to the top, pushed
by favourable conditions in their environment. But in this group, there are
also ‘marginal traders’ who could possibly slip down to the base, as a result of
unfavourable markets and competition. At the base, are a large number of
‘subsistence economic producers’ with rudimentary operations who earn only
small and inadequate incomes. They are barely able to sustain their business
and family well–being unless they are assisted by supportive developmental
initiatives from external agents.
Moving from these income based indices however, to take other human
development measures into account, we are provided with a somewhat
different picture of poverty amongst the informal sector interviewees. With
reference to human and social capital indicators, for example, it was possible
for the street traders to be categorised as not ‘poor’, because they had
relatively adequate basic education and access to health services and housing
facilities, although their propensity to participate in social activities seemed to
be low.
The relatively high scores gained by the interviewees for access to
health services (such as doctors and health centres) and housing facilities (such
as water, toilet, and electricity) were somewhat surprising. It was expected
that the low trading profits and household incomes would be automatically
followed by low scores regarding human capital. This did not happen. In
16. 130 Suharto
general, the human and social indicators of development for pedagang
kakilima also appeared to be satisfactory when compared against national
figures. Government initiatives to improve social services may have had a part
to play here. This evidence also suggests that although economic indices are
important and, perhaps, still the most critical factors for measuring the
performance of enterprise activities and household living standards, the
expanded yardsticks in the human development approach provide a fuller
picture of the socio–economic profiles and problems of those in the informal
sector.
17. Human Development and the Urban Informal Sector in Bandung 131
References
Azis, Iwan Jaya (1997), “The Increasing Role of The Urban Non-Formal
Sector in Indonesia: Employment Analysis within a Multisectoral
Framework” in Gavin W. Jones and Pravin Visaria (eds.), Urbanization
in Large Developing Countries: China, Indonesia, Brazil, and India,
Oxford: Clarendon Press, pp.143-159.
Booth, Anne (1998), The Indonesian Economy in The Nineteenth and
Twentieth Centuries: A History of Missed Opportunities, New York: St.
Martin's Press.
–––––– (1999), “The Impact of the Crisis on Poverty and Equity”, in H.W.
Arndt and Hal Hill (eds.), Southeast Asia’s Economic Crisis: Origins,
Lessons, and the Way Forward, Singapore: Institute of Southeast Asian
Studies, pp.128-141.
Cartaya, Vanessa (1994), “Informality and Poverty: Casual relationship or
Coincidence?” in Cathy A. Rakowski (ed.), Contrapunto: The Informal
Sector Debates in Latin America, Albany: State University of New
York Press, pp.223-250.
CBS (1995), Indikator Kesejahteraan Rakyat (Welfare Indicators), Jakarta:
CBS.
–––––– (1998), Indikator Kesejahteraan Rakyat (Welfare Indicators), Jakarta:
CBS.
–––––– (1999), Penduduk Miskin (Poor Population), Berita Resmi. Statistik
Penduduk Miskin, No. 04/Th.II/9, July, Jakarta: CBS.
–––––– (2001), Employment Statistics: Selected Tables, www. bps. go.
id/statbysector/ employ/table1.shtml (accessed 7 May 2001).
CBS–West Java (Central Board of Statistics of West Java) (1998), Jawa Barat
Dalam Angka (West Java in Figures), Bandung: CBS-West Java.
de Vaus, D.A. (1991), Surveys in Social Research, Sydney: Allen and Unwin.
Evers, Hans Dieter and Ozay Mehmet (1994), “The Management of Risk:
Informal Trade in Indonesia”, World Development, Vol.22, No.1, pp.1-
9.
Firdausy, Carunia Mulya (1995), “Role of the Informal Service Sector to
Alleviate Poverty in Indonesia”, The Indonesian Quarterly, Vol. XXIII,
No. 3, pp.278-87.
Firman, Tommy (1996), “Urban Development in Bandung Metropolitan
Region: A Transformation to a Desa-Kota Region”, Third World
Planning Review, Vol.18, No.1, pp.1-21.
Funkhouser, Edward (1996), “The Urban Informal Sector in Central America:
Household Survey Evidence”, World Development, Vol.24, No.11, pp.
1737-1757.
Garnaut, Ross (1998), “The East Asian Crisis” in Ross H. McLeod and Ross
Garnaut (eds.), East Asia in Crisis: From Being A Miracle to Needing
One?, London: Routledge, pp.3-27.
Haq, Mahbub Ul (1995), Reflections on Human Development, New York:
Oxford University Press.
Hicks, Norman L. (1982), “Sector Priorities in Meeting Basic Needs: Some
Statistical Evidence”, World Development, Vol.10, No.6, pp.489-499.
18. 132 Suharto
Hill, Hal (1994), “The Economy” in Hal Hill (ed.), Indonesia’s New Order:
The Dynamic of Socio-economic Transformation, London: Allen and
Unwin, pp.54-121.
House, William J., Gerrishon K. Ikiara, and Dorothy McCormick (1993),
“Urban Self–Employment in Kenya: Panacea or Viable Strategy?”,
World Development, Vol. 21, No.7, pp.1205-1223.
Hugo, Graeme (2000), “The Impact of the Crisis on Internal Population
Movement in Indonesia”, Bulletin of Indonesian Economic Studies,
Vol.36, No.2, pp.115-138.
ILO (International Labour Organisation) (1998), Employment Challenges of
the Indonesian Economic Crisis, Jakarta: ILO.
Kompas (1998), 23 November.
Marquez, Gustavo (1994), “Inside Informal Sector Policies in Latin America:
An Economist’s View”, in Cathy A. Rakowski (ed.), Contrapunto: The
Informal Sector Debates in Latin America, Albany: State University of
New York Press, pp.153-173.
McGee, Terry G. (1975), Hawkers in Selected Southeast Asian Cities: the
Comparative Research Study Outline, Findings and Policy
Recommendations, A report to be presented at a conference on the
Role of Marginal Distribution Systems in Development sponsored by
the International Development Research Centre, Canada, to be held in
Kuala Lumpur, Malaysia, September 23-26.
McGee, Terry G. and Tommy Firman (2000), “Labour Market Adjustment in
the Time of Krismon: Changes in Employment Structure in Indonesia,
1997-98”, Singapore Journal of Tropical Geography, Vol.21, No.3,
pp.316-335.
McGee, Terry G. and Yeung Y.M. (1977), Hawkers in Southeast Asian Cities:
Planning for the Bazaar Economy, Canada: International Development
Research Centre.
Mead, C. Donald, and Christian Morrisson (1996), “The Informal Sector
Elephant”, World Development, Vol.24, No.10, pp.1611-1619.
Pikiran Rakyat (1999), 11 October.
–––––– (1999), 28 August.
Portes, Alejandro, Manuel Castells, and Lauren A. Benton (1989),
“Introduction”, in Alejandro Portes, Manuel Castells, and Lauren A.
Benton (eds.), The Informal Economy: Studies in Advanced and Less
Developed Countries, Baltimore: Johns Hopkins University Press, pp.1-
7.
Ranis, Gustav and Frances Stewart (1999), “The Asian Crisis and Human
Development”, IDS Bulletin, Vol.30, No.1, pp.109-119.
Sethuraman, S.V. (1985), “The Informal Sector in Indonesia: Policies and
Prospects”, International Labour Review, Vol. 124, No. 6, pp.719-
735.
Smyth, Ines (1997), Industrialization and Natural Resources: Household
Adaptive Strategis in Java, Indonesia, Bandung: AKATIGA.
Suharto, Edi (1994), The Role and Performance of Local Organization in
Poverty Alleviation Programs: A Comparative Study in Selected
Villages of Majalengka, Indonesia, Unpublished Master Thesis,
Bangkok: Asian Institute of Technology.
19. Human Development and the Urban Informal Sector in Bandung 133
–––––– (2002), Profiles and Dynamics of the Urban Informal Sector in
Indonesia: A Study of Pedagang Kakilima in Bandung, unpublished
PhD thesis, Massey University, New Zealand.
Tambunan, Tulus (2000), “Small–Scale Industries for Rural Poor in
Indonesia”, in Moha Asri Abdullah and Mohd Isa Bin Baker (eds.),
Small and Medium Enterprises in Asia Pacific Countries, Huntington:
Nova Science Publishers, pp.101-124.
Thomas, J.J. (1995), Surviving in the City: the Urban Informal Sector in Latin
America, London: Pluto Press.
Tinker, Irene (1997), Street Foods: Urban Food and Employment in
Developing Countries, New York: Oxford University Press.
Turner, Sarah (2002), Small Entrepreneurs in Indonesia: Trading on the
Margins, London: Routledge-Curzon.
UNDP (United Nations Development Programme) (1990), Human
Development Report, New York: Oxford University Press.
–––––– (1997), Human Development Report, New York: Oxford University
Press.
World Bank (1994), Indonesia, Environment, and Development: Changes for
the Future, Washington DC: World Bank.