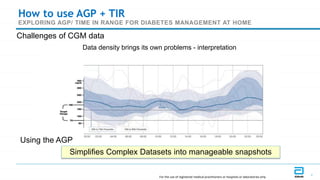
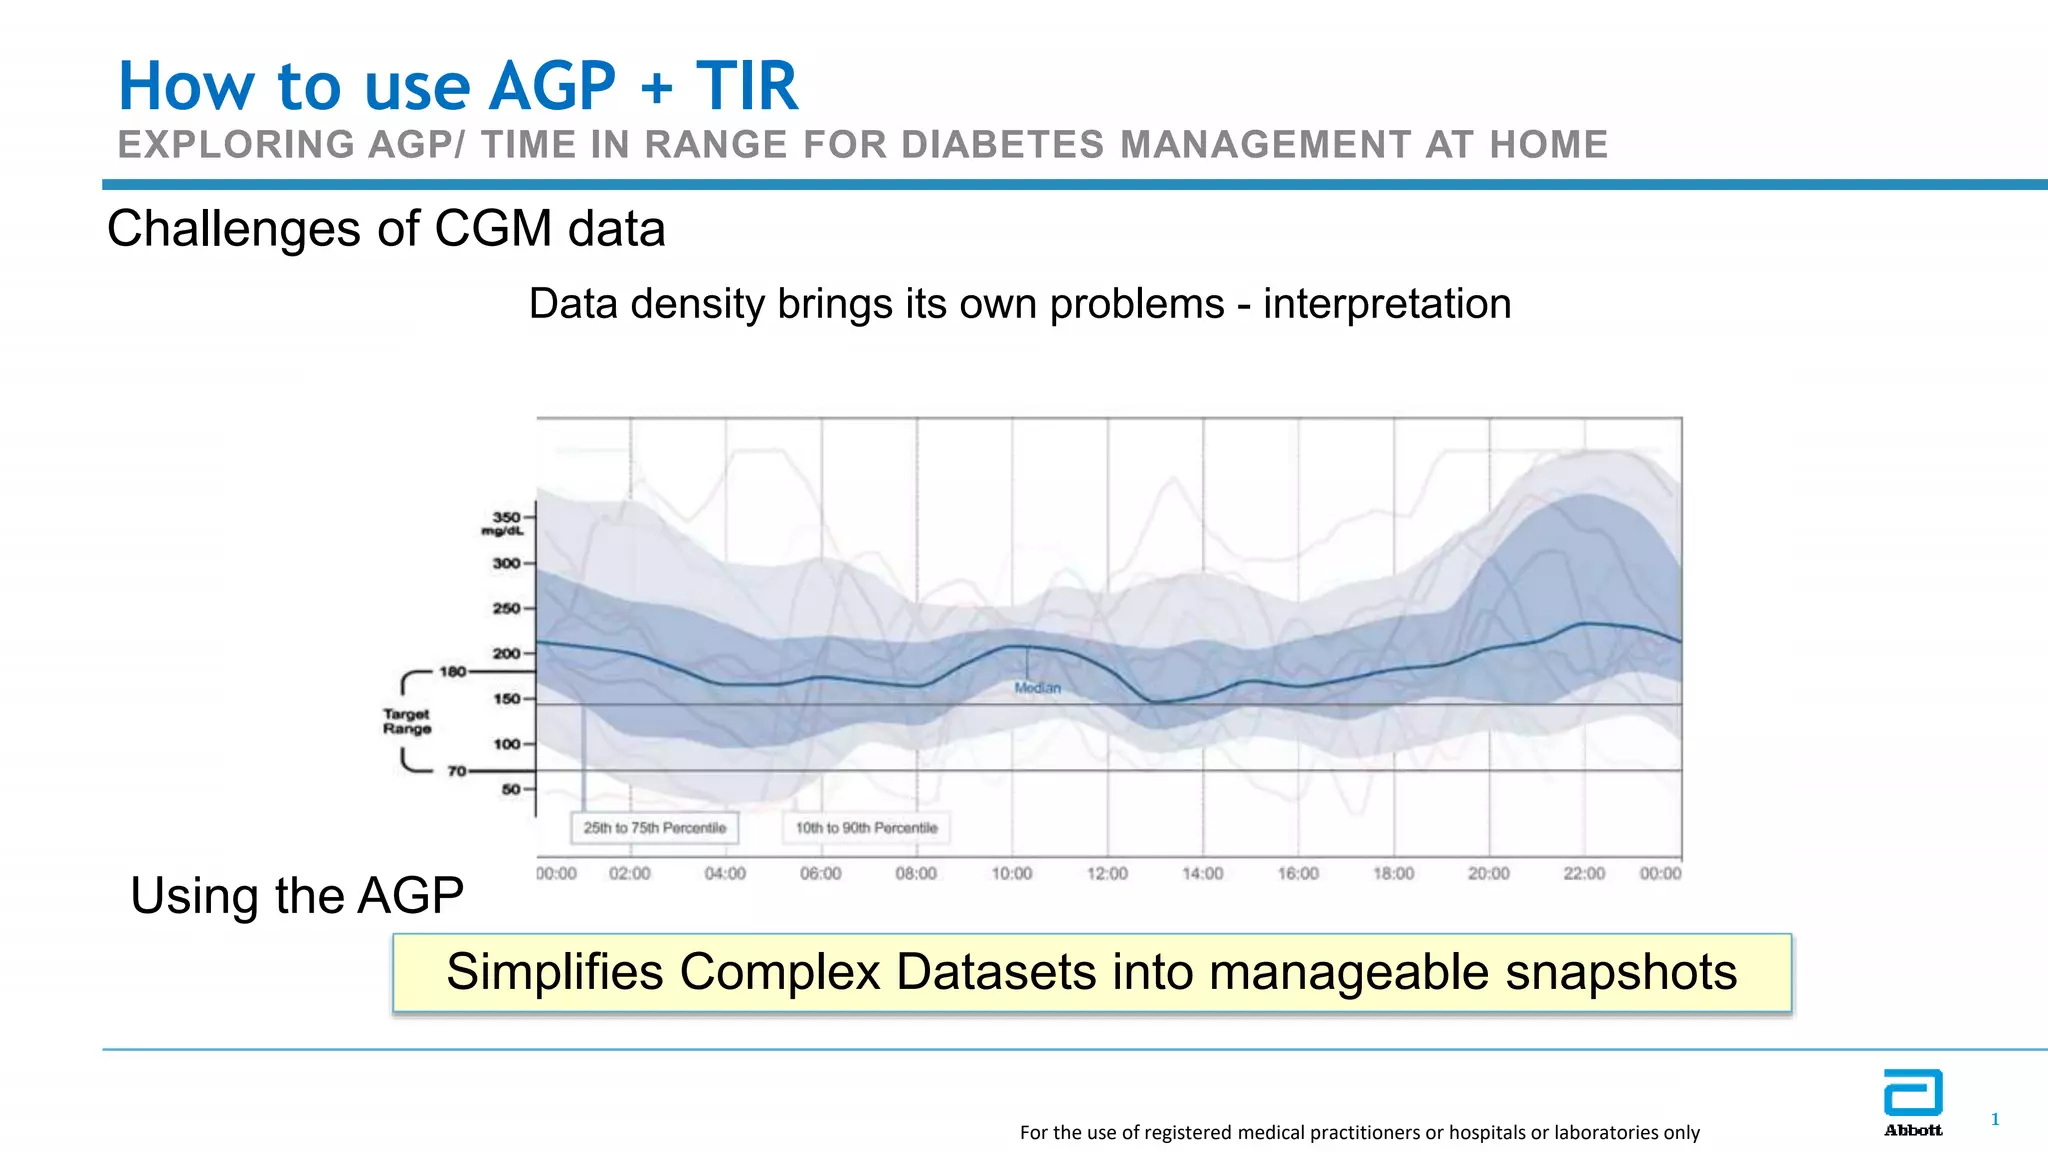
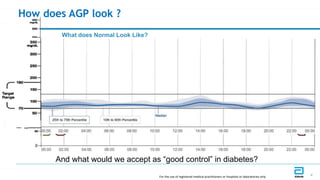
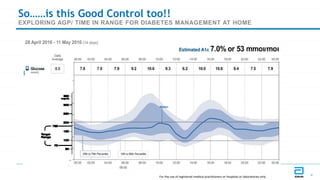
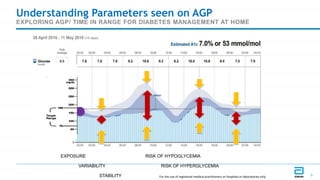
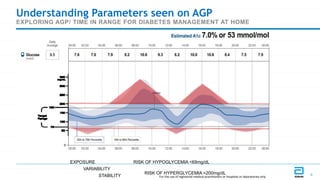
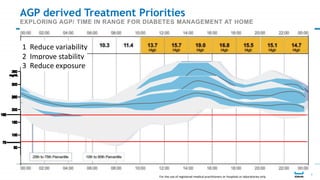
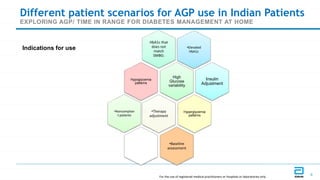
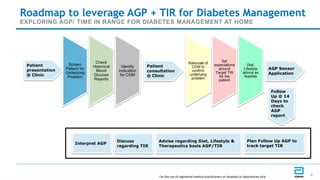
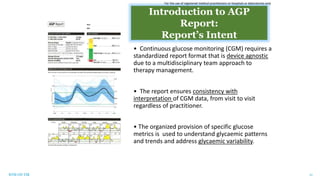
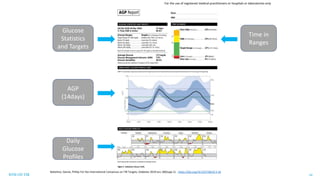
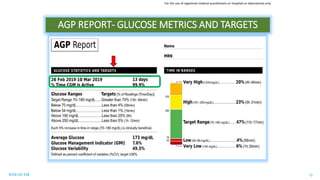
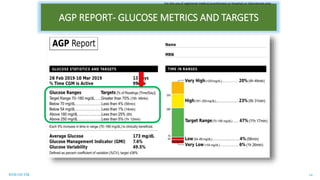
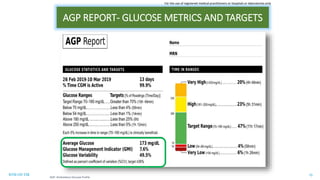
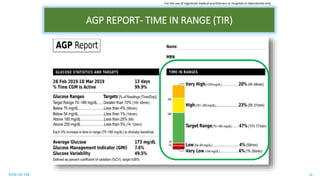
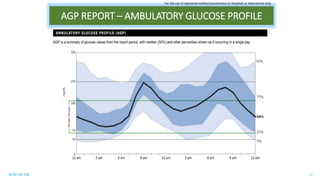
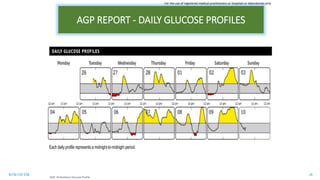
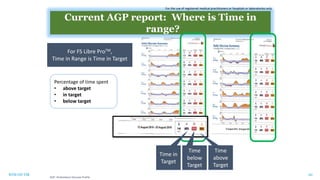
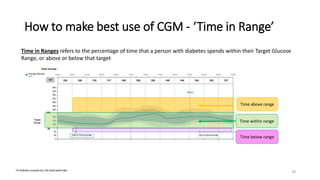
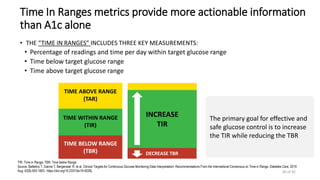
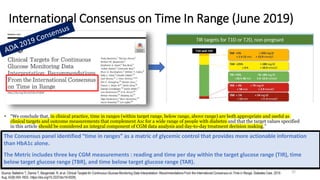
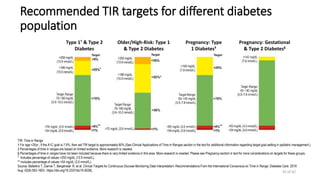
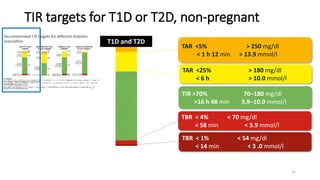
GDS_80000_Title_v1 1
1
Challenges of CGM data
Data density brings its own problems - interpretation
How to use AGP + TIR
EXPLORING AGP/ TIME IN RANGE FOR DIABETES MANAGEMENT AT HOME
Simplifies Complex Datasets into manageable snapshots
Using the AGP
For the use of registered medical practitioners or hospitals or laboratories only
GDS_80000_Title_v1 2
2
What does Normal Look Like?
How does AGP look ?
For the use of registered medical practitioners or hospitals or laboratories only
And what would we accept as “good control” in diabetes?
GDS_80000_Title_v1 3
3
AGP representing Good Diabetes Control
EXPLORING AGP/ TIME IN RANGE FOR DIABETES MANAGEMENT AT HOME
For the use of registered medical practitioners or hospitals or laboratories only
GDS_80000_Title_v1 4
4
So……is this Good Control too!!
EXPLORING AGP/ TIME IN RANGE FOR DIABETES MANAGEMENT AT HOME
For the use of registered medical practitioners or hospitals or laboratories only
GDS_80000_Title_v1 5
5
EXPOSURE
STABILITY
VARIABILITY
RISK OF HYPOGLYCEMIA
RISK OF HYPERGLYCEMIA
Understanding Parameters seen on AGP
EXPLORING AGP/ TIME IN RANGE FOR DIABETES MANAGEMENT AT HOME
For the use of registered medical practitioners or hospitals or laboratories only
GDS_80000_Title_v1 6
6
FGM, AGP AND CLINICAL DECISION-
MAKING
EXPOSURE
STABILITY
VARIABILITY
RISK OF HYPOGLYCEMIA <69mg/dL
RISK OF HYPERGLYCEMIA >200mg/dL
Understanding Parameters seen on AGP
EXPLORING AGP/ TIME IN RANGE FOR DIABETES MANAGEMENT AT HOME
For the use of registered medical practitioners or hospitals or laboratories only
GDS_80000_Title_v1 7
7
1 Reduce variability
2 Improve stability
3 Reduce exposure
AGP derived Treatment Priorities
EXPLORING AGP/ TIME IN RANGE FOR DIABETES MANAGEMENT AT HOME
For the use of registered medical practitioners or hospitals or laboratories only
GDS_80000_Title_v1 8
8
Different patient scenarios for AGP use in Indian Patients
EXPLORING AGP/ TIME IN RANGE FOR DIABETES MANAGEMENT AT HOME
•Elevated
HbA1c
Insulin
Adjustment
HbA1c that
does not
match
SMBG:
High
Glucose
variability
•Noncomplian
t patients
Hypoglycemia
patterns
•Therapy
adjustment
Hyperglycemia
patterns
•Baseline
assessment
Indications for use
For the use of registered medical practitioners or hospitals or laboratories only
GDS_80000_Title_v1 9
9
Roadmap to leverage AGP + TIR for Diabetes Management
EXPLORING AGP/ TIME IN RANGE FOR DIABETES MANAGEMENT AT HOME
For the use of registered medical practitioners or hospitals or laboratories only
Patient
presentation
@ Clinic
AGP Sensor
Application
Patient
consultation
@ Clinic
Screen
Patient for
Underlying
Problem
Check
Historical
Blood
Glucose
Reports
Identify
Indication
for CGM
Rationale of
CGM to
confirm
underlying
problem
Set
expectations
around
Target TIR
for the
patient
Diet,
Lifestyle
advice as
feasible
Interpret AGP
Follow
Up @ 14
Days to
check
AGP
report
Advise regarding Diet, Lifestyle &
Therapeutics basis AGP/TIR
Discuss
regarding TIR
Plan Follow Up AGP to
track target TIR
RTM ON TIR 10
• Why deep dive into Time In Range
• Evidence around AGP + Time in Range
• International consensus on Time in Range
• Guide to Interpreting the AGP Report
For the use of registered medical practitioners or hospitals or laboratories only
RTM ON TIR 11
• Continuous glucose monitoring (CGM) requires a
standardized report format that is device agnostic
due to a multidisciplinary team approach to
therapy management.
• The report ensures consistency with
interpretation of CGM data, from visit to visit
regardless of practitioner.
• The organized provision of specific glucose
metrics is used to understand glycaemic patterns
and trends and address glycaemic variability.
Introduction to AGP
Report:
Report’s Intent
For the use of registered medical practitioners or hospitals or laboratories only
RTM ON TIR 12
AGP
(14days)
Glucose
Statistics
and Targets
Daily
Glucose
Profiles
Battelino, Danne, Phillip For the International Consensus on TIR Targets; Diabetes 2019 Jun; 68(Supp 1): . https://doi.org/10.2337/db19-2-LB
Time in
Ranges
For the use of registered medical practitioners or hospitals or laboratories only
RTM ON TIR 13
AGP REPORT- GLUCOSE METRICS AND TARGETS
For the use of registered medical practitioners or hospitals or laboratories only
RTM ON TIR 14
AGP REPORT- GLUCOSE METRICS AND TARGETS
For the use of registered medical practitioners or hospitals or laboratories only
RTM ON TIR 15
AGP REPORT- GLUCOSE METRICS AND TARGETS
AGP: Ambulatory Glucose Profile
For the use of registered medical practitioners or hospitals or laboratories only
RTM ON TIR 16
AGP REPORT- TIME IN RANGE (TIR)
For the use of registered medical practitioners or hospitals or laboratories only
RTM ON TIR 17
AGP REPORT – AMBULATORY GLUCOSE PROFILE
For the use of registered medical practitioners or hospitals or laboratories only
RTM ON TIR 18
AGP REPORT - DAILY GLUCOSE PROFILES
AGP: Ambulatory Glucose Profile
For the use of registered medical practitioners or hospitals or laboratories only
RTM ON TIR 19
is Time in range applicable to Freestyle
libre proTM ?
For FreeStyle Libre ProTM,
‘Time in Range’ is ‘Time in
Target’
For the use of registered medical practitioners or hospitals or laboratories only
RTM ON TIR 20
Percentage of time spent
• above target
• in target
• below target
Current AGP report: Where is Time in
range?
Time in
Target
Time
above
Target
Time
below
Target
For FS Libre ProTM,
Time in Range is Time in Target
AGP: Ambulatory Glucose Profile
For the use of registered medical practitioners or hospitals or laboratories only
RTM ON TIR 21
Summary: Time in Range
“It has been concluded that, in clinical practice, time in
ranges (within target range, below range, above range)
are both appropriate and useful as clinical targets and
outcome measurements that complement A1C for a
wide range of people with diabetes and that the target
values specified in this article should be considered an
integral component of CGM data analysis and day-to-
day treatment decision making.”
For the use of registered medical practitioners or hospitals or laboratories only
RTM ON TIR 22
• EVOLUTION ALWAYS HAS A STORY
CGM
AGP
TIR
For the use of registered medical practitioners or hospitals or laboratories only
• FreeStyle Libre® measures glucose in the interstitial fluid in subcutaneous tissue.
• Glucose in interstitial fluid has proven to be a reliable indicator of blood sugar values,
because glucose freely diffuses into intercellular space from the capillaries.1
• The glucose diffusion between the capillary vessel and intercellular fluid has a delay of
approx. 5-10 minutes.2
Glucose measurement in interstitial fluid
1Rebrin K et Steil GM. Can interstitial glucose assessment replace blood glucose measurements? Diabetes Technology Ther . 2000; 2(3):461-472.
2Rebrin K et al. Use of subcutaneous interstitial fluid glucose to estimate blood glucose: Revisiting delay and sensor offset. J Diabetes Sci Technol.
2010;4(5): 1087-1098.
.
Understanding CGM information: Physiologic lag
• When glucose levels are stable or
changing slowly → the readings can
be similar1
•
1. Cengiz, et al. Diab Tech Ther 2009;11.S1: S-11
2. Rebrin, et al. J Diab Sci Tech; 2010; 4(5): 1087-98 This material is considered confidential and should not be reproduced, distributed or excerpted.
When glucose readings are changing
rapidly ↓↑, the numbers can be quite
different, lag times may be longer2
Interstitial glucose readings tend to
lag blood glucose readings by ~5 to 10
minutes2
24 of 107
24
Blood Glucose won’t always match sensor glucose
Understanding blood glucose vs sensor discrepancies
This material is considered confidential and should not be reproduced, distributed or excerpted. 26 of 107
26
Continuous glucose data reveals readings that traditional monitoring may miss.
Traditional blood glucose testing (24 hrs) Continuous monitoring
Bode BW, Schwartz S, Stubbs HA, Block JE. Glycemic characteristic in continuously monitored patients with type 1 and type 2 diabetes. Diabetes Care. 2005 October;28(10):2361-6
Images are for illustration purposes only
Even frequent testers often miss significant glucose fluctuations.
Journey from SMBG to CGM
(Continuous Glucose Monitoring)
27
Role of A1c in Landscape of Glucose
Monitoring
Source: Dunn TC, Hayter GA, Doniger KJ, Wolpert HA. “Development of the Likelihood of Low Glucose (LLG) Algorithm for Evaluating Risk
of Hypoglycemia: A New Approach for Using Continuous Glucose Data to Guide Therapeutic Decision Making”. Journal of Diabetes
For illustration purposes only. Not actual patient data.
1. Dunn TC, Hayter GA, Doniger KJ, Wolpert HA. Development of the likelihood of low glucose (LLG) algorithm for evaluating risk of hypoglycemia: A
new approach for using continuous glucose data to guide
therapeutic decision making. J Diabetes Sci Technol. Published online 17 April 2014.
28
Time within range
Time in Ranges refers to the percentage of time that a person with diabetes spends within their Target Glucose
Range, or above or below that target
Time above range
Time below range
For illustration purposes only. Not actual patient data.
How to make best use of CGM - ‘Time in Range’
29
Time In Ranges metrics provide more actionable information
than A1c alone
TIR: Time in Range; TBR: Time below Range
Source: Battelino T, Danne T, Bergenstal R, et al. Clinical Targets for Continuous Glucose Monitoring Data Interpretation: Recommendations From the International Consensus on Time in Range. Diabetes Care. 2019
Aug; 42(8):593-1603.: https://doi.org/10.2337/dci19-0028).
• THE “TIME IN RANGES” INCLUDES THREE KEY MEASUREMENTS:
• Percentage of readings and time per day within target glucose range
• Time below target glucose range
• Time above target glucose range
The primary goal for effective and
safe glucose control is to increase
the TIR while reducing the TBR
INCREASE
TIR
TIME WITHIN RANGE
(TIR)
TIME ABOVE RANGE
(TAR)
TIME BELOW RANGE
(TBR) DECREASE TBR
30 of 42
The Consensus panel identified “time in ranges” as a matric of glycemic control that provides more actionable information
than HbA1c alone.
The Metric includes three key CGM measurements : reading and time per day within the target glucose range (TIR), time
below target glucose range (TBR), and time below target glucose range (TAR).
• “We conclude that, in clinical practice, time in ranges (within target range, below range, above range) are both appropriate and useful as
clinical targets and outcome measurements that complement A1c for a wide range of people with diabetes and that the target values specified
in this article should be considered an integral component of CGM data analysis and day-to-day treatment decision making.”
International Consensus on Time In Range (June 2019)
Source: Battelino T, Danne T, Bergenstal R, et al. Clinical Targets for Continuous Glucose Monitoring Data Interpretation: Recommendations From the International Consensus on Time in Range. Diabetes Care. 2019
Aug; 42(8):593-1603.: https://doi.org/10.2337/dci19-0028).
31
Recommended TIR targets for different diabetes
population
TIR: Time in Range
† For age <25yr., if the A1C goal is 7.5%, then set TIR target to approximately 60% (See Clinical Applications of Time in Ranges section in the text for additional information regarding target goal setting in pediatric management.).
‡ Percentages of time in ranges are based on limited evidence. More research is needed.
§ Percentages of time in ranges have not been included because there is very limited evidence in this area. More research is needed. Please see Pregnancy section in text for more considerations on targets for these groups.
* Includes percentage of values >250 mg/dL (13.9 mmol/L).
** Includes percentage of values <54 mg/dL (3.0 mmol/L).
Source: Battelino T, Danne T, Bergenstal R, et al. Clinical Targets for Continuous Glucose Monitoring Data Interpretation: Recommendations From the International Consensus on Time in Range. Diabetes Care. 2019
Aug; 42(8):593-1603.: https://doi.org/10.2337/dci19-0028).
Type 1† & Type 2
Diabetes
Older/High-Risk: Type 1
& Type 2 Diabetes
Pregnancy: Type
1 Diabetes‡
Pregnancy: Gestational
& Type 2 Diabetes§
32 of 42
TIR >70% 70–180 mg/dl
>16 h 48 min 3.9–10.0 mmol/l
TAR <25% > 180 mg/dl
< 6 h > 10.0 mmol/l
T1D and T2D
TAR <5% > 250 mg/dl
< 1 h 12 min > 13.9 mmol/l
TBR < 4% < 70 mg/dl
< 58 min < 3.9 mmol/l
TBR < 1% < 54 mg/dl
< 14 min < 3 .0 mmol/l
TIR targets for T1D or T2D, non-pregnant
33

Interpretation of CGM .pptx

  • 1.
    GDS_80000_Title_v1 1 1 Challenges ofCGM data Data density brings its own problems - interpretation How to use AGP + TIR EXPLORING AGP/ TIME IN RANGE FOR DIABETES MANAGEMENT AT HOME Simplifies Complex Datasets into manageable snapshots Using the AGP For the use of registered medical practitioners or hospitals or laboratories only
  • 2.
    GDS_80000_Title_v1 2 2 What doesNormal Look Like? How does AGP look ? For the use of registered medical practitioners or hospitals or laboratories only And what would we accept as “good control” in diabetes?
  • 3.
    GDS_80000_Title_v1 3 3 AGP representingGood Diabetes Control EXPLORING AGP/ TIME IN RANGE FOR DIABETES MANAGEMENT AT HOME For the use of registered medical practitioners or hospitals or laboratories only
  • 4.
    GDS_80000_Title_v1 4 4 So……is thisGood Control too!! EXPLORING AGP/ TIME IN RANGE FOR DIABETES MANAGEMENT AT HOME For the use of registered medical practitioners or hospitals or laboratories only
  • 5.
    GDS_80000_Title_v1 5 5 EXPOSURE STABILITY VARIABILITY RISK OFHYPOGLYCEMIA RISK OF HYPERGLYCEMIA Understanding Parameters seen on AGP EXPLORING AGP/ TIME IN RANGE FOR DIABETES MANAGEMENT AT HOME For the use of registered medical practitioners or hospitals or laboratories only
  • 6.
    GDS_80000_Title_v1 6 6 FGM, AGPAND CLINICAL DECISION- MAKING EXPOSURE STABILITY VARIABILITY RISK OF HYPOGLYCEMIA <69mg/dL RISK OF HYPERGLYCEMIA >200mg/dL Understanding Parameters seen on AGP EXPLORING AGP/ TIME IN RANGE FOR DIABETES MANAGEMENT AT HOME For the use of registered medical practitioners or hospitals or laboratories only
  • 7.
    GDS_80000_Title_v1 7 7 1 Reducevariability 2 Improve stability 3 Reduce exposure AGP derived Treatment Priorities EXPLORING AGP/ TIME IN RANGE FOR DIABETES MANAGEMENT AT HOME For the use of registered medical practitioners or hospitals or laboratories only
  • 8.
    GDS_80000_Title_v1 8 8 Different patientscenarios for AGP use in Indian Patients EXPLORING AGP/ TIME IN RANGE FOR DIABETES MANAGEMENT AT HOME •Elevated HbA1c Insulin Adjustment HbA1c that does not match SMBG: High Glucose variability •Noncomplian t patients Hypoglycemia patterns •Therapy adjustment Hyperglycemia patterns •Baseline assessment Indications for use For the use of registered medical practitioners or hospitals or laboratories only
  • 9.
    GDS_80000_Title_v1 9 9 Roadmap toleverage AGP + TIR for Diabetes Management EXPLORING AGP/ TIME IN RANGE FOR DIABETES MANAGEMENT AT HOME For the use of registered medical practitioners or hospitals or laboratories only Patient presentation @ Clinic AGP Sensor Application Patient consultation @ Clinic Screen Patient for Underlying Problem Check Historical Blood Glucose Reports Identify Indication for CGM Rationale of CGM to confirm underlying problem Set expectations around Target TIR for the patient Diet, Lifestyle advice as feasible Interpret AGP Follow Up @ 14 Days to check AGP report Advise regarding Diet, Lifestyle & Therapeutics basis AGP/TIR Discuss regarding TIR Plan Follow Up AGP to track target TIR
  • 10.
    RTM ON TIR10 • Why deep dive into Time In Range • Evidence around AGP + Time in Range • International consensus on Time in Range • Guide to Interpreting the AGP Report For the use of registered medical practitioners or hospitals or laboratories only
  • 11.
    RTM ON TIR11 • Continuous glucose monitoring (CGM) requires a standardized report format that is device agnostic due to a multidisciplinary team approach to therapy management. • The report ensures consistency with interpretation of CGM data, from visit to visit regardless of practitioner. • The organized provision of specific glucose metrics is used to understand glycaemic patterns and trends and address glycaemic variability. Introduction to AGP Report: Report’s Intent For the use of registered medical practitioners or hospitals or laboratories only
  • 12.
    RTM ON TIR12 AGP (14days) Glucose Statistics and Targets Daily Glucose Profiles Battelino, Danne, Phillip For the International Consensus on TIR Targets; Diabetes 2019 Jun; 68(Supp 1): . https://doi.org/10.2337/db19-2-LB Time in Ranges For the use of registered medical practitioners or hospitals or laboratories only
  • 13.
    RTM ON TIR13 AGP REPORT- GLUCOSE METRICS AND TARGETS For the use of registered medical practitioners or hospitals or laboratories only
  • 14.
    RTM ON TIR14 AGP REPORT- GLUCOSE METRICS AND TARGETS For the use of registered medical practitioners or hospitals or laboratories only
  • 15.
    RTM ON TIR15 AGP REPORT- GLUCOSE METRICS AND TARGETS AGP: Ambulatory Glucose Profile For the use of registered medical practitioners or hospitals or laboratories only
  • 16.
    RTM ON TIR16 AGP REPORT- TIME IN RANGE (TIR) For the use of registered medical practitioners or hospitals or laboratories only
  • 17.
    RTM ON TIR17 AGP REPORT – AMBULATORY GLUCOSE PROFILE For the use of registered medical practitioners or hospitals or laboratories only
  • 18.
    RTM ON TIR18 AGP REPORT - DAILY GLUCOSE PROFILES AGP: Ambulatory Glucose Profile For the use of registered medical practitioners or hospitals or laboratories only
  • 19.
    RTM ON TIR19 is Time in range applicable to Freestyle libre proTM ? For FreeStyle Libre ProTM, ‘Time in Range’ is ‘Time in Target’ For the use of registered medical practitioners or hospitals or laboratories only
  • 20.
    RTM ON TIR20 Percentage of time spent • above target • in target • below target Current AGP report: Where is Time in range? Time in Target Time above Target Time below Target For FS Libre ProTM, Time in Range is Time in Target AGP: Ambulatory Glucose Profile For the use of registered medical practitioners or hospitals or laboratories only
  • 21.
    RTM ON TIR21 Summary: Time in Range “It has been concluded that, in clinical practice, time in ranges (within target range, below range, above range) are both appropriate and useful as clinical targets and outcome measurements that complement A1C for a wide range of people with diabetes and that the target values specified in this article should be considered an integral component of CGM data analysis and day-to- day treatment decision making.” For the use of registered medical practitioners or hospitals or laboratories only
  • 22.
    RTM ON TIR22 • EVOLUTION ALWAYS HAS A STORY CGM AGP TIR For the use of registered medical practitioners or hospitals or laboratories only
  • 23.
    • FreeStyle Libre®measures glucose in the interstitial fluid in subcutaneous tissue. • Glucose in interstitial fluid has proven to be a reliable indicator of blood sugar values, because glucose freely diffuses into intercellular space from the capillaries.1 • The glucose diffusion between the capillary vessel and intercellular fluid has a delay of approx. 5-10 minutes.2 Glucose measurement in interstitial fluid 1Rebrin K et Steil GM. Can interstitial glucose assessment replace blood glucose measurements? Diabetes Technology Ther . 2000; 2(3):461-472. 2Rebrin K et al. Use of subcutaneous interstitial fluid glucose to estimate blood glucose: Revisiting delay and sensor offset. J Diabetes Sci Technol. 2010;4(5): 1087-1098. .
  • 24.
    Understanding CGM information:Physiologic lag • When glucose levels are stable or changing slowly → the readings can be similar1 • 1. Cengiz, et al. Diab Tech Ther 2009;11.S1: S-11 2. Rebrin, et al. J Diab Sci Tech; 2010; 4(5): 1087-98 This material is considered confidential and should not be reproduced, distributed or excerpted. When glucose readings are changing rapidly ↓↑, the numbers can be quite different, lag times may be longer2 Interstitial glucose readings tend to lag blood glucose readings by ~5 to 10 minutes2 24 of 107 24
  • 25.
    Blood Glucose won’talways match sensor glucose
  • 26.
    Understanding blood glucosevs sensor discrepancies This material is considered confidential and should not be reproduced, distributed or excerpted. 26 of 107 26
  • 27.
    Continuous glucose datareveals readings that traditional monitoring may miss. Traditional blood glucose testing (24 hrs) Continuous monitoring Bode BW, Schwartz S, Stubbs HA, Block JE. Glycemic characteristic in continuously monitored patients with type 1 and type 2 diabetes. Diabetes Care. 2005 October;28(10):2361-6 Images are for illustration purposes only Even frequent testers often miss significant glucose fluctuations. Journey from SMBG to CGM (Continuous Glucose Monitoring) 27
  • 28.
    Role of A1cin Landscape of Glucose Monitoring Source: Dunn TC, Hayter GA, Doniger KJ, Wolpert HA. “Development of the Likelihood of Low Glucose (LLG) Algorithm for Evaluating Risk of Hypoglycemia: A New Approach for Using Continuous Glucose Data to Guide Therapeutic Decision Making”. Journal of Diabetes For illustration purposes only. Not actual patient data. 1. Dunn TC, Hayter GA, Doniger KJ, Wolpert HA. Development of the likelihood of low glucose (LLG) algorithm for evaluating risk of hypoglycemia: A new approach for using continuous glucose data to guide therapeutic decision making. J Diabetes Sci Technol. Published online 17 April 2014. 28
  • 29.
    Time within range Timein Ranges refers to the percentage of time that a person with diabetes spends within their Target Glucose Range, or above or below that target Time above range Time below range For illustration purposes only. Not actual patient data. How to make best use of CGM - ‘Time in Range’ 29
  • 30.
    Time In Rangesmetrics provide more actionable information than A1c alone TIR: Time in Range; TBR: Time below Range Source: Battelino T, Danne T, Bergenstal R, et al. Clinical Targets for Continuous Glucose Monitoring Data Interpretation: Recommendations From the International Consensus on Time in Range. Diabetes Care. 2019 Aug; 42(8):593-1603.: https://doi.org/10.2337/dci19-0028). • THE “TIME IN RANGES” INCLUDES THREE KEY MEASUREMENTS: • Percentage of readings and time per day within target glucose range • Time below target glucose range • Time above target glucose range The primary goal for effective and safe glucose control is to increase the TIR while reducing the TBR INCREASE TIR TIME WITHIN RANGE (TIR) TIME ABOVE RANGE (TAR) TIME BELOW RANGE (TBR) DECREASE TBR 30 of 42
  • 31.
    The Consensus panelidentified “time in ranges” as a matric of glycemic control that provides more actionable information than HbA1c alone. The Metric includes three key CGM measurements : reading and time per day within the target glucose range (TIR), time below target glucose range (TBR), and time below target glucose range (TAR). • “We conclude that, in clinical practice, time in ranges (within target range, below range, above range) are both appropriate and useful as clinical targets and outcome measurements that complement A1c for a wide range of people with diabetes and that the target values specified in this article should be considered an integral component of CGM data analysis and day-to-day treatment decision making.” International Consensus on Time In Range (June 2019) Source: Battelino T, Danne T, Bergenstal R, et al. Clinical Targets for Continuous Glucose Monitoring Data Interpretation: Recommendations From the International Consensus on Time in Range. Diabetes Care. 2019 Aug; 42(8):593-1603.: https://doi.org/10.2337/dci19-0028). 31
  • 32.
    Recommended TIR targetsfor different diabetes population TIR: Time in Range † For age <25yr., if the A1C goal is 7.5%, then set TIR target to approximately 60% (See Clinical Applications of Time in Ranges section in the text for additional information regarding target goal setting in pediatric management.). ‡ Percentages of time in ranges are based on limited evidence. More research is needed. § Percentages of time in ranges have not been included because there is very limited evidence in this area. More research is needed. Please see Pregnancy section in text for more considerations on targets for these groups. * Includes percentage of values >250 mg/dL (13.9 mmol/L). ** Includes percentage of values <54 mg/dL (3.0 mmol/L). Source: Battelino T, Danne T, Bergenstal R, et al. Clinical Targets for Continuous Glucose Monitoring Data Interpretation: Recommendations From the International Consensus on Time in Range. Diabetes Care. 2019 Aug; 42(8):593-1603.: https://doi.org/10.2337/dci19-0028). Type 1† & Type 2 Diabetes Older/High-Risk: Type 1 & Type 2 Diabetes Pregnancy: Type 1 Diabetes‡ Pregnancy: Gestational & Type 2 Diabetes§ 32 of 42
  • 33.
    TIR >70% 70–180mg/dl >16 h 48 min 3.9–10.0 mmol/l TAR <25% > 180 mg/dl < 6 h > 10.0 mmol/l T1D and T2D TAR <5% > 250 mg/dl < 1 h 12 min > 13.9 mmol/l TBR < 4% < 70 mg/dl < 58 min < 3.9 mmol/l TBR < 1% < 54 mg/dl < 14 min < 3 .0 mmol/l TIR targets for T1D or T2D, non-pregnant 33

Editor's Notes

  • #25 Need to note that sensor lag is another source of lag. Sensors try to account for physiologic lag in the algorithms, but are also subject to other factors affecting lag: substances, etc.  (kk may create another slide for 'sensor lag' and Udo Hoss info.
  • #32 This international consensus report has been endorsed by the American Diabetes Association, American Association of Clinical Endocrinologists, American Association of Diabetes Educators, European Association for the Study of Diabetes, Foundation of European Nurses in Diabetes, International Society for Pediatric and Adolescent Diabetes, JDRF and Paediatric Endocrine Society.
  • #33 For T1D/T2D, non-pregnant: >70% of time/day in target range (70-180mg/dL). For age <25 years, if A1c is 7.5%, TIR target is 60% For older/high risk: >50% of time/day in target range (70-180mg/dL) Older: age not defined, but noted to have higher risk for severe hypoglycaemia High risk: higher risk for complications, comorbid conditions (e.g. renal disease), require assisted care Each incremental 5% in TIR is associated with clinically significant benefits
  • #34 1% of a day= 15mins