
Recommended
More Related Content
Similar to MGMT 305 CHAPTER 14a EXERCISES
Similar to MGMT 305 CHAPTER 14a EXERCISES (20)
More from DleenBrowns
More from DleenBrowns (6)
Recently uploaded
Recently uploaded (20)
MGMT 305 CHAPTER 14a EXERCISES
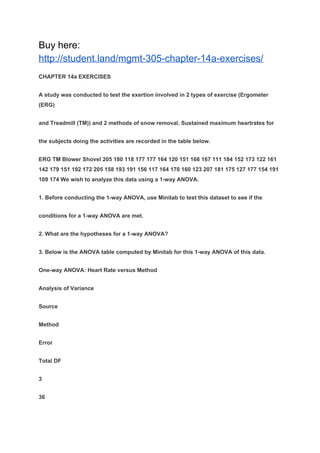
- 1. Buy here: http://student.land/mgmt-305-chapter-14a-exercises/ CHAPTER 14a EXERCISES A study was conducted to test the exertion involved in 2 types of exercise (Ergometer (ERG) and Treadmill (TM)) and 2 methods of snow removal. Sustained maximum heartrates for the subjects doing the activities are recorded in the table below. ERG TM Blower Shovel 205 180 118 177 177 164 120 151 166 167 111 184 152 173 122 161 142 179 151 192 172 205 158 193 191 156 117 164 170 160 123 207 181 175 127 177 154 191 109 174 We wish to analyze this data using a 1-way ANOVA. 1. Before conducting the 1-way ANOVA, use Minitab to test this dataset to see if the conditions for a 1-way ANOVA are met. 2. What are the hypotheses for a 1-way ANOVA? 3. Below is the ANOVA table computed by Minitab for this 1-way ANOVA of this data. One-way ANOVA: Heart Rate versus Method Analysis of Variance Source Method Error Total DF 3 36
- 2. 39 Adj SS 19805 10744 30550 Adj MS 6601.7 298.5 F-Value 22.12 P-Value 0.000 Assuming the conditions for a valid 1-way ANOVA are met, interpret the p-value of this test. 4. Given the results of this test, what is the next step in the 1-way ANOVA testing process? 1 5. Further output for the 1-way ANOVA is shown below. What conclusion(s) do you draw from this output? Tukey Pairwise Comparisons Grouping Information Using the Tukey Method and 95% Confidence Method Treadmill Snow Shovel Arm-Crank Ergometer Snow Blower N 10 10 10
- 3. 10 Mean 178.00 175.00 171.00 123.60 Grouping A A A B Tukey Simultaneous 95% CIs Differences of Means for Heart Rate Snow Shovel - Arm-Crank Er Snow Thrower - Arm-Crank Er Treadmill - Arm-Crank Er Snow Thrower - Snow Shovel Treadmill - Snow Shovel Treadmill - Snow Thrower -80 -60 -40 -20 0 20 40 60 80 If an interval does not contain zero, the corresponding means are significantly different. 6. How can we test the data if we cannot establish that the samples were drawn (or were reasonably likely to be drawn) from a normal population? For that, we need a 2 distribution free test. The distribution free equivalent of 1-way ANOVA is called the Kruskal-Wallis Test. Suppose your data analyst performs a Kruskal-Wallis test of the above data and reports a p-value of 0.0056. What further information do you need about this test in order to interpret this p-value? 3