
Recommended
More Related Content
Similar to Player analysis
Similar to Player analysis (20)
Recently uploaded
Recently uploaded (20)
Player analysis
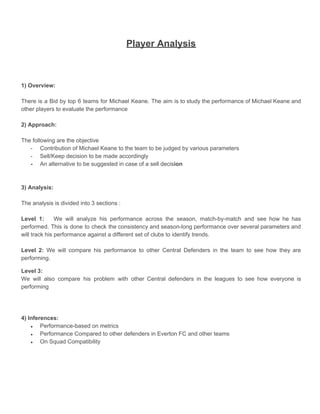
- 1. Player Analysis 1) Overview: There is a Bid by top 6 teams for Michael Keane. The aim is to study the performance of Michael Keane and other players to evaluate the performance 2) Approach: The following are the objective - Contribution of Michael Keane to the team to be judged by various parameters - Sell/Keep decision to be made accordingly - An alternative to be suggested in case of a sell decision 3) Analysis: The analysis is divided into 3 sections : Level 1: We will analyze his performance across the season, match-by-match and see how he has performed. This is done to check the consistency and season-long performance over several parameters and will track his performance against a different set of clubs to identify trends. Level 2: We will compare his performance to other Central Defenders in the team to see how they are performing. Level 3: We will also compare his problem with other Central defenders in the leagues to see how everyone is performing 4) Inferences: ● Performance-based on metrics ● Performance Compared to other defenders in Everton FC and other teams ● On Squad Compatibility
- 2. The Analysis of the Central Defender: Level 1 Analysis: Analysis of Michael Keane For Analyzing Michael Keane and Other CBs, we have put the metrics into different categories - Overall Score - Positioning and Aggressiveness - Aerial and set-piece ability - Passing Ability and style Passing Map of Michael Keane Fig. 1. Successful passes 2. Unsuccessful On the left, that is a successful passing map and on the right is unsuccessful. As we can see that the pass on the high pitch are less successful and the majority of the passes are directed towards the right side of the field Heatmap on the pitch: where does he play Keane prefers his side of the right side centre back, he prefers to go straight ahead instead of getting dragged to wings
- 3. Passing 1. Passing style Fig. showing the passing style of Michael Keane Considering all the parameters of Keane and comparing it to other defenders in Everton FC, we see that - Keane on average goes more into defensive duels as compared to other defenders in the team showing an aggressive side. He also has tackle rate of 0.7 per 90 min, while he has the highest aerial dual rate in the team *He plays on the front food combining interceptions and duels Fig. Showing the different attributes of Michael Keane
- 4. Level 2 Analysis : Analysis of Michael Keane with other Defender in the team
- 5. Range of Passing Center-backs find themselves in the middle of the pitch most of the time when in possession. They are the building blocks when maintaining possession and starting the attack from the back. They need pLayer to have quarter-back abilities to find a pass, whether it’s a short one to a midfielder or a long pass in behind the opposition’s defensive unit. Since central defenders are in the middle of the pitch, they need to be technically able to switch the play with a pass in a variety of ways Fig. Top row 1. Kurt Zouma 2. Michael Keane 3. Phil Jagielka Second row 4. Mason Holgate 5. Yerry Mina Passing style of each player
- 6. Fig. Different passing style of each player Depth of each player Fig. Top row 1.Michael Keane 2. Kurt Zouma 3. Yerry Mina Second row 4. Mason Holgate 5. Phil Jagielka How the attributes are related Fig. Correlation between different attributes
- 7. The variation of Blocks, Interception with Tackle
- 8. Level 3 Analysis : A. comparison of different players; By Match and By overall The score consistency across the season show that Keane has been the mainstay of the team with different players excelling sporadically. Thi shows that he has been the most important defender in the team
- 9. - Radar Graph of players 1) Based on Analysis of Michael Keane with other Defender in the team, he comes out as the best performer when compared through the chosen parameters 2) Keane’s passing distribution heat map shows that apart from holding the ball at the back he tries to attempt a lot of forwarding play which includes a decent number of long balls 3) Keane’s position is closest to the ideal player position in the Interception vs Block, Interception vs Tackle and Tackle vs Block charts 4) Keane comes out as the most consistent player when compared on the basis of score per game through the season 5) In the overall comparison hexagon chart, only 6/24 data points lie outside Keane’s hexagon stating Keane to be the most wholesome defender in the team Verdict - Don’t sell Keane for 40Mill. One reason Keane can be sold is to find a player with similar attributes for a much lower price so the transaction ends up in monetary profits and no loss in player quality. Similar Player to Keane : Matthijis de Ligt: It will be difficult to buy him as the prices are higher John Stones: It will be difficult to buy a player from a top 6 club Robin Koch: This is a young player showed improvement in the performance so if anyhow Keane leaves the club, Robin Koch should be bought.
- 10. Data Modelling : Scoring Model: The aim is to create a defensive score of each player match-by-match as well as the individual score across the season. The attributes chosen are the must have for the Central Defender. I have not included the attributes which are good to have. Each attribute is allocated a score based on the weighted mean to compete for the score. This is done to give the relative importance to each attribute 1. Defensive Duel 10.0 2. Interception 09.3 3. Successful Tackle 10.0 4. Aerial Duel 08.7 5. Blocked Cross 06.0 6. Blocked A Shot 07.7 7. Tackle Attempt 07.3 8. Ball Recovered 07.7 K-Means clustering : In this clustering, the players were grouped together in a way that objects in the same cluster are more similar to each other than to objects in other clusters. The similarity is a metric that reflects the strength of the relationship between two data objects. Cosine similarity It is a measure of similarity between two non-zero vectors of an inner product space that measures the cosine of the angle between them. Each player is considered a vector and the similarity of each vector is taken out with Michael Keane. This method is Is then supported by the Euclidean distance method considering its a higher dimension analysis. For cosine similarity, if the value is high then it means the angle between the vectors is less and they are most whereas in Euclidean distance, lesser the distance similar the player Fig. Clustering of the players based on the attributes
- 11. Principal Component Analysis is a Linear dimensionality reduction using Singular Value Decomposition of the data to project it to a lower dimensional space. The input data is centered but not scaled for each feature before applying the SVD. Fig. Clustering of the players based the attributes after the PCA Choosing the optimal K Things That can be done as to do list : 1. The game date can be used to compare performances in the first half of the season vs the later half 2. Away data can be used to compare home/away setup of the team 3. If we can get team rankings then we can judge players performance against the top half vs bottom half 4. X, y can be used in a predictive model to see how the teams/player are converting their chances from a particular position. A better idea of how the team is playing. we can draw the heatmap of the accurate passes for each player 5. Passing map Network analysis can be done to see the which player passes to which player the most and where are they stationed every match