Chemical analysis formal lab report by molly winterbottom
poster_davidnew
1. NMR Metabolic Profiling of Beer
David Bennett, Dr. Elizabeth Pollock
Chemistry Department, Stockton University, Pomona, NJ 08240
Introduction
Methodology
Results
Discussion
Approximately 20 milliliter samples were extracted
from the bottles in medium sized centrifuge tubes. These
centrifuge tubes were then put into the degasser for
adequate degassing for 10 minutes. Approximately 500
micro-liter aliquots of degassed beer were put into Micro
Centrifuge Tubes. These beer samples were then
centrifuged in the centrifuge for 10,000 rpms. The filtered
beer samples were then placed into fresh micro
centrifuges and were treated as individual samples at this
point. They were dried down using the Rotar vap to
remove the water and ethanol. Samples were stored in -
80oC until analysis.
The lyophilized samples were now ready to be
prepared for the 1H Nuclear Magnetic Resonance (NMR)
400MHz. On the day of analysis, 495 micro-liters of D2O
and 5 micro-liters of 100 mM TSP were micro pipetted
into the lyophilized samples. Samples were then mixed
using a spatula. The beer samples were then placed in
the centrifuge once again for 10,000 rpms. The beer
samples were then aliquoted into NMR pipettes. The
NMR tubes were placed into the NMR for data collection.
The supernatant was analyzed using Icon NMR for
automated data collections. The best way to get a strong
reading of organic molecules (glucose) was using D2O as a
solvent and suppressing that peak. The suppression used
was NoesyPR10 with 128 scans and 2-second relaxation
delay.
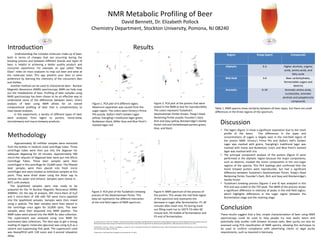
Region Range (ppm) Compounds
Aliphatic 0-3 Higher alcohols, organic
acids, amino acids, and
fatty acids
Mid-field 3-6 Beer carbohydrates,
fermentable sugars and
dextrins
Aromatic 6-10 Aromatic amino acids,
nucleosides, aromatic
alcohols and polyphenolic
compounds
• The lagers (figure 1) show a significant separation due to the mash
profile of the beers. The differences in the types and
concentrations of sugars is largely seen in the mid-field region of
the proton NMR. Victory’s Prima Pils and Slyfox’s Hell’s Golden
Lager was mashed with grains, Yuengling’s traditional lager was
mashed with maize and Budwieser, Coors and Blue Point’s toasted
lager was mashed with rice.
• The principal component analysis of the porters (figure 2) were
performed in the aliphatic region because the major components,
such as dextrins, masked the minor components in the non-sugar
regions of the spectra. This PCA loadings plot confirmed that the
home brewed porters were reproducible, but had a significant
difference between Tuckahoe’s Stealmantown Porter, Troeg’s Dead
Reckoning Porter, Founder’s Dark, Rich and Sexy and Breckenridge’s
Vanilla Porter.
• Tuckahoe’s brewing process (figures 3 and 4) was analyzed in this
PCA and was scaled to the TSP peak. The NMR of the process shows
a significant difference in intensity of peaks in the mid-field region,
which highlights differences in the sugar region between the
fermentation stage and the mashing stage.
Figure 1: PCA plot of 6 different lagers.
Maximum separation was caused from the
sugar region. The colors were Victory’s Prima
Pils-purple, Slyfox’s Hell’s Golden Lager-
yellow, Yuengling’s traditional lager-green,
Budwieser-black, Miller blue and Blue Point’s
toasted lager-red
Figure 2: PCA plot of the porters that were
tested in the NMR to test for reproducibility.
The colors represent Tuckahoe’s
Stealmantown Porter-brown, Troeg’s Dead
Reckoning Porter-purple, Founder’s Dark,
Rich and Sexy-yellow, Breckenridge’s Vanilla
Porter-red and homebrewed porters-green,
blue, and black
Figure 3: PCA plot of the Tuckahoe’s brewing
process of the Stealmantown Porter. This
data set represents the different intensities
of the mid field region of NMR spectrum.
Figure 4: NMR spectrum of the process of
the porters. This shows the mid field region
of the spectrum and represents the
decrease in sugar after fermentation. P1-30
minutes after mash rest, P2-during mash
out filling mash tun to 165oF, P3-after 60
minute boil, P4-middle of fermentation and
P5-end of fermentation.
Table 1: NMR spectra show similarity between all beer types, but there are small
differences in the three regions of the spectrum.
Conclusion
These results suggest that a fast, simple characterization of beer using NMR
spectroscopy could be used to help people try new exotic beers and
potentially help smaller craft brewers increase sales. Beer purity can also be
assessed using PCA classification of NMR spectra, allowing this technique to
be used to confirm compliance with advertising claims or legal purity
requirements, such as required in Germany.
Understanding the complex molecular make up of beer,
both in terms of changes that are occurring during the
brewing process and between different brands and types of
beer, is helpful in achieving a better quality product and
consumer experience. For example, an app called “Next
Glass” relies on mass analyzers to map out beer and wine at
the molecular level. This app predicts your beer or wine
preference by learning the chemistry of the consumers likes
and dislikes.
Another method can be used to characterize beer - Nuclear
Magnetic Resonance (NMR) spectroscopy. NMR can help map
out the metabolome of beer. Profiling of beer samples using
NMR spectroscopy has been shown to be an effective way to
understand some of the differences between beers. Direct
analysis of beer using NMR allows for an overall
compositional profiling of beer that is complimentary to
mass-based analyses.
In this experiment, a variety of different types of beer
were analyzed, from lagers to porters, home-brew,
microbrewery and macro brewery products.
(1) Lachenmeier, D.; Frank, W.; Humpfer, E. Quality Control of Beer using High using High-Resolution Resolution Nuclear Magnetic Resonance Nuclear Magnetic Resonance Spectroscopy and
Multivariate Analysis Spectroscopy and Multivariate Analysis http://www.untersuchungsaemter-bw.de/karlsruhe/org/abt4/Poster_NMR_Beer.pdf (accessed Apr 15, 2015).
(2) Almeida, C.; Duarte, I.; Barros, A.; Rodrigues, J.; Spraul, M.; Gil, A. Composition Of Beer By 1 H NMR Spectroscopy: Effects Of Brewing Site And Date Of Production. Journal of Agricultural
and Food Chemistry 2006, 54, 700-706.
(3) Next Glass,. Next Glass http://nextglass.co/ (accessed Apr 15, 2015).