More Related Content
Similar to Brewey Poster Presentation-EDIT 2
Similar to Brewey Poster Presentation-EDIT 2 (20)
Brewey Poster Presentation-EDIT 2
- 1. TEMPLATE DESIGN © 2008
www.PosterPresentations.com
Comparing the Bitter Acid Content of Half Full Brewery’s Bright
Ale to Pursuit IPA Using HPLC and UV-Visible Spectroscopy
Cassie Nedved, Lily Etemad, Emma Ritzmann
CH326, Chemical Instrumentation, Fairfield University
Introduction
Instruments Used
Experimental Procedure for UV-Visible Analysis
Experimental Procedure for HPLC Analysis
Calculating IBU Of Bright Ale and Pursuit IPA By UV-
Visible Spectroscopy
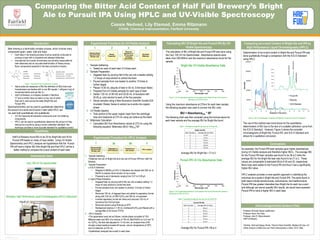
The calculation of IBU of Bright Ale and Pursuit IPA was done using
the Cary 100 UV-Vis Spectrometer. Absorbance spectra were
taken from 200-800nm and the maximum absorbance found for the
sample.
Using the maximum absorbance at 275nm for each beer sample,
the following equation was used to convert into IBU units.
Comparing iso-α-acid Content of Bright Ale and IPA by
High Performance Liquid Chromatography (HPLC)
Conclusions
Acknowledgements/Literature Cited
Cary 100 UV-Vis Spectrometer
-0.2
0
0.2
0.4
0.6
0.8
1
1.2
1.4
1.6
200 300 400 500 600 700 800
Absorbance
Wavelength (nm)
Figure 2: UV-Vis absorbance spectrum of one sample of the Bright Ale beer with maximum
absorbance of 0.578 at 275nm.
IBU = Absorbance275 * 501
The following chart was then compiled using the formula above for
each beer sample and the average IBU for Bright Ale found.
Bright Ale IBU
Beer Number Average IBU per Beer
1 17±0
2 17±1
3 21±1
4 24±6
5 24±3
6 23±4
Average IBU for Bright Ale = 21±3
Pursuit IPA UV-Vis Absorbance Data
-0.2
0
0.2
0.4
0.6
0.8
1
1.2
1.4
1.6
200 300 400 500 600 700 800
Asborbance
Wavelength (nm)
Figure 2: UV-Vis absorbance spectrum of one sample of the Pursuit IPA beer with maximum
absorbance of 0.661 at 275nm.
Pursuit IPA IBU
Beer Number Average IBU Per Beer
1 38±2
2 35±1
3 36±0
4 34±1
5 37±3
6 37±2
Average IBU for Pursuit IPA =36±2
Bright Ale UV-Visible Absorbance Data
Obtained Bright
Ale and Pursuit
IPA beer cans
Sample
Preparation
Measured
absorbance at
275 nm using
UV-Visible
spectrometer
Calculated
Bitterness
1. Sample Gathering
Tested six cans of each beer 3-5 times each
2. Sample Preparation
Degased beer by pouring half of the can into a beaker adding
1-2 drops of octyl alcohol to control the foam
Poured samples from one beaker to another 10 times to
further degas
Placed 10.00 mL aliquots of beer in 50 mL Erlenmeyer flasks
Prepared five UV-Visible samples for each type of beer
Added 1.00 mL of 3N HCl and 20.00 mL of isooctane with
50.00 μL octyl alcohol to each of the five samples
Shook samples using a New Brunswick Scientific Excella E24
Incubator Shaker Series to extract iso-α-acids into organic
phase
3. UV-Visible Spectra
Took portion of the upper organic layer from the centrifuge
tube and measured at 275 nm using iso-octane as the blank
4. Bitterness Calculation
Calculated IBU from Absorbance values at 275 nm using the
following equation: Bitterness (IBU)= Abs275*501
Shimadzu High Performance Liquid Chromatography (HPLC) Instrument
As expected, the Pursuit IPA beer samples gave higher absorbances
during UV-Visible analysis and therefore higher IBU’s. The average IBU
for the Pursuit IPA beer samples was found to be 36±2 while the
average IBU for the Bright Ale beer was found to be 21±3. These
values are comparable to estimated IBUs of 40 and 20, respectively.
More hops were added to the Pursuit IPA and thus it had a significantly
higher IBU value.
HPLC analysis provides a more specific approach in identifying the
individual iso-α-acids in Bright Ale and Pursuit IPA. The acids found in
both beers include isocohumuole, isohumulone, and isadhumulone.
Pursuit IPA has greater intensities than Bright Ale for each iso-α-acid
and although we cannot quantify IBU results, we would have expected
Pursuit IPA to have a higher IBU in each beer.
Table 2: Calculated average IBU per beer can for Pursuit IPA
Table 1: Calculated average IBU per beer can for Bright Ale
Half Full Brewery found IBU to be 20 for Bright Ale and 40 for
Pursuit IPA based on mass of hops added. Using UV-Visible
Spectrometry and HPLC analysis we hypothesize that the Pursuit
IPA will have a higher IBU than Bright Ale and that HPLC will be a
better method to compare the α-acid content of each beer.
1 2 3 4
Obtained Bright
Ale and Pursuit
IPA beer cans
Preparation of
ICS-I3 Standard
Preparation of
beer samples
HPLC analysis
Professor Amanda Harper-Leatherman
Professor Aaron Van Dyke
Professor John R. Miecznikowski
Half Full Brewery
1Strother, Todd and Keppy, Nicole. Thermo Fisher Scientific, Madison,Wi Usa. UV-
Visible Analysis of Bitterness and Total Carbohydrates in Beer. 2013. Web.
1 2a 2b 3
1. Sample Gathering
Obtained one can of Bright Ale and one can of Pursuit IPA from Half Full
Brewery
2. Sample Preparation
a.ICS-I3 Standard
• Weighed 0.08026 g of ICS-13 Standard and diluted with 500 mL of
MeOH to prepare stock solution of iso-α-acids
• Prepared a set of standards ranging from 0.01 to 0.08 g/L
b.Liquid Phase Extraction
• Degased beer by pouring half of the can into a beaker adding 1-2
drops of octyl alcohol to control the foam
• Poured samples from one beaker to another 10 times to further
degas
• Removed 100 mL of degased beer and added to separatory funnel
along with 5.00 mL of 20M H3PO4 and 200 mL of isooctane
• Inverted separatory funnel ten times and removed 125 mL of
isooctane from the top layer
• Removed solvent using Rotovap at 30⁰C
• Redissolved residue in 1.00 mL of ethanol/H3PO4 and filtered with a
syringe filter (0.20 micron PTFE)
3. HPLC Analysis
The parameters were set as follows: mobile phase consisted of 10%
Millipore water and 90% of a mixture of 750 mL MeOH/240 mL H2O and 10
mL H3PO4, the flow rate adjusted to 1.5 mL/min, an analysis time of 60
minutes unless baseline leveled off sooner, column temperature of 35⁰C,
and UV-detection at 270 nm
Qualitatively analyzed iso-α-acid in each beer
0
50000
100000
150000
200000
250000
0 1 2 3 4 5 6 7 8 9 10 11 12
Intenstity
Retention Time (min)
Figure 3: HPLC chromatogram of samples of Bright Ale, Pursuit IPA, and ICS-I3 Standard
Determination of iso-α-acid content in Bright Ale and Pursuit IPA was
done qualitatively through a comparison with the ICS-I3 Standard
using HPLC.
The use of this method was inconclusive for the quantitative
determination of IBU due to the lack of a suitable calibration curve from
the ICS-I3 Standard. However, Figure 3 shows the compiled
chromatograms of Bright Ale, Pursuit IPA, and ICS-I3 Standard and
allows for a qualitative conclusion.
0
10000
20000
30000
40000
50000
60000
0 1 2 3 4 5
Isocohumulone
Isohumulone
Isoadhumulone
Beer brewing is a technically complex process, which involves many
components (grain, water, malt and hops)
• Each step in the brewing process must be carefully conducted to
produce a beer with a consistent and pleasant bitterness
• Hop-derived iso-α-acids (humulones) are primarily responsible for
beer bitterness and an accurate determination of these primary
flavor components essential in the beer production industry
Figure 1: Structures of iso-α-acids and -α-acids
• Alpha acids are measured in IBU-the definition of IBUs that most
homebrewers are familiar with is one IBU equals 1 milligram (mg) of
isomerized alpha acid per liter (L)
• Half Full Brewery is a brewery located in Stamford,
CT and currently have six beers on tap, two of which
they sell in cans across the state (Bright Ale and
Pursuit IPA)
Spectrophotometry can be used to quantitatively determine
the amount of α-acids and β-acids in beer while HPLC can
be used both quantitatively and qualitatively
• UV-Vis measures all extracted compounds even non-bittering
components
• HPLC can be used to quantitatively determine the amount of Hop-
derived iso-α-acids by using a known calibration standard- this
technique provides a more accurate standard for qualitative control
Hypothesis