1. Click here for authors’ contact information.
Priced (in USD) as of 10/5/17 market close, EST (unless otherwise stated).
For important disclosures and required non-U.S. analyst disclosures, see page 6.
Since the spring, our premise has been that political risk in
Europe has receded. Indeed, better economic momentum, as
well as relative cheap valuations, led us to upgrade European
equities to Overweight.
The Catalan referendum on October 1 calling for
independence from Spain doesn’t change that view, as it
doesn’t pose an existential risk to the region in the same way
that a populist victory in a European presidential election
would have. But we concede that there could be volatility in
the short term as the noise from the issue may increase before
a resolution is hammered out.
The referendum was staged as many in Catalonia believe
they are a separate people with their own distinct language
and culture. The initial results point to roughly 90% support
for separation on a low turnout of 42%. The outcome is not
surprising as those who opposed independence largely
ignored the referendum.
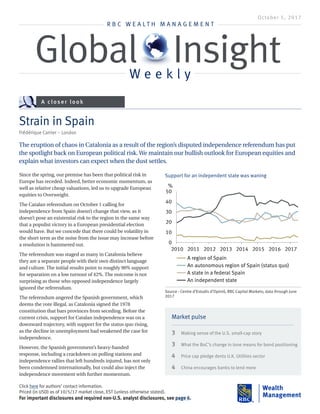
The referendum angered the Spanish government, which
deems the vote illegal, as Catalonia signed the 1978
constitution that bars provinces from seceding. Before the
current crisis, support for Catalan independence was on a
downward trajectory, with support for the status quo rising,
as the decline in unemployment had weakened the case for
independence.
However, the Spanish government’s heavy-handed
response, including a crackdown on polling stations and
independence rallies that left hundreds injured, has not only
been condemned internationally, but could also inject the
independence movement with further momentum.
Strain in Spain
Frédérique Carrier – London
October 5, 2017
A closer look
The eruption of chaos in Catalonia as a result of the region’s disputed independence referendum has put
the spotlight back on European political risk.We maintain our bullish outlook for European equities and
explain what investors can expect when the dust settles.
R B C W E A L T H M A N A G E M E N T
Global InsightW e e k l y
Source - Centre d’Estudis d’Opinió, RBC Capital Markets; data through June
2017
Support for an independent state was waning
0
10
20
30
40
50
2010 2011 2012 2013 2014 2015 2016 2017
A region of Spain
An autonomous region of Spain (status quo)
A state in a federal Spain
An independent state
%
3 Making sense of the U.S. small-cap story
3 What the BoC’s change in tone means for bond positioning
4 Price cap pledge dents U.K. Utilities sector
4 China encourages banks to lend more
Market pulse
2. 2 | Global Insight Weekly
October 5, 2017 | RBC Wealth Management
Homage to Catalonia
Catalonia is not only one of the most populous regions in the
EU’s fourth-largest economy, with 7.5 million inhabitants, it is
also one of the most prosperous regions in Spain, accounting
for around 20% of total Spanish GDP—the joint largest region
in that respect alongside Madrid.
Despite the low turnout at the referendum, Catalan leaders
have vowed to declare independence in the coming days.
This is unlikely to be recognised by either Spain, which has a
history of holding on to rebellious regions, such as the Basque
country, or the international community. Other countries will
not want to encourage separatist movements. Nor is it obvious
to outsiders that Catalonia is disadvantaged by being part of
Spain, or that it lacks freedoms. While this might have been
true in the past, its language and culture are now being taught
in schools. The region contributes a large share to Spanish
government coffers, but that is because it is a prosperous
region.
Moreover, it is not clear that it is well prepared to operate
as an independent country, particularly on the fiscal front.
Independence within the EU would be difficult to obtain, as 27
countries would have to agree to it—including Spain, which is
unlikely to do so at this stage.
Split reaction
Market reaction to the constitutional crisis has been muted
so far. The euro weakened slightly on the day the results were
announced, but is already clawing back losses. Spanish bond
yields ticked up a mere 0.20% over the past week. The stock
market has been a bit jitterier, losing 4% in the same period
before bouncing back. Moreover, this profit-taking comes after
a year-long rally during which Spanish equities gained 45%.
That the crisis is happening at a time the Spanish economy
enjoys strong momentum is helpful. September Purchasing
Managers’ Indexes point to growth of 0.8% q/q in Spain,
though any impact of the rising tensions between Catalonia
and the Spanish government will not be visible on activity
surveys before the October data is released. RBC Capital
Markets economists expect the recent events will likely dent
this momentum at the country level.
The most likely scenario, as implausible as it may seem today
given the acrimony on both sides, is that the conflict will be
resolved through negotiations, with enhanced autonomy for
the region, such as on taxation. In the past Spain succeeded in
turning around the similarly delicate situation of the Basque
country in a comparable fashion.
This would be the most benign outcome for markets. The risk
is that given Madrid’s approach so far, negotiations are likely
to be acrimonious and could result in calls for Prime Minister
Source - Instituto Nacional de Estadística, RBC Capital Markets; data through
December 2016
Catalonia contributes as much as Madrid to national GDP
Catalonia
19%
Madrid
19%
Rest of
Spain
62%
Note: Excluding Ceuta and Melilla
Source - Instituto Nacional de Estadística, RBC Capital Markets; data through
December 2016
Catalonia’s 2016 GDP per capita is among the highest
Values in euro
15,000
20,000
25,000
30,000
35,000
Extremadura
Andalucia
Castilla-LaMancha
Murcia
CanaryIslands
Asturias
Valencia
Galicia
Cantabria
Castilla&León
BalearicIslands
LaRioja
Aragon
Catalonia
Navarre
BasqueCountry
Madrid
Spain average: 23,970
Mariano Rajoy to step down, and if he did, new elections
would be called. If this were to occur, more volatility would
likely ensue.
For European equities, we believe a successful implementation
of French labour reforms and a potentially less austere
government in Germany should prove to be more important
drivers of market performance. We continue to look at Italian
elections to be held by May 2018 as a key political factor more
likely to impact the fate of the EU.
3. 3 | Global Insight Weekly
October 5, 2017 | RBC Wealth Management
(bps) lower in the week following his comments. The
market is pricing in two more 25 bps rate hikes by early
2018. We feel intermediate- and short-term bonds have
overreacted to the BoC’s change in tone and see 3- to
8-year bonds as best positioned along the yield curve.
• Year to date there has been approximately CA$14B of
maple debt issuance (Canadian dollar debt issued by
foreign issuers), the most since 2007. There is a long way
to go to match the CA$24.6B issuance seen in 2007, but
there has been a notable shift in the composition of the
borrower base in the maple market over the last decade.
For years the maple market was dominated by global
financial borrowers; however, this year we have seen a
number of non-financial maple issuers coming to market
for the first time. Maple issues provide an opportunity to
upgrade credit quality and diversify internationally.
• Higher rates benefit the preferred share market. We
expect rate-reset preferred shares trading well below
CA$25 to respond favorably to the recent move higher in
bond yields as these issues offer the most upside potential
of any segment of the preferred share market if interest
rates rise. An increase in hybrid issuance is also good
news for the preferred share market as this likely means
less preferred share issuance and a greater chance of
redemption for existing higher reset spread issues because
hybrids represent a lower cost (after-tax) refinancing
option. This could also help discounted issues with lower
spreads drift closer to CA$25. We continue to recommend
investors pair high reset spread issues and perpetuals
with discounted rate resets and floaters as the higher
reset spread and high dividend issues provide a buffer if
credit spreads widen.
United States
Kelly Bogdanov – San Francisco
• After lagging for months, small caps surged in September.
The S&P SmallCap 600 Index rallied 7.6% and the Russell
2000 rose 6.1% versus the S&P 500’s gain of 1.9%. Small-
cap indexes broke out in mid-September and have gone
straight up since then as economic data strengthened,
Treasury yields rose, and prospects for tax reform
brightened a bit. The deep corporate tax cuts in the GOP
proposal would benefit small caps more than large or
midcaps, which have lower tax rates.
• Are those reasons to become more positive about this
group? Not just yet. Small-cap earnings momentum is
lagging that of large caps, although growth should be
respectable this year and next. Small-cap indexes are still
cheap compared to large caps based on our multifactor
valuation model. But like most areas of the market, small-
cap valuations are above their historical averages.
• Also, it is unclear if the bond market is signaling that
the economy is breaking out to a stronger growth phase,
which would benefit small caps disproportionately. Or, are
yields merely bumping up against the top end of a long-
standing trading range, like they have so often during
this recovery cycle? Some of the data are pointing toward
stronger growth/reflation, but it’s too soon to tell whether
this is just temporary.
• Furthermore, we view the GOP tax reform proposal as an
aggressive “opening bid.” Its 20% corporate rate seems
unrealistic based on the budget math and ideological
divisions among Republicans. We believe somewhere
at the higher end of the 24%–28% range is more likely.
Regardless, there is no guarantee tax legislation will pass.
This could be a long, drawn-out process like it was in
the 1980s, with a lot of noisy headlines. RBC Global Asset
Management’s chief economist pegs the probability of
a tax reform bill becoming law at 60%. We think that’s a
reasonable estimate and is not high enough to get overly
excited. We remain Market Weight small-cap stocks.
Canada
Diana Di Luca – Toronto
• Bank of Canada (BoC) Governor Stephen Poloz recently
gave his first speech since the July rate hike. He struck a
more cautious tone than many market participants had
expected, noting that the BoC will proceed “cautiously”
as it assesses the performance of the economy from here.
Government of Canada bond yields were 3–7 basis points
Source - RBC Wealth Management, Bloomberg
Small caps outperform by a mile
September 2017 returns
1.9%
6.1%
7.6%
S&P 500
Russell 2000
S&P SmallCap 600
4. 4 | Global Insight Weekly
October 5, 2017 | RBC Wealth Management
Europe
Frédérique Carrier & Thomas McGarrity – London
• In the U.K., the Conservative Party held its annual
conference between October 1 and October 4. The U.K.
Utilities sector was dented by Prime Minister Theresa
May’s pledge in her keynote speech to put a price cap on
consumers’ energy bills in order to fix “the broken energy
market” and “bring an end to rip-off energy prices once
and for all.” The government will publish a draft bill next
week which will impact “standard variable tariffs” that
cover about two-thirds of Britain’s household customers.
U.K. regulated utilities have materially underperformed
the wider U.K. market and European peers this year
amid a perfect storm of political and regulatory risks
materialising. With this pressure unlikely to abate anytime
soon, we maintain a cautious stance towards the sector.
• U.K. housebuilders received a boost from the U.K.
government’s pledge to extend the “Help to Buy” (HTB)
program beyond 2021, setting aside a further £10B to
help people buy homes. Around 40% of many listed
housebuilders’ private sales use HTB.
• The U.K. Composite Purchasing Managers’ Index
(PMI) rose slightly to 54.1 in September from 54.0 the
previous month, with a rise in the services PMI helping
to counter the modest decline seen in the manufacturing
sector. Despite the pickup in the headline number, the
new business growth dropped to its lowest point in
13 months, with business-to-business demand more
subdued and delayed decision-making on large projects
in response to Brexit-related uncertainty. The September
data also indicated input cost inflation reached a seven-
month high and remained among the strongest seen since
early 2011, serving as a reminder that the inflationary
impact of a weak currency is set to linger.
• We remain cautious about the outlook for the U.K.
economy, as real household income growth remains
negative, which is likely to continue to weigh on
momentum in the all-important consumer sector.
Asia Pacific
Jay Roberts – Hong Kong
• The MSCI China Index posted its strongest quarter in
eight years in Q3. The index is up 45% in 2017.
• Equities were given a further boost from better leading
economic indicators from China for September. The
official manufacturing Purchasing Managers’ Index
(PMI) was 52.4. While this is not a particularly strong
figure by itself, it was the best reading in over five years (a
reading over 50 indicates improving conditions). Similarly,
the non-manufacturing, or services, PMI was 55.4, the
best reading in over three years. As noted many times in
Global Insight Weekly, the non-manufacturing data series
has been at a consistent and healthy level for years.
• The unofficial PMIs, which survey a greater number of
private, and smaller, enterprises, told a slightly different
story for September. It may be the case, then, that the
surprising uptick in the official data was due to fiscal
spending.
• China announced a reduction in the required reserve
ratio (RRR) for banks. One cut is 50 basis points (bps)
and the second is 100 bps, depending on whether banks
meet certain criteria such as the amount of business done
with small firms, agricultural borrowers, and start-up
companies. China has maintained high RRRs for years.
This impacts banks’ ability to lend. A reduction in RRRs
frees up liquidity for banks.
• While the RRR reduction had been telegraphed at the
end of September, it was larger than expected. The large,
mainland China bank stocks trading in Hong Kong rallied
strongly. ICBC (1398 HK), for example, which is the largest
bank in China, rallied by 7.9% that day and rose further
on the following day.
• The Reserve Bank of Australia (RBA) kept its benchmark
lending rate unchanged at 1.5%, as forecast. RBC Capital
Markets notes that the statement was upbeat and
reinforces the RBA’s base case of an expected pickup in
growth and inflation over the medium term. Governor
Philip Lowe also noted, however, that growth in inflation-
adjusted wages is low and household debt is high. The
currency was little changed on the news.
Source - RBC Wealth Management, Bloomberg; data through 10/4/17
Chinese equities climb on improving economic activity
48
49
50
51
52
-5%
0%
5%
10%
15%
20%
25%
30%
May Jun Jul Aug Sep Oct
Caixin Manuf. PMI (right axis)
MSCI China returns (left axis)
5. 5 | Global Insight Weekly
October 5, 2017 | RBC Wealth Management
Data as of October 5, 2017
Source - Bloomberg. Note: Equity returns do not include dividends, except for the German DAX and Brazilian Ibovespa. Bond yields in local currencies. Copper
Index data and U.S. fixed income returns as of Wednesday’s close. Dollar Index measures USD vs. six major currencies. Currency rates reflect market convention
(CAD/USD is the exception). Currency returns quoted in terms of the first currency in each pairing. Data as of 8:35 pm GMT 10/5/17.
Examples of how to interpret currency data: CAD/USD 0.79 means 1 Canadian dollar will buy 0.79 U.S. dollar. CAD/USD 6.9% return means the Canadian dollar
rose 6.9% vs. the U.S. dollar year to date. USD/JPY 112.84 means 1 U.S. dollar will buy 112.84 yen. USD/JPY -3.5% return means the U.S. dollar fell 3.5% vs. the
yen year to date.
Commodities (USD) Price MTD YTD 1 yr 2 yr
Gold (spot $/oz) 1,267.46 -1.0% 10.0% 0.1% 11.6%
Silver (spot $/oz) 16.60 -0.3% 4.3% -6.4% 6.0%
Copper ($/metric ton) 6,471.25 0.6% 17.2% 35.4% 24.7%
Oil (WTI spot/bbl) 50.79 -1.7% -5.5% 1.9% 9.8%
Oil (Brent spot/bbl) 56.96 -1.0% 0.2% 9.8% 15.7%
Natural Gas ($/mmBtu) 2.90 -3.6% -22.2% -4.7% 18.3%
Govt bonds (bps chg) Yield MTD YTD 1 yr 2 yr
U.S. 10-Yr Tsy 2.344% 1.1 -10.0 64.2 28.8
Canada 10-Yr 2.100% 0.1 37.9 100.9 65.8
U.K. 10-Yr 1.387% 2.2 14.8 57.2 -39.8
Germany 10-Yr 0.456% -0.8 24.8 46.1 -11.0
Fixed Income (returns) Yield MTD YTD 1 yr 2 yr
U.S. Aggregate 2.55% 0.0% 3.2% 0.6% 5.2%
U.S. Invest Grade Corp 3.14% 0.2% 5.3% 2.9% 11.1%
U.S. High Yield Corp 5.43% 0.1% 7.1% 8.6% 22.7%
Currencies Rate MTD YTD 1 yr 2 yr
U.S. Dollar Index 93.9600 0.9% -8.1% -2.3% -2.2%
CAD/USD 0.7955 -0.8% 6.9% 4.8% 4.1%
USD/CAD 1.2570 0.8% -6.5% -4.6% -3.9%
EUR/USD 1.1705 -0.9% 11.3% 4.5% 4.6%
GBP/USD 1.3112 -2.1% 6.3% 2.8% -13.4%
AUD/USD 0.7793 -0.5% 8.1% 2.2% 10.0%
USD/JPY 112.8400 0.3% -3.5% 9.0% -6.3%
EUR/JPY 132.0800 -0.6% 7.4% 13.9% -2.0%
EUR/GBP 0.8927 1.2% 4.6% 1.6% 20.8%
EUR/CHF 1.1454 0.1% 6.8% 4.9% 5.0%
USD/SGD 1.3644 0.5% -5.7% -0.4% -3.9%
USD/CNY 6.6528 0.0% -4.2% -0.3% 4.7%
USD/MXN 18.4902 1.3% -10.8% -3.8% 10.1%
USD/BRL 3.1512 -0.4% -3.2% -2.2% -19.4%
MARKET SCORECARD
Equities (local currency) Level MTD YTD 1 yr 2 yr
S&P 500 2,552.07 1.3% 14.0% 18.2% 28.4%
Dow Industrials (DJIA) 22,775.39 1.7% 15.2% 24.6% 35.8%
NASDAQ 6,585.36 1.4% 22.3% 23.9% 37.7%
Russell 2000 1,512.09 1.4% 11.4% 21.1% 32.4%
S&P/TSX Comp 15,776.30 0.9% 3.2% 8.0% 16.4%
FTSE All-Share 4,118.56 1.7% 6.3% 7.6% 19.2%
STOXX Europe 600 391.03 0.7% 8.2% 13.6% 9.1%
EURO STOXX 50 3,613.54 0.5% 9.8% 19.4% 13.3%
Hang Seng 28,379.18 3.0% 29.0% 19.3% 29.9%
Shanghai Comp 3,348.94 0.0% 7.9% 11.5% 9.7%
Nikkei 225 20,628.56 1.3% 7.9% 22.6% 14.6%
India Sensex 31,592.03 1.0% 18.6% 11.9% 17.9%
Singapore Straits Times 3,261.84 1.3% 13.2% 13.2% 14.4%
Brazil Ibovespa 76,617.53 3.1% 27.2% 27.2% 61.0%
Mexican Bolsa IPC 50,480.92 0.3% 10.6% 4.9% 15.9%
UPCOMING EVENTS
The dates reflect North American time zones. All data reflect Bloomberg consensus forecasts where available.
Fri, Oct 6 Sun, Oct 8, cont. Tue, Oct 10, cont. Fri, Oct 13
U.S. Nonfarm Payrolls (80K) China Caixin Services/Composite PMI Canada Housing Starts U.S. CPI (0.6% m/m, 2.2% y/y)
U.S. Unemployment (4.4%) Mon, Oct 9 Wed, Oct 11 U.S. Real Average Weekly Earnings
U.S. Average Hourly Earnings (2.5% y/y) Eurozone Sentix Investor Confidence U.S. JOLTS Job Openings U.S. Retail Sales
U.S. Consumer Credit ($15.54B) Germany Industrial Production U.S. FOMC Minutes (Sept. Meeting) U.S. Univ. of Michigan Sentiment
Canada Employment Change (12K) Tue, Oct 10 Thu, Oct 12 Germany CPI
Canada Unemployment (6.2%) Germany Exports/Imports Eurozone Industrial Production Wed, Oct 25
NY Fed President Dudley Speaks (NY) U.K. Industrial Production BoE Credit Conditions & Bank Liabilities BoC Meeting
Sun, Oct 8 U.K. NIESR GDP Estimate Canada New Housing Price Index Thu, Oct 26
China Foreign Reserves ($3.1T) U.S. NFIB Small Business Optimism ECB Meeting
6. 6 | Global Insight Weekly
October 5, 2017 | RBC Wealth Management
Authors
Analyst Certification
All of the views expressed in this report accurately reflect the
personal views of the responsible analyst(s) about any and all
of the subject securities or issuers. No part of the compensation
of the responsible analyst(s) named herein is, or will be, directly
or indirectly, related to the specific recommendations or views
expressed by the responsible analyst(s) in this report.
Important Disclosures
In the U.S., RBC Wealth Management operates as a division of RBC
Capital Markets, LLC. In Canada, RBC Wealth Management includes,
without limitation, RBC Dominion Securities Inc., which is a foreign
affiliate of RBC Capital Markets, LLC. This report has been prepared
by RBC Capital Markets, LLC. which is an indirect wholly-owned
subsidiary of the Royal Bank of Canada and, as such, is a related
issuer of Royal Bank of Canada.
Non-U.S. Analyst Disclosure: Diana Di Luca and Jay Roberts, employees
of RBC Wealth Management USA’s foreign affiliate RBC Dominion
Securities Inc.; and Frédérique Carrier and Thomas McGarrity,
employees of RBC Wealth Management USA’s foreign affiliate Royal
Bank of Canada Investment Management (U.K.) Limited; contributed
to the preparation of this publication. These individuals are not
registered with or qualified as research analysts with the U.S.
Financial Industry Regulatory Authority (“FINRA”) and, since they are
not associated persons of RBC Wealth Management, they may not be
subject to FINRA Rule 2241 governing communications with subject
companies, the making of public appearances, and the trading of
securities in accounts held by research analysts.
In the event that this is a compendium report (covers six or more
companies), RBC Wealth Management may choose to provide
important disclosure information by reference. To access current
disclosures, clients should refer to http://www.rbccm.com/
Frédérique Carrier – London, United Kingdom
frederique.carrier@rbc.com; Royal Bank of Canada Investment Management (U.K.) Ltd.
Kelly Bogdanov – San Francisco, United States
kelly.bogdanov@rbc.com; RBCCapital Markets, LLC
Diana Di Luca – Toronto, Canada
diana.diluca@rbc.com; RBC Dominion Securities Inc.
Thomas McGarrity, CFA – London, United Kingdom
thomas.mcgarrity@rbc.com; Royal Bank of Canada Investment Management (U.K.) Ltd.
Jay Roberts – Hong Kong, China
jay.roberts@rbc.com; RBC Dominion Securities Inc.
D isclosures and Disclaimer
GLDisclosure/PublicWeb/DisclosureLookup.aspx?EntityID=2 to view
disclosures regarding RBC Wealth Management and its affiliated
firms. Such information is also available upon request to RBC Wealth
Management Publishing, 60 South Sixth St, Minneapolis, MN 55402.
References to a Recommended List in the recommendation history
chart may include one or more recommended lists or model
portfolios maintained by RBC Wealth Management or one of its
affiliates. RBC Wealth Management recommended lists include the
Guided Portfolio: Prime Income (RL 6), the Guided Portfolio: Dividend
Growth (RL 8), the Guided Portfolio: ADR (RL 10), and the Guided
Portfolio: All Cap Growth (RL 12), and former lists called the Guided
Portfolio: Large Cap (RL 7), the Guided Portfolio: Midcap 111 (RL 9),
and the Guided Portfolio: Global Equity (U.S.) (RL 11). RBC Capital
Markets recommended lists include the Strategy Focus List and the
Fundamental Equity Weightings (FEW) portfolios. The abbreviation
‘RL On’ means the date a security was placed on a Recommended
List. The abbreviation ‘RL Off’ means the date a security was removed
from a Recommended List.
Distribution of Ratings
For the purpose of ratings distributions, regulatory rules require
member firms to assign ratings to one of three rating categories
- Buy, Hold/Neutral, or Sell - regardless of a firm’s own rating
categories. Although RBC Capital Markets, LLC ratings of Top Pick
(TP)/Outperform (O), Sector Perform (SP) and Underperform (U) most
closely correspond to Buy, Hold/Neutral and Sell, respectively, the
meanings are not the same because our ratings are determined on a
relative basis (as described below).
Explanation of RBC Capital Markets, LLC Equity Rating System
An analyst’s “sector” is the universe of companies for which the
analyst provides research coverage. Accordingly, the rating assigned
to a particular stock represents solely the analyst’s view of how that
stock will perform over the next 12 months relative to the analyst’s
sector average. Although RBC Capital Markets, LLC ratings of Top Pick
(TP)/Outperform (O), Sector Perform (SP), and Underperform (U) most
closely correspond to Buy, Hold/Neutral and Sell, respectively, the
meanings are not the same because our ratings are determined on a
relative basis (as described below).
Ratings:
Top Pick (TP): Represents analyst’s best idea in the sector; expected
to provide significant absolute total return over 12 months with a
favorable risk-reward ratio. Outperform (O): Expected to materially
outperform sector average over 12 months. Sector Perform (SP):
Returns expected to be in line with sector average over 12 months.
Underperform (U): Returns expected to be materially below sector
average over 12 months.
As of September 30, 2017
Rating Count Percent Count Percent
Buy [Top Pick & Outperform] 859 52.92 294 34.23
Hold [Sector Perform] 660 40.67 154 23.33
Sell [Underperform] 104 6.41 7 6.73
Investment Banking Services
Provided During Past 12 Months
Distribution of Ratings - RBC Capital Markets, LLC Equity Research
7. 7 | Global Insight Weekly
October 5, 2017 | RBC Wealth Management
Risk Rating:
As of March 31, 2013, RBC Capital Markets, LLC suspends its Average
and Above Average risk ratings. The Speculative risk rating reflects a
security’s lower level of financial or operating predictability, illiquid
share trading volumes, high balance sheet leverage, or limited
operating history that result in a higher expectation of financial and/
or stock price volatility.
Valuation and Risks to Rating and Price Target
When RBC Wealth Management assigns a value to a company in a
research report, FINRA Rules and NYSE Rules (as incorporated into
the FINRA Rulebook) require that the basis for the valuation and
the impediments to obtaining that valuation be described. Where
applicable, this information is included in the text of our research
in the sections entitled “Valuation” and “Risks to Rating and Price
Target”, respectively.
The analyst(s) responsible for preparing this research report received
compensation that is based upon various factors, including total
revenues of RBC Capital Markets, LLC, and its affiliates, a portion of
which are or have been generated by investment banking activities of
the member companies of RBC Capital Markets, LLC and its affiliates.
Other Disclosures
Prepared with the assistance of our national research sources.
RBC Wealth Management prepared this report and takes sole
responsibility for its content and distribution. The content may have
been based, at least in part, on material provided by our third-party
correspondent research services. Our third-party correspondent
has given RBC Wealth Management general permission to use
its research reports as source materials, but has not reviewed or
approved this report, nor has it been informed of its publication. Our
third-party correspondent may from time to time have long or short
positions in, effect transactions in, and make markets in securities
referred to herein. Our third-party correspondent may from time to
time perform investment banking or other services for, or solicit
investment banking or other business from, any company mentioned
in this report.
RBC Wealth Management endeavors to make all reasonable efforts
to provide research simultaneously to all eligible clients, having
regard to local time zones in overseas jurisdictions. In certain
investment advisory accounts, RBC Wealth Management will act as
overlay manager for our clients and will initiate transactions in the
securities referenced herein for those accounts upon receipt of this
report. These transactions may occur before or after your receipt of
this report and may have a short-term impact on the market price of
the securities in which transactions occur. RBC Wealth Management
research is posted to our proprietary Web sites to ensure eligible
clients receive coverage initiations and changes in rating, targets,
and opinions in a timely manner. Additional distribution may be done
by sales personnel via e-mail, fax, or regular mail. Clients may also
receive our research via third-party vendors. Please contact your RBC
Wealth Management Financial Advisor for more information regarding
RBC Wealth Management research.
Conflicts Disclosure: RBC Wealth Management is registered with the
Securities and Exchange Commission as a broker/dealer and an
investment adviser, offering both brokerage and investment advisory
services. RBC Wealth Management’s Policy for Managing Conflicts of
Interest in Relation to Investment Research is available from us on
our Web site at http://www.rbccm.com/GLDisclosure/PublicWeb/
DisclosureLookup.aspx?EntityID=2. Conflicts of interests related to
our investment advisory business can be found in Part II of the Firm’s
Form ADV or the Investment Advisor Group Disclosure Document.
Copies of any of these documents are available upon request
through your Financial Advisor. We reserve the right to amend or
supplement this policy, Part II of the ADV, or Disclosure Document at
any time.
The authors are employed by one of the following entities: RBC
Wealth Management USA, a division of RBC Capital Markets, LLC, a
securities broker-dealer with principal offices located in Minnesota
and New York, USA; by RBC Dominion Securities Inc., a securities
broker-dealer with principal offices located in Toronto, Canada;
by RBC Investment Services (Asia) Limited, a subsidiary of RBC
Dominion Securities Inc., a securities broker-dealer with principal
offices located in Hong Kong, China; and by Royal Bank of Canada
Investment Management (U.K.) Limited, an investment management
company with principal offices located in London, United Kingdom.
Research Resources
This document is produced by the Global Portfolio Advisory
Committee within RBC Wealth Management’s Portfolio Advisory
Group. The RBC WM Portfolio Advisory Group provides support
related to asset allocation and portfolio construction for the firm’s
Investment Advisors / Financial Advisors who are engaged in
assembling portfolios incorporating individual marketable securities.
The Committee leverages the broad market outlook as developed by
the RBC Investment Strategy Committee, providing additional tactical
and thematic support utilizing research from the RBC Investment
Strategy Committee, RBC Capital Markets, and third-party resources.
Third-party disclaimers
The Global Industry Classification Standard (“GICS”) was developed by and is
the exclusive property and a service mark of MSCI Inc. (“MSCI”) and Standard
& Poor’s Financial Services LLC (“S&P”) and is licensed for use by RBC. Neither
MSCI, S&P, nor any other party involved in making or compiling the GICS or any
GICS classifications makes any express or implied warranties or representations
with respect to such standard or classification (or the results to be obtained by
the use thereof), and all such parties hereby expressly disclaim all warranties of
originality, accuracy, completeness, merchantability and fitness for a particular
purpose with respect to any of such standard or classification. Without limiting
any of the foregoing, in no event shall MSCI, S&P, any of their affiliates or any
third party involved in making or compiling the GICS or any GICS classifications
have any liability for any direct, indirect, special, punitive, consequential or any
other damages (including lost profits) even if notified of the possibility of such
damages.
References herein to “LIBOR”, “LIBO Rate”, “L” or other LIBOR abbreviations
means the London interbank offered rate as administered by ICE Benchmark
Administration (or any other person that takes over the administration of such
rate).
Disclaimer
The information contained in this report has been compiled by RBC Wealth
Management, a division of RBC Capital Markets, LLC, from sources believed to
be reliable, but no representation or warranty, express or implied, is made by
Royal Bank of Canada, RBC Wealth Management, its affiliates or any other person
as to its accuracy, completeness or correctness. All opinions and estimates
contained in this report constitute RBC Wealth Management’s judgment as of
the date of this report, are subject to change without notice and are provided
in good faith but without legal responsibility. Past performance is not a guide