More Related Content
Similar to ARVO ISIE 2012 IMAGING POSTER.DDDK.Final (20)
ARVO ISIE 2012 IMAGING POSTER.DDDK.Final
- 1. 0
50
100
150
200
250
300
350
CST
Sup 3mm
Quadrant
SUP 6mm
Quadrant
CAT
CV
6mm Quadrant 60% > CST
Range of change: 49% > 3mm Quad
525% > CAT
PURPOSE:
Optical Coherence Tomography (OCT) is used to aid in the diagnosis and assessment of response
to treatment of various retinal diseases. CirrusTM spectral domain high definition OCT (HD-OCT)
performs 65,536 A-scans to create a consistent 6x6 mm2 topographical analysis of the macula.
HD-OCT raster lines scans limitations include accurate image registration and consistency from
study to study. This may result in false interpretation of comparative HD-OCT raster line scans.
HD-OCT macula reports include: Central Subfield Thickness (CST), Cube Volume (CV), Cube
Average Thickness (CAT) and a Numerical Thickness Average concentric circle map of 1mm
(CST) and superior, nasal, inferior, and temporal 3mm and 6mm quadrants. Most research studies
use only CST or CV for evaluation of treatment response and do not include other available
reported OCT results.
METHODS:
In certain retinal disorders, specifically Branch Retinal Vein Occlusion (BRVO), CST or CV
may not be the most useful OCT measurements for monitoring disease progression. CST may
not be an area that is primarily involved in disease progression in BRVO. CV may be too small
a parameter to accurately represent intraretinal fluid progression or regression. We present a
patient with a BRVO and multiple episodes of recurrent fluid, treated with intravitreal Avastin
(IVA) and serial intravitreal Ozurdex (IVO). We compare the CST, CAT, 3mm and 6mm
Superior Quadrant results to determine which parameters are the most sensitive and accurate
indicators for recurrent intraretinal fluid in BRVO.
RESULTS:
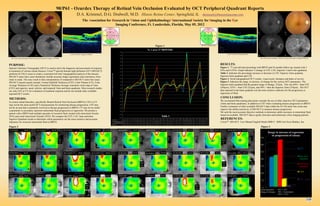
Figure 1. 77 year-old man presenting with BRVO and 26 months follow-up, treated with 3
IVAs and 6 IVOs. Graph indicates % change in CST, CAT, Superior 3 and 6 mm quadrants.
Table 1. Indicates the percentage increase or decrease in CST, Superior 3mm quadrant,
Superior 6mm quadrant and CAT.
Figure 2. Serial topographical OCT results, visual acuity, therapies and dates of service.
Figure 3. Indicates the range, in microns, of change for the various OCT parameters. The
Superior 6mm quadrant had the greatest range of change, 325µm. This was 60% > than CST
(204µm), 525% > than CAT (52µm), and 49% > than the Superior 3mm (218µm). The OCT
data reported in the 6mm quadrant was the most sensitive indicator for the progression or
regression of fluid.
CONCLUSION:
We recommend that treating physicians consider the use of other objective OCT parameters
(3mm and 6mm quadrants), in addition to CST when evaluating disease progression in BRVO.
Further evaluation of other available HD-OCT data within the 65,536 raster line scans may
improve the ability/sensitivity of HD-OCT to measure disease progression.
We seek the most accurate objective methods to determine subtle increases in intraretinal fluid
based on available HD-OCT data to guide clinicians and technicians when imaging patients.
Range in microns of regression
or progression of edema
12/18/2009
06/08/2011
10/13/201009/15/201008/18/201007/28/2010
04/16/201003/19/201002/19/201001/15/2010 06/03/201005/28/201005/07/2010 06/30/2010
03/10/201102/10/201101/06/2011 04/13/2011
02/08/201207/27/2011 09/08/201107/07/2011 01/11/2012
05/11/2011
11/02/2011 11/30/201110/07/2011
1 2 3 4 5 6 7 8 9 10 11 12 13 14 15 16 17 18 19 20 21 22 23 24 25 26
CST -40.5 -2.8 -1.5 -1.9 -0.8 -0.4 8.8 -5.6 -3.0 1.9 9.4 -9.0 0.0 4.9 -1.8 1.5 -4.3 0.0 -10.6 50.8 -24.7 -2.6 3.1 21.6 -17.1 -1.1
SUPERIOR 3mm -35.2 -3.0 -3.4 -1.5 -0.6 3.0 31.5 -25.1 -1.5 0.6 29.9 -22.5 0.3 1.2 -0.3 7.9 -9.2 0.3 -1.2 47.7 -27.8 -8.2 3.1 35.3 -18.4 -7.3
SUPERIOR 6mm -39.6 -6.4 -4.1 -1.1 2.6 9.3 23.3 -21.8 -9.7 2.4 29.9 -23.3 -6.7 0.9 0.0 9.3 -7.6 -2.1 -2.8 34.5 -18.0 -14.9 3.4 31.2 -14.4 -6.2
CAT -8.0 -3.4 -5.8 0.7 4.1 2.0 6.8 -10.5 0.0 -1.0 9.9 -7.1 -1.0 2.0 -1.0 2.3 -4.2 0.7 -1.4 11.6 -7.7 -4.7 2.4 9.2 -6.2 -1.7
-50.00
-45.00
-40.00
-35.00
-30.00
-25.00
-20.00
-15.00
-10.00
-5.00
0.00
5.00
10.00
15.00
20.00
25.00
30.00
35.00
40.00
45.00
50.00
%ProgressionorRegressionofIntraretinalFluid
% ∆ over 27 MONTHS
The Association for Research in Vision and Ophthalmology/ International Society for Imaging in the Eye
Imaging Conference, Ft. Lauderdale, Florida, May 05, 2012
IVA IVA
#2
IVO
#2
IVA
#3
IVO
#1
IVO
#3
IVO
#4
FOCAL
LASER
IVO
#5
PRP
LASER IVO
#6
Figure 2 Figure 3
Figure 1
Top: red free and color photos. Bottom: late and early phase FA images 12/18/2009 Top: red free and color photos . Bottom: late and early phase FA images 09/08/2011
CirrusTM HD-OCT image 12/18/2009 CirrusTM HD-OCT image 09/08/2011
in mm3
Table 1
REFERENCES:
CirrusTM HD-OCT User Manual English Model 4000 © 2008 Carl Zeiss Meditec, Inc.
20/40
20/30
20/4020/4020/30
20/30 20/25
20/3020/2520/2520/3020/30
20/3020/50
20/25 20/30
20/20 20/20 20/30 20/25
20/25 20/25 20/30
20/30 20/30 20/30 20/30
HD-OCT quadrant report HD-OCT quadrant report