Tricumen 1Q17 Wholesale Banking Results Review_open 260517

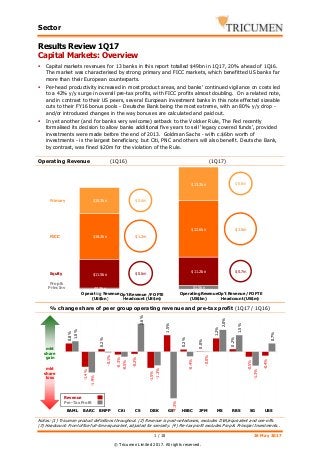
Capital Markets: Overview Capital markets revenues for 13 banks in this report totalled $49bn in 1Q17, 20% ahead of 1Q16. The market was characterised by strong primary and FICC markets, which benefitted US banks far more than their European counterparts. Per-head productivity increased in most product areas, and banks’ continued vigilance on costs led to a 42% y/y surge in overall pre-tax profits, with FICC profits almost doubling. On a related note, and in contrast to their US peers, several European investment banks in this note effected sizeable cuts to their FY16 bonus pools – Deutsche Bank being the most extreme, with an 80% y/y drop – and/or introduced changes in the way bonuses are calculated and paid out. In yet another (and for banks very welcome) setback to the Volcker Rule, The Fed recently formalised its decision to allow banks additional five years to sell ‘legacy covered funds’, provided investments were made before the end of 2013. Goldman Sachs – with c.$6bn worth of investments – is the largest beneficiary; but Citi, PNC and others will also benefit. Deutsche Bank, by contrast, was fined $20m for the violation of the Rule. Commercial/Transaction Banking In the US, commercial lending volumes in the US slowed in January, then dipped in February on political uncertainty generated by the Trump administration and waning US sales figures. Over the same period, average lending rates increased by c.13bp. In Europe, demand continued to increase across all loan types. Inventories and working capital and the general level of interest rates were important positive contributors to demand for commercial loans. In transaction banking, payments volumes jumped 10% versus 1Q16; however, trade finance activity was slightly below 1Q16 levels. The UN is reviewing a perceived trade finance gap. This impacts the SME and mid-cap market, where it is felt that the ‘chronic” shortfall has come about largely on the back of the unintended effects of global financial crime regulation. At the same time, some banks are investing in regulatory technology to cover areas such as cutting the number of ‘false positives’ in their monitoring of suspicious transactions. Wealth Management Lending activity continued to increase in 1Q17 on the back of favourable interest rates. Investment management and brokerage revenues also grew, as clients sought to adjust portfolios in the light of higher market volatility. The industry is in the (selective) expansion mode. HSBC is making a heavy push in Mainland China’s retail and wealth management. J.P.Morgan Securities (led by Chris Harvey from Mar-17) hired a top team from Morgan Stanley for its NYC operation; UBS’ US Wealth Management announced senior hires to boost its capital market capabilities and in Europe, the bank continues its successful rollout of in-house platform SmartWealth. Finally, Barclays announced plans to hire 100 staff for its private banking units across Europe, Dubai and India.

Recommended
Recommended
More Related Content
More from Tricumen Ltd
More from Tricumen Ltd (20)
Recently uploaded
Recently uploaded (20)
Tricumen 1Q17 Wholesale Banking Results Review_open 260517
- 1. Sector 1 / 10 26 May 2017 © Tricumen Limited 2017. All rights reserved. Results Review 1Q17 Capital Markets: Overview Capital markets revenues for 13 banks in this report totalled $49bn in 1Q17, 20% ahead of 1Q16. The market was characterised by strong primary and FICC markets, which benefitted US banks far more than their European counterparts. Per-head productivity increased in most product areas, and banks' continued vigilance on costs led to a 42% y/y surge in overall pre-tax profits, with FICC profits almost doubling. On a related note, and in contrast to their US peers, several European investment banks in this note effected sizeable cuts to their FY16 bonus pools - Deutsche Bank being the most extreme, with an 80% y/y drop - and/or introduced changes in the way bonuses are calculated and paid out. In yet another (and for banks very welcome) setback to the Volcker Rule, The Fed recently formalised its decision to allow banks additional five years to sell 'legacy covered funds', provided investments were made before the end of 2013. Goldman Sachs - with c.$6bn worth of investments - is the largest beneficiary; but Citi, PNC and others will also benefit. Deutsche Bank, by contrast, was fined $20m for the violation of the Rule. Operating Revenue (1Q16) (1Q17) % change share of peer group operating revenue and pre-tax profit (1Q17 / 1Q16) Notes: (1) Tricumen product definitions throughout. (2) Revenue is post-writedowns, excludes DVA/equivalent and one-offs. (3) Headcount: Front office full-time equivalent, adjusted for seniority. (4) Pre-tax profit excludes Prop & Principal Investments.. $0.8m $1.5m $0.7m 0.5 1 1.5 2 2.5 0.8 1 1.2 $0.6m $1.2m $0.6m 0.5 1 1.5 2 2.5 3 0.8 1 1.2 FICC Equity Prop & PrincInv Primary Operating Revenue (US$bn) Op't Revenue /FO FTE Headcount (US$m) Operating Revenue (US$bn) Op't Revenue / FO FTE Headcount (US$m) $0.3bn $1.5bn $11.5bn $11.2bn $18.2bn $22.6bn $10.3bn $13.3bn 0 10 20 30 40 3m16 0.8% -1.4% 0.2% -0.3% -0.2% -1.5% 1.5% 0.2% 0.0% 1.2% 0.2% -0.5% -0.4% 1.0% -1.9% -0.1% -0.5% 2.6% -1.3% -4.3% -0.4% -0.0% 2.0% 1.5% -1.3% 0.7% -0.05 -0.04 -0.03 -0.02 -0.01 0 0.01 0.02 0.03 BAML BARC BNPP Citi CS DBK GS HSBC JPM MS RBS SG UBS mkt share gain mkt share loss Revenue Pre-Tax Profit
- 2. Sector 2 / 10 26 May 2017 © Tricumen Limited 2017. All rights reserved. Capital Markets (cont.): Primary issuance & Advisory The banks in this report saw their 1Q17 DCM and securitisation fees surge by 40% y/y. The growth was driven by leveraged markets and US HG - the highest-ever quarter - and emerging markets' debt. Several banks are actively testing the use of blockchain technology in syndicated loans. In securitisation, US RMBS issuance was robust across all segments, and supported by solid trading. CMBS issuance, however, dropped 40% versus 1Q16. In an effort to revive the stagnant market, the EU finalised the rules for 'simple, transparent and standardised' (STS) securitisation. ECM fees jumped 71% y/y, driven by a surge in IPOs (especially in the US and APAC) and APOs; several banks listed here more than doubled their fee intake versus 1Q16. Fees sourced from the Financial Services sector - easily the largest - tripled y/y, followed by Industrials and Tech. M&A/Advisory fees for 'our' banks were flat versus 1Q16. Banks with stronger US and APAC presence outperformed their more EMEA-focused peers. Operating Revenue (1Q16) (1Q17) % change share of peer group operating revenue and pre-tax profit (1Q17 / 1Q16) Notes: (1) Tricumen product definitions throughout. (2) Revenue is post-writedowns, excludes DVA/equivalent and one-offs. (3) Headcount: Front office full-time equivalent, adjusted for seniority. (4) Pre-tax profit excludes Prop & Principal Investments. $0.6m $1.0m $0.4m 0.5 1 1.5 2 2.5 3 0.8 1 1.2 $0.9m $1.9m $0.4m 0.5 1 1.5 2 2.5 3 0.8 1 1.2 DCM & Securitisation ECM M&A / Advisory Operating Revenue (US$bn) Op't Revenue /FO FTE Headcount (US$m) Operating Revenue (US$bn) Op't Revenue / FO FTE Headcount (US$m) $3.4bn $3.4bn $1.4bn $2.4bn $5.5bn $7.6bn 0 2 4 6 8 10 12 3m16 0.9% -0.5% -0.5% -0.2% 1.3% -1.6% -2.0% 0.5% 0.7% 1.0% 0.0% -0.2% 0.4% 0.8% -2.0% -0.4% -0.5% 4.8% -2.7% -5.1% 0.1% 1.8% 1.7% 0.2% 0.3% 0.9% -0.06 -0.04 -0.02 0 0.02 0.04 0.06 BAML BARC BNPP Citi CS DBK GS HSBC JPM MS RBS SG UBS mkt share gain mkt share loss Revenue Pre-Tax Profit
- 3. Sector 3 / 10 26 May 2017 © Tricumen Limited 2017. All rights reserved. Capital Markets (cont.): FICC FX weakened versus 1Q16 as spot trading dropped across most G10 currency pairs. Forwards also dived in the early part of 1Q17 but picked up towards the end of the quarter. Rates listed futures and swaps surged to record in 1Q17, spurred by the expectation of rate hikes in the US, tapering off of quantitative easing and more favourable regulation. Repo volumes were broadly flat, though banks benefited from improving short-end spreads. US Treasury trading was also steady overall, though TIPS jumped 30% compared to 1Q16. Rate swap trading boomed in January and February on increased volatility and rate rises. In Credit, US high grade trading grew 15% y/y as investors adjusted their portfolios in the light of rising rates; US high yield trading also grew, albeit at a slower pace. Europe, however, saw a slight decline in corporate bond trading activity. European high yield - popular with yield hunters - remains vulnerable to an increase in volatility of credit indexes, currently at a six-year lows. Operating Revenue (1Q16) (1Q17) % change share of peer group operating revenue and pre-tax profit: (1Q17 / 1Q16) Notes: (1) Tricumen product definitions throughout. (2) Revenue is post-writedowns, excludes DVA/equivalent and one-offs. (3) Headcount: Front office full-time equivalent, adjusted for seniority. (4) Pre-tax profit excludes Prop & Principal Investments. $1.7m $1.0m $1.0m $1.1m 0.5 1 1.5 2 2.5 3 0.8 1 1.2 $1.9m $1.3m $1.6m $1.3m 0.5 1 1.5 2 2.5 3 0.8 1 1.2 FX Rates Credit Commodities Operating Revenue (US$bn) Op't Revenue /FO FTE Headcount (US$m) Operating Revenue (US$bn) Op't Revenue / FO FTE Headcount (US$m) $1.2bn $0.9bn $4.1bn $6.3bn $7.2bn $9.8bn $5.8bn $5.5bn 0 5 10 15 20 3m16 1.2% -1.7% 0.3% -0.7% -0.1% -1.7% 0.6% -0.5% 0.1% 3.0% 0.4% -0.2% -0.7% -0.0% -0.9% 0.7% -4.8% 2.5% -0.5% -1.2% -4.0% -3.2% 7.6% 3.7% 0.2% -0.1% -0.06 -0.04 -0.02 0 0.02 0.04 0.06 0.08 0.1 BAML BARC BNPP Citi CS DBK GS HSBC JPM MS RBS SG UBS mkt share gain mkt share loss Revenue Pre-Tax Profit
- 4. Sector 4 / 10 26 May 2017 © Tricumen Limited 2017. All rights reserved. Capital Markets (cont.): Equities In cash equities, crossing and OTC activity in the US, Japan and Europe was up 20-30% versus 1Q16, though both the US and Japan markets declined sequentially. High-touch trading in the US and Japan weakened relative to 1Q16; Europe, however, saw some modest growth and APAC ex- Japan markets were broadly steady. In contrast to cash and prime services, equity derivatives & converts revenue grew versus 1Q16, albeit modestly. Growth in flow markets was largely driven by the US. Over the same period structured issuance surged in the Americas; in Europe and APAC, however, the activity was essentially on a par with 1Q16. Prime services stuttered on falling securities lending and financing activity that more than offset a modest 7% y/y growth in hedge fund AUM. Operating Revenue (1Q16) (1Q17) % change share of peer group operating revenue and pre-tax profit (1Q17 / 1Q16) Notes: (1) Tricumen product definitions throughout. (2) Revenue is post-writedowns, excludes DVA/equivalent and one-offs. (3) Headcount: Front office full-time equivalent, adjusted for seniority. (4) Pre-tax profit excludes Prop & Principal Investments. $0.5m $0.8m $0.7m 0.5 1 1.5 2 2.5 3 0.8 1 1.2 $0.4m $1.0m $0.7m 0.5 1 1.5 2 2.5 3 0.8 1 1.2 EQ Cash EQ Derv'& Converts Prime Services Operating Revenue (US$bn) Op't Revenue /FO FTE Headcount (US$m) Operating Revenue (US$bn) Op't Revenue / FO FTE Headcount (US$m) $2.7bn $2.5bn $4.9bn $5.2bn $3.8bn $3.4bn 0 2 4 6 8 10 3m16 0.4% -1.4% 1.2% 0.4% -1.4% -0.8% -0.9% 0.8% 0.6% 0.2% 0.4% 0.5% 0.6% -2.7% -0.6% 2.1% 0.4% -0.3% 2.5% 3.3% 1.8% -5.2% -6.5% 4.5% -0.08 -0.06 -0.04 -0.02 0 0.02 0.04 0.06 BAML BARC BNPP Citi CS DBK GS HSBC JPM MS RBS SG UBS N/A mkt share gain mkt share loss Revenue Pre-Tax Profit
- 5. Sector 5 / 10 26 May 2017 © Tricumen Limited 2017. All rights reserved. Commercial/Transaction Banking In the US, commercial lending volumes in the US slowed in January, then dipped in February on political uncertainty generated by the Trump administration and waning US sales figures. Over the same period, average lending rates increased by c.13bp. In Europe, demand continued to increase across all loan types. Inventories and working capital and the general level of interest rates were important positive contributors to demand for commercial loans. In transaction banking, payments volumes jumped 10% versus 1Q16; however, trade finance activity was slightly below 1Q16 levels. The UN is reviewing a perceived trade finance gap. This impacts the SME and mid-cap market, where it is felt that the 'chronic" shortfall has come about largely on the back of the unintended effects of global financial crime regulation. At the same time, some banks are investing in regulatory technology to cover areas such as cutting the number of 'false positives' in their monitoring of suspicious transactions. Operating Revenue (1Q16) (1Q17) % change share of peer group operating revenue and pre-tax profit (1Q17 / 1Q16) Notes: (1) Tricumen product definitions throughout. (2) Revenue is post-writedowns, excludes DVA/equivalent and one-offs. (3) Headcount: Front office full-time equivalent, adjusted for seniority. (4) Pre-tax profit excludes Prop & Principal Investments. (5) In-scope: Large Cap/MNC and Mid-Cap/SMEs. $1.0m $0.5m 0.5 1 1.5 2 2.5 0.8 1 1.2 $1.0m $0.5m 0.5 1 1.5 2 2.5 0.8 1 1.2 Commercial Banking Treasury Services Operating Revenue (US$bn) Op't Revenue /FO FTE Headcount (US$m) Operating Revenue (US$bn) Op't Revenue / FO FTE Headcount (US$m) $7.7bn $9.2bn $10.7bn $10.8bn 0 5 10 15 20 3m16 -0.3% -4.5% -1.3% -1.5% 6.3% 1.2% 2.5% -5.3% -0.5% -0.8% 3.4% 0.8% -0.06 -0.04 -0.02 0 0.02 0.04 0.06 0.08 BAML BNPP Citi DBK HSBC JPM mkt share gain mkt share loss Revenue Pre-Tax Profit
- 6. Sector 6 / 10 26 May 2017 © Tricumen Limited 2017. All rights reserved. Wealth Management Lending activity continued to increase in 1Q17 on the back of favourable interest rates. Investment management and brokerage revenues also grew, as clients sought to adjust portfolios in the light of higher market volatility. The industry is in the (selective) expansion mode. HSBC is making a heavy push in Mainland China's retail and wealth management. J.P.Morgan Securities (led by Chris Harvey from Mar-17) hired a top team from Morgan Stanley for its NYC operation; UBS' US Wealth Management announced senior hires to boost its capital market capabilities and in Europe, the bank continues its successful rollout of in-house platform SmartWealth. Finally, Barclays announced plans to hire 100 staff for its private banking units across Europe, Dubai and India. Operating Revenue (1Q16) (1Q17) % change share of peer group operating revenue and pre-tax profit (1Q17 / 1Q16) Notes: (1) Tricumen product definitions throughout. (2) Revenue is post-writedowns, excludes DVA/equivalent and one-offs. (3) Headcount: Front office full-time equivalent, adjusted for seniority. (4) Pre-tax profit excludes Prop & Principal Investments. $0.3m 0.5 1 1.5 2 2.5 3 0.8 1 1.2 $0.3m 0.5 1 1.5 2 2.5 3 0.8 1 1.2 Lending Investment Management Brokerage Operating Revenue (US$bn) Op't Revenue /FO FTE Headcount (US$m) Operating Revenue (US$bn) Op't Revenue / FO FTE Headcount (US$m) $2.4bn $2.9bn $7.6bn $7.9bn $4.6bn $4.9bn $0.5bn $0.5bn 0 2 4 6 8 10 12 14 16 3m16 Advisory -0.3% -0.2% -0.9% 0.7% 1.1% -0.4% -3.0% 0.8% -0.1% 0.5% 1.2% 1% -0.035 -0.03 -0.025 -0.02 -0.015 -0.01 -0.005 0 0.005 0.01 0.015 BAML CS DBK JPM MS UBS mkt share gain mkt share loss Revenue Pre-Tax Profit
- 7. Sector 7 / 10 26 May 2017 © Tricumen Limited 2017. All rights reserved. Revenue dynamics 1Q17 / 1Q16 (Operating revenue, % change, US$, Global Level 1) Source: Tricumen. Notes: (1) Tricumen product definitions throughout. (2) Arrows show % change in revenue vs peers. Up- /down-arrows: top-/bottom-quartile. (3) Revenue is post-writedowns, excludes DVA/equivalent and one-offs, as described in the Company Section. (4) In-scope: Large Cap/MNC and Mid-Cap/SMEs. BAML BARC BNPP Citi CS DBK GS HSBC JPM MS RBS SG UBS Top 25% Bottom25% Capital Markets +29% +10% Primary +43% +18% DCM Bonds +64% +17% DCM Loans +95% +27% Securitisation +21% -13% ECM N/M +90% +24% M&A / Advisory N/M +15% -5% Sales & Trading +25% +1% FX +4% -22% Rates +65% +14% Credit N/M +77% +14% Commodities N/M -0% -46% EQ Cash N/M -5% -13% EQ Derv & Converts N/M +19% -2% Prime Services N/M +5% -10% Prop Trading N/M N/M N/M N/M N/M N/M N/M N/M N/M N/M +10% -52% Principal Investments N/M N/M N/M N/M N/M N/M N/M N/M +71% +10% Commercial / Transaction Banking N/M N/M N/M N/M N/M N/M N/M +14% -6% Commercial Banking N/M N/M N/M N/M N/M N/M N/M +14% -10% Treasury Services N/M N/M N/M N/M N/M N/M N/M +15% +1% Wealth Management N/M N/M N/M N/M N/M N/M N/M +10% +6% Advisory N/M N/M N/M N/M N/M N/M N/M +10% -10% Lending N/M N/M N/M N/M N/M N/M N/M +8% +4% Investment Management N/M N/M N/M N/M N/M N/M N/M +6% +2% Brokerage N/M N/M N/M N/M N/M N/M N/M +16% +1%
- 8. Sector 8 / 10 26 May 2017 © Tricumen Limited 2017. All rights reserved. Operating cost / income (US$, Global Level 1) Capital Markets Banking FICC Equities Source: Tricumen. Notes: (1) TRIC product definitions, standard deviation, product Level 1; (2) Operating expenses exclude one-off non-operational items, insurance-related benefits & claims, and credit expense/recovery/NPL provisions. Capital expenditure is included as accrued. Litigation expense is allocated to front-line units. (3) positive values indicate outperformance; missing fields indicate that data is not meaningful, or available; (4) outliers are excluded. (5) RBS does not compete in Equities markets. -2.0 -1.0 0.0 1.0 2.0 3.0 BAML BARC BNPP Citi CS DBK GSHSBC JPM MS RBS SG UBS 3m17 Peer Gp Avg -2.0 -1.0 0.0 1.0 2.0 BAML BARC BNPP Citi CS DBK GSHSBC JPM MS RBS SG UBS 3m17 Peer Gp Avg -2.0 -1.0 0.0 1.0 2.0 BAML BARC BNPP Citi CS DBK GSHSBC JPM MS RBS SG UBS 3m17 Peer Gp Avg -2.0 -1.0 0.0 1.0 2.0 3.0 BAML BARC BNPP Citi CS DBK GS HSBC JPM MS SG UBS 3m17 Peer Gp Avg
- 9. Sector 9 / 10 26 May 2017 © Tricumen Limited 2017. All rights reserved. Operating revenue / FO headcount (FTE, US$, Global Level 1) Capital Markets Banking FICC Equities Source: Tricumen. Notes: (1) TRIC product definitions, standard deviation, product Level 1; (2) positive values indicate outperformance; missing fields indicate that data is not meaningful, or available; (3) outliers are excluded. (4) RBS does not compete in Equities markets. -2.0 -1.0 0.0 1.0 2.0 BAML BARC BNPP Citi CS DBK GSHSBC JPM MS RBS SG UBS 3m17 Peer Gp Avg -2.0 -1.0 0.0 1.0 2.0 3.0 BAML BARC BNPP Citi CS DBK GSHSBC JPM MS RBS SG UBS 3m17 Peer Gp Avg -2.0 -1.0 0.0 1.0 2.0 BAML BARC BNPP Citi CS DBK GSHSBC JPM MS RBS SG UBS 3m17 Peer Gp Avg -2.0 -1.0 0.0 1.0 2.0 BAML BARC BNPP Citi CS DBK GS HSBC JPM MS SG UBS 3m17 Peer Gp Avg
- 10. Sector 10 / 10 26 May 2017 © Tricumen Limited 2017. All rights reserved. About Tricumen Tricumen was founded in 2008. It quickly became a strong provider of diversified market intelligence across the capital markets and has since expanded into transaction and corporate banking as well as asset and wealth management. Tricumen’s data has been used by many of the world’s leading investment banks as well as strategy consulting firms, investment managers and ‘blue chip’ corporations. Situated near Cambridge in the UK, Tricumen is almost exclusively staffed with senior individuals with an extensive track record of either working for or analysing banks; and boasts what we believe is the largest capital markets-focused research network of its peer group. Notes & Caveats No part of this document may be reproduced or transmitted in any form by any means without written permission of Tricumen Limited. Such consent is often given, provided that the information released is sourced to Tricumen and that it does not prejudice Tricumen Limited’s business or compromise the company’s ability to analyse the financial markets. Full acknowledgement of Tricumen Limited must be given. Tricumen Limited has used all reasonable care in writing, editing and presenting the information found in this report. All reasonable effort has been made to ensure the information supplied is accurate and not misleading. For the purposes of cross- market comparison, all numerical data is normalised in accordance to Tricumen Limited’s proprietary product classification. Fully-researched dataset may contain margin of error of 10%; for modelled datasets, this margin may be wider. The information and commentary provided in this report has been compiled for informational purposes only. We recommend that independent advice and enquiries should be sought before acting upon it. Readers should not rely on this information for legal, accounting, investment, or similar purposes. No part of this report constitutes investment advice, any form of recommendation, or a solicitation to buy or sell any instrument or to engage in any trading or investment activity or strategy. Tricumen Limited does not provide investment advice or personal recommendation nor will it be deemed to have done so. Tricumen Limited makes no representation, guarantee or warranty as to the suitability, accuracy or completeness of the report or the information therein. Tricumen Limited assumes no responsibility for information contained in this report and disclaims all liability arising from negligence or otherwise in respect of such information. Tricumen Limited is not liable for any damages arising in contract, tort or otherwise from the use of or inability to use this report or any material contained in it, or from any action or decision taken as a result of using the report. © Tricumen Limited 2017. All rights reserved