Recommended

Recommended
More Related Content
Similar to Hamline University Poster
Similar to Hamline University Poster (20)
Hamline University Poster
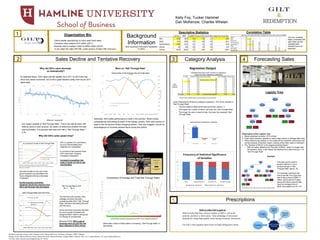
- 1. Gilt is a pioneer of e-commerce, as such Gilt benefited from relatively low competition. E-commerce has boomed since Gilt’s early days, bringing increased competition. Increased competition has made it harder for Gilt to sell merchandise. Gilt was founded on the eve of the great recession and benefited from luxury designers facing a decrease in demand. As the economy recovered, designers faced less pressure and Gilt’s sell through rate decreased. The fact that until recently, Gilt’s average unit price has been increasing while Gilt’s “Sell Through Rate” has been decreasing fits well with this story. As the economy improved, demand for luxury goods increased and designers didn't need to sell goods so cheaply to compensate. Because of this, Gilt’s cost of business went up and this has been reflected in Gilt’s prices. As depicted below, Gilt’s sales rate fell steadily from 2011 to 2014 and has since very slowly recovered, but is still a great distance away from its pre 2011 sales rates. Why did Gilt’s value decrease so dramatically? What am I looking at? Our output variable is “Sell Through Rate.” This is the rate at which Gilt sells its stock of each product; we used it to determine whether the sale was successful. A successful sale was one with a “Sell Through Rate” > 0.75. Why did Gilt’s sales speed drop? Comparison of Average and Total Sell Through Rates Background Information Most significant information highlighted In yellow. Descriptive Statistics Correlation Table The only variables highly correlated with each other are the variables that represent price as expected. Linear Regressions divided by category explained ~15% of the variation in “Sell Through Rate”. ○ The five seasons listed performed worse than season -1 ○ The higher the number of SKUs, the lower the “Sell Through Rate” ○ The longer the sale is meant to last, the lower the expected “Sell Through Rate” Observations from Logistic Tree o Model predicted correctly ~67% of time o Final node’s decision variable on each major branch is average sale price o When determining whether or not a sale will be important, assuming it will not fail because of another reason, looking at the other sales is important o The “Number of SKUs” is the largest predictive factor • With all nodes related to the “Number of SKUs,” when it is larger than the decision value, it will reduce the likelihood of a sale having a >.75 “Sell Through Rate” Forecasting SalesCategory Analysis Online retailer specializing in luxury wear flash sales. Company value peaked at $1 billion (2011). Recently sold to Hudson’s Bay for $250 million (2016). To be rolled into Saks Off Fifth, outlet version of Saks Fifth Avenue(*). Organization Bio Sales Decline and Tentative Recovery While total number of flash sales is increasing, “Sell Through Rate” is decreasing. Prescriptions5 3 42 1 Stick to what Gilt is good at. Shift to looks that have a fewer number of SKUs, sell in the summer, and have a lower price. Take advantage of increased demand for cheap high quality items during economic downturns. For Gilt’s most popular items focus on high selling price items. Regression Output Logistic Tree Sell Through Rate Up Summer Economic Conditions Popular High $ General Low $ Lower SKUS Products used and sources cited :Analysis tools: Microsoft Excel, XLMiner, R-Studio, SPSS, Tableau Design Tools: Microsoft Power Point, Microsoft Word, Microsoft Paint, Google Slides. Sources: Gilt, U.S. Census Bureau , St. Louis Federal Reserve, *Forbes: http://tinyurl.com/z8zqkmd (Jan, 07, 2016) & REDEMPTION More on “Sell Through Rate” Seasonality of sell through rate and total sales Generally, Gilt’s sales performance is best in the summer. While it does comparatively well selling its stock in the holiday months, Gilt’s total volume of sales is low during the holiday shopping season. This may suggest it would be advantageous to increase stocked items during this period. This tree can be used to predict whether or not a product will get a “Sell Through Rate” above .75. For example, looking to the tree to the left, for a new look that is has a price of $200, 3 SKUs, and is sold for 3 days along with other products that have an average price of $200, this predicts an ST<.75. Kelly Foy, Tucker Hammel Dan McKenzie, Charles Whelan E-Commerce Growth & Sell Through Rate Sell Through Rate & GDP STR GDP Sell Through Rate and Unit Price R2 value Number of SKUs Atypical Seasonality Unit Price/MSRP Sale Duration 1 0.12 -0.02 No 0.50 -0.02 2 0.13 -0.01 Seasons ending in 545 and 685 0.42 N.S. 3 0.23 -0.02 No 0.68 0.01 4 0.12 -0.03 No N.S. -0.02 5 0.20 -0.02 No N.S. -0.03 6 0.13 -0.01 No 0.46 0.01 7 0.16 -0.01 No 0.18 -0.01 8 0.18 -0.03 No 0.55 N.S. 9 0.14 -0.02 No 0.73 N.S. 10 0.11 -0.02 No 0.33 N.S. Average 0.15 -0.02 -1 is the best selling season 0.48 -0.01 Most Frequent Categories Variables that were most common in regression output and their respective coefficients Example *When value in node is less, go left; when value is greater go right *Season titles arbitrarily titled as actual seasons were encrypted.