Brexit risks subside, with flash PMIs key data this week
Strategy - Leading Indicators - June 2016
1. Leading Indicators All Rights Reserved ®
After the initial wave of volatility and uncertainty caused by the Brexit a couple weeks ago, investors are coming to
the conclusion that the real effects of the result on UK, Europe, and even the Global economy will take months, if
not years, to develop.
Having said that, I believe the uncertainty emerged from the Brexit, and markets “knee-jerk” reaction, will slowly
move to the background, opening space to coming economic data (as today’s employment report & last week
Manufacturing surveys), especially in the US, to take place as the main focus to investors.
Within that spectrum, there are a few indicators, which empirically, provide a strong leading correlation to equities
and earnings growth; and three of my favorites I have shown below:
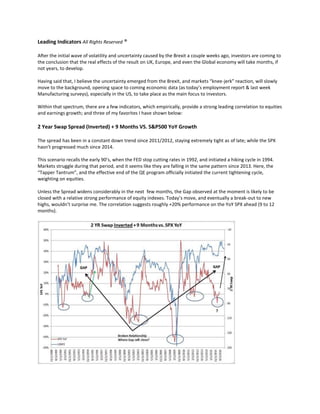
2 Year Swap Spread (Inverted) + 9 Months VS. S&P500 YoY Growth
The spread has been in a constant down trend since 2011/2012, staying extremely tight as of late; while the SPX
hasn’t progressed much since 2014.
This scenario recalls the early 90’s, when the FED stop cutting rates in 1992, and initiated a hiking cycle in 1994.
Markets struggle during that period, and it seems like they are falling in the same pattern since 2013. Here, the
“Tapper Tantrum”, and the effective end of the QE program officially initiated the current tightening cycle,
weighting on equities.
Unless the Spread widens considerably in the next few months, the Gap observed at the moment is likely to be
closed with a relative strong performance of equity indexes. Today’s move, and eventually a break-out to new
highs, wouldn’t surprise me. The correlation suggests roughly +20% performance on the YoY SPX ahead (9 to 12
months).
2. ISM Manufacturing +2 Quarters VS. S&P500 EPS YoY Growth
The ISM Manufacturing Survey is one of the strongest leading indicators to equities earnings growth. The
disappointing SPX earnings of the past couple of quarters were well “advised” by the survey.
Although, looking ahead, the latest data suggests a pick-up in earnings momentum, somewhere from +20 to 40%
growth for the next couple quarters. If earnings growth materializes as the ISM suggests, the current market PE at
current levels will move down to the long term average, opening up room for further upward momentum.
3. Real Monetary Base YoY +14 Months VS. S&P500 YoY Growth
Real Monetary Base growth has dropped from End of 2014 to End of 2015. Since then, it has been trending
sideways. Keep in mind that the base is extremely high since the increase after the FED stimulus from 2008, but
refused to translate into lending growth because the velocity of money has dropped considerably.
Here, if the economic data continues to surprise to the upside, I suspect we will, again, be at the bottom of the
RMB growth as observed before 2009, in 2011, and 2013. A pick-up from here would also suggest strong Equities
performance in the next 12 to 14 months.
Daniel Mancia Nunes
All Rights Reserved ®