1. Current Current
Manager Coordinator Scheduler Plan Actual Variance
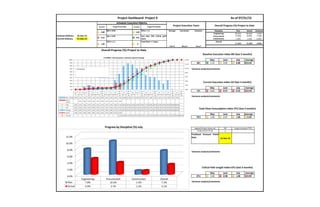
90.20% 86.80% -3.40%
Contract Delivery 31-Dec-15 15.50% 8.00% -7.50%
Current Delivery 31-Dec-15 1.20% 1.20% 0.00%
Project Duration (d)12-Jun-14 567 17.10% 12.20% -4.90%
John D Mary B Anne F
May June July Average
BEI 1.14 0.85 0.88 0.96
May June July Average
CEI 0.83 0.37 0.55 0.58
May June July Average
TFCI 1.00 0.97 1.00 0.99
567
0
31-Dec-15
May June July Average
CPLI 1.00 0.98 1.00 0.99
Variance analysis/comments:
Predicted CP TF (d)
Predicted Forecast Finish
Date
Variance analysis/comments:
Critical Path Length Index-CPLI (last 3 months)
Applied Project Status (d) Project duration*TFCI
Progress by Discipline (%)-July
Baseline Execution Index-BEI (last 3 months)
Current Execution Index-CEI (last 3 months)
Total Float Consumption Index-TFCI (last 3 months)
Variance analysis/comments:
Variance analysis/comments:
OverallTotal float >= 5 days
CEI>= 0.95
Project Execution Team Overall Progress (%)-Project to Date
Discipline
Engineering
Procurement
01.00
TFCI>= 1.1
Overall Progress (%)-Project to Date
Project Dashboard: Project X As of 07/31/15
0.88
0.55
Less than 15% critical path
items Construction
BEI>= 0.95
Schedule Execution Metrics
1.00
CPLI>= 1.1
15%
Target/Threshold Target/Threshold
Comments
0.0%
2.0%
4.0%
6.0%
8.0%
10.0%
12.0%
Engineering Procurement Construction Overall
Plan 7.8% 10.2% 1.2% 7.3%
Actual 4.9% 3.7% 1.2% 3.1%