Prop. of tech investments by location & round number
•
0 likes•124 views

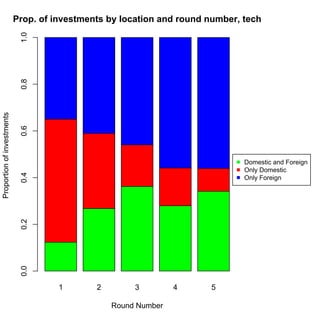
This graph shows the proportion of investments by location and round number for technology companies. Early stage investments are more likely to come from domestic sources only, while later stage investments have a higher proportion of both domestic and foreign investors. Rounds 4 and 5 have the highest proportion of investments that include foreign investors.

Recommended
More Related Content
More from Dan Wang
More from Dan Wang (14)
Recently uploaded
Recently uploaded (20)
Prop. of tech investments by location & round number
- 1. Prop. of investments by location and round number, tech 1.0 0.8 Proportion of investments 0.6 Domestic and Foreign Only Domestic 0.4 Only Foreign 0.2 0.0 1 2 3 4 5 Round Number