Prop. of tech investments by location & round number
•
0 likes•76 views

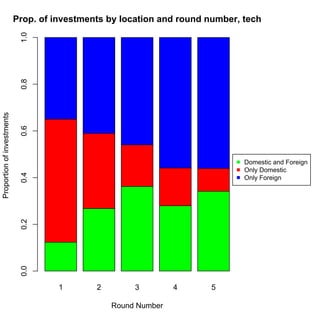
This graph shows the proportion of investments by location and round number for technology companies. Early rounds have a higher proportion of domestic investments, while later rounds see an increase in foreign and mixed domestic-foreign investments as companies grow in size and scope. The majority of round 1 investments are domestic-only, but by round 5 the proportions of only domestic, mixed, and only foreign investments are more evenly split.

Recommended
More Related Content
More from Dan Wang
More from Dan Wang (15)
Recently uploaded
Recently uploaded (20)
Prop. of tech investments by location & round number
- 1. Prop. of investments by location and round number, tech 1.0 0.8 Proportion of investments 0.6 Domestic and Foreign Only Domestic 0.4 Only Foreign 0.2 0.0 1 2 3 4 5 Round Number