1. CONCURRENT ENROLLMENT PROGRAMS AND ACQUIRED SOCIAL CAPITAL
FOR STUDENTS FROM IMPOVERISHED BACKGROUNDS:
AN EXAMINATION OF HIGH SCHOOL AND COLLEGE OUTCOMES
__________
A Dissertation
Presented to
The Faculty of the Morgridge College of Education
University of Denver
__________
In Partial Fulfillment
of the Requirements for the Degree
Doctor of Philosophy
__________
by
Dan D. Jorgensen
November 2013
Advisor: Dr. Kent Seidel
3. ii
Author: Dan D. Jorgensen
Title: CONCURRENT ENROLLMENT PROGRAMS AND ACQUIRED SOCIAL
CAPITAL FOR STUDENTS FROM IMPOVERISHED BACKGROUNDS: AN
EXAMINATION OF HIGH SCHOOL AND COLLEGE OUTCOMES
Advisor: Dr. Kent Seidel
Degree Date: November 2013
Abstract
Poverty has been linked to reduced workforce opportunities, reduced college-
going rates, increased social-emotional challenges, and even negative health
consequences. Postsecondary educational opportunities, offered during high school, that
contribute to the acquisition of social capital may improve academic outcomes for
students from impoverished backgrounds. The Colorado concurrent enrollment
legislation, provides one opportunity for students to enroll in college level coursework
and receive college credits with tuition being paid through state funding while in high
school. Concurrent enrollment (CE) programs support the college application, financial
aid and enrollment processes. Most importantly, they also support the development of
social networks that may foster beneficial secondary and postsecondary outcomes. This
dissertation examines the participation and representation rates of free and reduced lunch
(FRL) students in CE programs at the state and local level. Next, the impact of CE
participation on secondary and postsecondary outcomes in students from impoverished
backgrounds is examined. The quasi-experimental research design included a matched
control group generated by logistic regression and propensity score matching techniques.
A sensitivity analysis was conducted to estimate unaccounted for variance that may have
4. iii
contributed to any observed between-group differences. Between-group differences were
examined for a range of outcomes at the high school and postsecondary level. The study
analysis was replicated utilizing two additional groups of program participants across two
years to increase confidence in the obtained findings.
Overall, the findings indicate that FRL students were slightly underrepresented as
concurrent enrollment participants during the 2011 academic year. A limited
number of local education agencies had FRL student participation rates that exceeded
enrollment expectations. Statistical analysis indicated that FRL students earned CE
credits at a lower rate than their non-eligible peers. In contrast, the FRL students enrolled
for a larger number of CE credits than non-eligible students. Additional analysis revealed
that a number of positive secondary and postsecondary outcomes were related to
concurrent enrollment participation for economically disadvantaged students. The results
of sensitivity analyses indicate that other, unaccounted for variables were unlikely to
have impacted the obtained findings.
The findings of this study indicate that concurrent enrollment opportunities may
mitigate some of the deleterious impacts of poverty by improving academic achievement
and college-going rates. The beneficial role of social capital for achievement of
postsecondary success is discussed.
Keywords: accelerated programs, concurrent enrollment, dual credit, dual enrollment,
postsecondary educational opportunities, poverty, poverty cycle, social capital
5. iv
Acknowledgements
I want to begin by recognizing the support of my committee members. Your
feedback contributed greatly to the improvement of this dissertation. Also, my utmost
gratitude goes to Dr. Linda Brookhart for getting me back on the academic path.
I would be remiss if I failed to specifically acknowledge Lori Kohl, Adena
Miller, and Jane Walsh for participating in our Saturday work group. It definitely made
the work of writing a dissertation a bit easier and much more enjoyable then it might have
been otherwise.
My deepest thanks go to my family. My wife and children, Amy, Mercedes,
Adina, and Evan, provided me with the encouragement to further my education. I
appreciate all of your sacrifices that allowed me to pursue my dream. There’s nothing
more important than my relationship with each of you. It is Phyllis and Gailen who gave
me the skills, resources, and motivation to first step into a college classroom. Thank you
both. I’m blessed to have you as parents.
This dissertation has raised my awareness of the plight of children that reside in
poverty. We must always remember that these children are the future neighbors, friends,
and work colleagues of our own children. We can’t do what’s right for our own children
if we don’t support all of the children within the communities in which we live.
I dedicate this dissertation to the loving memory of Jo Hanson who was my
cousin, friend and mentor. You were a true teacher and scholar. You are dearly missed.
6. v
Table of Contents
Abstract……………........................................................................................................... ii
Acknowledgements….........................................................................................................iv
Table of Contents…….........................................................................................................v
List of Tables…….......................................................................................................... .viii
List of Figures………......................................................................................................... x
Chapter One: Introduction .................................................................................................. 1
Background…......................................................................................................... 1
Rationale and Significance of Study....................................................................... 4
Need for the Study .................................................................................................. 5
Research Questions................................................................................................. 9
Limitations……………………………………………………………………….10
Summary…………………………………………………………………………12
Definition of Terms............................................................................................... 13
Academic Outcomes................................................................................. 13
Behavioral Outcomes................................................................................ 13
Concurrent Enrollment.............................................................................. 14
Concurrent Enrollment Credit................................................................... 14
Dual Enrollment........................................................................................ 14
Free and Reduced Lunch .......................................................................... 15
Impacted Students..................................................................................... 15
Local Education Agencies……………………………………………….15
Low-Income Students…………………………..……………………..…15
Postsecondary Enrollment Opportunities..................................................16
Poverty………………………………………………………...…………16
Remedial Education……………………………………………………...16
Social Capital.............................................................................................16
Chapter Two: Literature Review ...................................................................................... 18
Social Capital Theory ........................................................................................... 18
Social Capital and Education.................................................................... 19
Quality of Life and College Completion .............................................................. 20
Impact on Health....................................................................................... 21
Impact on Earnings ................................................................................... 22
7. vi
Equity and Access to College ............................................................................... 25
Poverty...................................................................................................... 25
Race and Ethnicity.................................................................................... 26
Dominant Cultural Norms and Values...................................................... 27
Concurrent Enrollment Programs ......................................................................... 27
Colorado Concurrent Enrollment.............................................................. 31
Concurrent Enrollment Program Act........................................................ 31
Impact of Legislation on Student Outcomes............................................. 33
Key Components of Effective CE Programs ........................................................ 34
Summary……....................................................................................................... 36
Chapter Three: Methodology............................................................................................ 38
Background…....................................................................................................... 38
Study Design......................................................................................................... 40
CE Participation and Representation Rates .......................................................... 43
CE Program Impacts in High School and College................................................ 44
Data Sources & Operational Definitions .............................................................. 44
Population and Cohort Description....................................................................... 46
Analysis……………………................................................................................. 47
Data Analysis Software Tools .................................................................. 47
Missing Data Analysis Procedures ........................................................... 48
Propensity Score Matching (PSM) ........................................................... 49
Logistic Regression Procedure ..................................................... 50
Case Matching Procedure ............................................................. 51
Sensitivity Analysis ...................................................................... 52
Between-Group Comparisons................................................................... 53
Independent/Dependent Samples t-tests ....................................... 53
Mann-Whitney U-Tests ................................................................ 54
Chapter Four: Results .......................................................................................................55
CE Representation Rates of FRL Students within the State of Colorado………..55
Recruitment of FRL Students by Local Education Agencies……………………58
Credit Accumulation and Remediation Rates……………………………………61
CE Participation Rates by Economically-Disadvantaged Graduates…………….63
CE Program Participation Outcomes.....................................................................66
Logistic Regression & Propensity Score Analysis Matching……………66
Sensitivity Analysis ...................................................................................74
8. vii
Between-Group Comparison of Impact During High School and College ......... 74
CE1 Results……………………………………………………………...75
CE2 Results……………………………………….……………….…….76
CE1/2 Results…………………………………………..………….…….76
Chapter Five: Discussion.................................................................................................. 81
Introduction ....................................................................................................... 81
Relationship with Previous Research.................................................................... 82
Implications…....................................................................................................... 83
Barriers to Program Effectiveness & Participation….…………...……....83
The Relationship of CE Programs and Colorado Policy .......................... 85
CE Program Development........................................................................ 85
Limitations of the Study….................................................................................... 85
Recommendations for Future Research................................................................ 88
References…………......................................................................................................... 91
Appendix A. IRB Approval Letter: University of Denver ..........................................…101
Appendix B. IRB Approval Letter: Colorado Department of Education………………103
Appendix C. District FRL Participation in CE Programs by Year…………..…………105
9. viii
List of Tables
Table 1. Data Elements for Propensity Score Matching Procedure……………………...51
Table 2. CE Participation Rates by Year and FRL Status…………………………….....57
Table 3. Representation Rates of FRL Students Compared to State FRL
Membership……………………………………………………………………………...58
Table 4. CE Participation Rates based on FRL Status between years for
Largest Providers………………………………………………………………………...60
Table 5. CE Credits Attempted and Earned based on FRL Status between years……….61
Table 6. Percent of CE Students Enrolling in Remedial Coursework by FRL Status...…62
Table 7. Remedial Credits Attempted by Subject, FRL Status, and Year...…………..…63
Table 8. CE Participation Rates by Graduate Class of 2009, 2010, 2011, & 2012……...65
Table 9. CE Participation Rates by Graduates with FRL Eligibility: Class of
2011 & 2012……………………………………………………………………...…..….65
Table 10. Logistic Regression Coefficients for PSM Procedure by
CE Sample (Cohorts)…………………………………………………………………….68
Table 11. CE Participants and Matched Groups: Counts by Cohort…………………….69
Table 12. Demographic Composition of Unmatched and Matched Groups (CE1)…..….71
Table 13. Demographic Composition of Unmatched and Matched Groups (CE2)…..….72
Table 14. Demographic Composition of Unmatched and Matched Groups (CE1/2)…....73
Table 15. Sensitivity Analysis of Ranked-Pairs….……..…….…………………………74
Table 16. Between-Group Differences in CE1 Outcome Measures by Free
and Reduced Lunch Status….……………………………………………………………78
Table 17. Between-Group Differences in CE2 Outcome Measures by Free
and Reduced Lunch Status………………………………………...……………………..79
10. ix
Table 18. Between-Group Differences in CE1/2 Outcome Measures by Free and
Reduced Lunch Status………………………………………...…………………...……..80
11. x
List of Figures
Figure 1. Career Salary Projections based on Level of Education……………………....22
Figure 2. Proposed Relationship between Education and Earnings……………………..24
Figure 3. Proposed Relationship between Education and Income Poverty………..….....24
Figure 4. Quasi-Experimental Design with Matched Control Group...……………..…...41
Figure 5. Demographic Comparisons of Treatment and Unmatched/Matched
Control Groups of FRL Students for CE1…………………………………………….…71
Figure 6. Demographic Comparisons of Treatment and Unmatched/Matched
Control Groups of FRL Students for CE2..……..…………………………………..…..72
Figure 7. Demographic Comparisons of Treatment and Unmatched/Matched
Control Groups of FRL Students for CE1/2…………………………………………..…73
12. 1
Chapter One: Introduction
Background
A vast body of research in education, sociology, public policy and criminal justice
is showing that poverty, as a single factor, and the poverty cycle, in its cumulative
aspects, may be the one of the largest challenges in the achievement of societal successes
for an individual, a community and our Nation (Brooks-Gunn & Duncan, 1997; Gamoran
& Long, 2006; PRRAC, 2011). Per the 2012 "Kids Count" report, the percentage of
children living in poverty increased by nearly a third between 2000 and 2010, and rose 16
percent between 2005 and 2010. The number of school-aged children that reside in
poverty in the United States is now over 16 million children (2012). Approximately 22%
of all children live in families with incomes below the federal poverty level – $23,550 a
year for a family of four (National Center for Children in Poverty, 2013).
It has been argued that poverty may serve as the primary factor in inhibiting
access to and achievement in postsecondary educational opportunities which, in itself,
will limit upward economic mobility for many children. With a college degree, children
born to parents in the bottom quintile of incomes reduce their chance of remaining at that
13. 2
level by up to two thirds (Ferguson, Bovaird, & Mueller, 2007; Haskins, Holzer, &
Lerman, 2009).
Yet, the dichotomy does not lie within the agreed fact that with a college degree,
children in poverty situations are positioned to significantly improve their economic
future; it lies in the fact that the rate for children in these poverty situations earning an
advanced degree is low (Choy, 2002; Provasnik & Planty, 2008; Aud et al., 2012). This
low rate of college completion serves to perpetuate generational poverty by excluding
individuals from employment opportunities that provide higher salaries. Providing an
answer to breaking the poverty cycle without providing the tools to achieve that solution
are discouraging.
In today's increasingly competitive, global economy, all students need to graduate
from high school prepared for postsecondary education. Almost 85 percent of current
jobs and 90 percent of new jobs in occupations with both high growth and high wages
will require workers with at least some postsecondary education (The Alliance, 2007).
With the low rate of college completion of students in poverty situations comes the
creation of a perpetuate generational poverty cycle by creating a ceiling that will exclude
individuals from career advancement or employment opportunities that provide higher
salaries and more financial security. In effect, access to high paying jobs in a post-
industrial workforce is increasingly based on having a college degree and/or specialized
postsecondary training.
14. 3
In the past, the prevailing societal expectations of who should attend college,
paired with a lack of financial resources, and lack of postsecondary social networks
served to marginalize the impoverished populations that were most in need of these
opportunities. This occurred even though it had been shown that increased postsecondary
opportunities support the amelioration of the cycle of poverty (Haskins, Holzer, Lerman,
2009).
In 2009, the Colorado General Assembly unanimously passed the Concurrent
Enrollment Programs Act (Colorado Department of Education, 2010). Instead of
focusing attention on highly able, college-bound students, the Concurrent Enrollment
Programs Act extended the delivery of college-level courses to all eligible students in
high schools throughout Colorado, grades 9-12. In addition, the legislation addressed
gaps in student achievement by; authorizing the delivery of ‘remedial’ courses to students
in their 12th grade year. Finally, the legislation merged the K-12 and postsecondary
education systems by creating the nation’s first statewide “fifth year” dual degree
program, called (ASCENT). According to the Education Commission of the States, at
that time, no state in the nation had a comprehensive, statewide 5th-year option available
to all public high schools. In 2011-12 approximately 24,000 students participated in some
type of dual enrollment program in Colorado (Bean, White, & Ruthven, 2013).
This study focuses on the ability and necessity to position students to successfully
participate and achieve in concurrent enrollment programs. This participation is
proposed, via this research, to improve academic and social outcomes for impoverished
15. 4
students by increasing access to social capital. Social capital, in its simplest form, refers
to social relations that have productive benefits (Claridge, 2004). All individuals have
access to their own acquired social capital. However, some marginalized groups may
have reduced access to a form of social capital that is best able to support college going
pursuits. In this study, social capital refers to an increase in both social networks and
activities resulting from Concurrent Enrollment participation that support the college
enrollment, attendance, and expectations process. This includes newly established or
expanded relationships with teachers and counselors. It may also include familial
relationships that become more supportive by fostering more favorable perceptions of
postsecondary activities. All of these relationships may promote college going values and
norms that support the pursuit of additional postsecondary pursuits while also improving
high school academic performance and social behaviors.
Rationale and Significance of Study
This dissertation explores the impact of participation in the Colorado concurrent
enrollment program to improve academic and social outcomes for students of poverty
during both high school and college. The increasing number of students that reside in
economically-disadvantaged environments, the growing need for postsecondary
education for successful workforce transitions, and the recognition of differential access
to community and social resources that lead to successful college-going behaviors are the
platform for this dissertation. It is hypothesized that increased access to postsecondary
opportunities will foster improved academic and behavioral outcomes for historically
16. 5
underserved students. It is expected that the recruitment and participation of these
students in concurrent enrollment programs will strength a student’s perception of the
value of postsecondary advancement, facilitate student engagement in their academic
position, support the development of important social networks and mentorships, and will
introduce the student to the norms and expectations of the college-going experience.
It is believed that concurrent enrollment participation will serve as a catalyst for
both short and long term changes in secondary and postsecondary school engagement and
achievement. The college experience will foster the norms regarding academic
relationships, achievement, and behavior that will improve high school outcomes and
postsecondary success. The impact during high school is expected to include improved
graduation rates and achievement along with a reduction in expulsions and dropouts. It is
believed that the need for college remediation will be reduced while college-going rates
will increase. In addition, enhanced early academic performance in college is expected.
These positive outcomes are expected to result from increased access to the social capital
that fosters student success in both high school and college.
Need for the Study
An increasing number of students are entering the public education system from
impoverished backgrounds (Aud et al., 2011). The exposure of children to poverty has
been linked to a number of unfavorable academic and social outcomes that impact the
professional opportunities and long-term success of these students (O’Rand, Hamil-
Luker, & Elman, 2009). This includes lower college going rates, lower achieved salaries,
17. 6
and poor health outcomes (2009). The purpose of this study is to examine the concurrent
enrollment (CE) program as one possible approach to mitigate the negative impacts of
poverty and to improve college going rates by the removal of social and financial barriers
to college participation. This study will provide an initial, comprehensive examination of
the effect(s) of CE program participation on reducing some of the adverse effects of
exposure to poverty. The acquisition of social capital will be evidenced from improved
high school academic performance and behavior. Similarly, postsecondary outcomes are
expected to improve as evidenced by a reduction in the need for remediation, higher
college-going rates, and improved achievement scores during the first year of college.
The inferred relationship between outcomes and social capital will serve as a first step
towards demonstrating the importance of social networks on educational outcomes.
The foundation of this study is related to the theoretical social capital perspective
(Coleman, 1988/1994; Putnam, 2000, Smith, 2009). Social capital theory is based on the
assumption that our social relationships matter (Field, 2008). It has been argued,
“…increasing evidence shows that social cohesion is critical for societies to prosper
economically and for development to be sustainable” (World Bank, 1999). Robert
Putnam (2000) explains social capital in the following manner:
Whereas physical capital refers to physical objects and human capital
refers to the properties of individuals, social capital refers to connections
among individuals – social networks and the norms of reciprocity and
trustworthiness that arise from them. In that sense social capital is closely
related to what some have called “civic virtue.” The difference is that
“social capital” calls attention to the fact that civic virtue is most powerful
when embedded in a sense network of reciprocal social relations. A
18. 7
society of many virtuous but isolated individuals is not necessarily rich in
social capital. (Putnam, 2000, page 19).
A wide range of benefits have been linked to higher levels of social capital
including favorable child development, public spaces being cleaner with streets being
safer, and people tending to be healthier (Putnam, 2000; Wilkinson & Pickett, 2009).
Possibly of greatest relevance, is the recognition that the availability of social capital may
serve to negate the deleterious effects of socioeconomic disadvantage (Putnam, 2000). As
previously established, students from lower socioeconomic strata, tend to have less
access to social capital, which has been argued is central to a student’s educational
success (Walpole, 2003). In turn, this relationship implies an impact on an individual’s
socioeconomic mobility. Prior research has suggested that students from low-income
backgrounds may be less likely to enroll in college because of reduced access to social
capital (Sandefur, Meier, Campbell, 2006). These students may lack understanding of
college-going norms and expectations that are typically obtained in more affluent groups
from family members and high school staff (Nagaoka, Roderick, & Coca, 2009). Social
capital theory examines the ability of privileged groups to control merit and hold an
unfair advantage in regards to resources including access to educational opportunities
(Huang, J., van den Brink, H.M., & Groot, W., 2009; Bonilla-Burke & Johnstone, 2004).
It is proffered that the existence of an established meritocracy reduces college
participation based on exclusion of those individuals who lack access to the required
social capital. The establishment of programs that remove the merit requirement would
19. 8
have the potential to alleviate differential participation and improve outcomes for those
who lack access to the culturally established norms and skills typically linked to college
participation.
The concurrent enrollment program is one initiative that can be implemented free
from restrictive eligibility requirements that may lead to a variety of positive outcomes
for participating students. Some of the proposed benefits include: a smoother transition
between high school and college, faster degree completion, reduced college costs,
reduced dropout rates, reduced remediation rates, enhanced high school curriculum,
easing student recruitment, and even enhancing opportunities for underserved populations
(Allen, 2010). A number of these claims have yet to be supported within the research
literature; specifically, very few studies have examined programmatic impacts on
underserved, high-poverty populations utilizing rigorous analytic approaches during high
school and college. Studies conducted by Hoffman (2005) and Hughes, Rodriguez,
Edwards, and Belfield, (2012) allude to possible positive effects of CE participation for
students from a wide-range of demographic backgrounds. In addition, Turner’s (2010)
study of Latino students from impoverished backgrounds revealed that significant
changes to concurrent enrollment programs may be required to occur to effectively
address their needs and promote recruitment efforts. One additional study revealed that
CE participants from impoverished backgrounds have a greater likelihood of completing
a college degree than similar students who didn’t participate in the program (An, 2013).
Unfortunately, the ability of concurrent enrollment programs to improve a wider range of
20. 9
academic and social outcomes for students of poverty has not been systematically
examined using rigorous quantitative methods and analytics.
A rigorous study that examines both secondary and postsecondary outcomes
associated with concurrent enrollment program participation that is focused on students
of poverty and allows for causal attributions has yet to be identified in the empirical
literature. This dissertation includes a research design/analysis methodology that helps to
support such claims. Most significantly, this dissertation expands on research that
explores mechanisms that may improve academic outcomes from groups of students that
have, in the past, been largely marginalized from college participation.
Research Questions
This dissertation examined the ability of concurrent enrollment program participation
to contribute to improved academic outcomes during high school and college for
economically disadvantaged students. The research questions guiding this study
included:
1. Recruitment:
Has the CE participation of students identified, through the National School
Lunch Program, as free or reduced lunch eligible increased since the CE
legislation was first implemented? Do participation rates by free and reduced
lunch eligible students reflect rates that would be expected based on their
representation within state and district membership? Are some local education
agencies more effective in recruiting these students to participate in their CE
21. 10
programs? Are more free and reduced lunch eligible students graduating with
CE credits since the program was first implemented?
2. Impacts: During High School
What are the academic and behavioral impacts of participation in a concurrent
enrollment program for economically disadvantaged students during high
school compared to matched non-participants?
3. Impacts: First-year College
What impact does concurrent enrollment program participation have on first-
year college-going rates, remediation rates, and college achievement for the
economically disadvantaged student compared to matched non-participants?
Limitations
The purpose of this study is to better understand the impact of concurrent
enrollment programs on the amelioration of gaps in achievement, deterrent behaviors,
and matriculation into college for students of poverty through acquired social capital.
This study relies on free and reduced lunch data as a proxy for poverty and it should be
recognized that some bias may be associated with its use and application in research
studies (Harwell & LeBeau, 2010). It has been shown to be underreported at the high
school level (2010). Also, FRL status is an imprecise proxy for poverty given that it
includes both free and reduced lunch status categories that differ from each other with
both exceeding the absolute fiscal standard for poverty. In turn, the reported FRL status
22. 11
fails to serve as a precise measure of the absolute level of poverty experienced by
individuals within a community or school. Given the large degree of income variability
that is associated with the FRL designation, a high FRL percentage in one school must be
recognized to not necessarily be equivalent to other schools that serve the same reported
percentage of FRL students.
A second limitation is specific to the research design itself. A quasi-experimental
design that utilizes propensity scores serves to adjust for the lack of random assignment
by creating a matched control sample based on a number of covariates. This serves to
reduce the impact of confounding factors that may contribute to any observed differences
between groups (Guo & Fraser, 2010; Shadish, Cook, and Campbell, 2002). However,
the design fails to guarantee group equivalence due to the possibility that many
unaccounted variables may still be present. The use of random assignment is the only
proven and conceptually sound method for ensuring group equivalence that can generate
unbiased estimates of average treatment effects (Rosenbaum, 1995). However, research
has shown that quasi-experimental designs can at least partially account for preexisting
differences between groups to support causal attributions (Dehejia & Wahba, 2002;
Fortson, Verbisky-Savitz, Kopa, and Gleason, 2012).
A final identified limitation associated with this study is its inability to identify
the characteristics of the concurrent enrollment programs that contribute to any observed
favorable outcomes for students from lower socioeconomic strata. The study will not
identify the program attributes and/or the mechanisms by which social capital contributes
23. 12
to the observed outcomes. This may limit the application of this study due to its inability
to identify the specific factors, related to program implementation, that contribute to any
favorable outcomes. However, the demonstration of impact has the potential to lead to an
expanded future research agenda that will examine the key attributes associated with
successful CE programs.
Summary
Education, opportunity, and relationships can serve as ways to ameliorate poverty
and may serve to modulate the persistent underlying conditions that create and sustain
poverty (Erwin, 2008). This dissertation examines data related to the ability of
concurrent enrollment programs to improve academic achievements and behavioral
outcomes for students of poverty during their secondary and postsecondary educational
experiences. With the creation of educational opportunities for disadvantaged students
comes the possibility of breaking the cyclical effects that keep individuals, families and
communities in poverty.
Concurrent enrollment programs provide students with the ability to participate in
college courses and earn postsecondary credit. Simultaneously, the programs provide
structured social networks that support future postsecondary pursuits. These experiences
have the potential to provide traditionally marginalized students access to increased
social capital that may impact their future earning potential and quality of life. The social
capital theory helps to explain limited postsecondary participation of impoverished
students in the past. It is anticipated that participation in concurrent enrollment programs
24. 13
during high school will contribute to a range of positive outcomes. Specifically, it is
expected that dropout rates will be reduced along with expulsion rates in high school.
Also, academic achievement may increase due to increased engagement resulting from
the relevance of the coursework offered. Most importantly, the college-going rates of the
CE participants following high school graduation is expected to be higher than those of
non-participating matched peers. In addition, a reduced need for remediation is expected
to occur and improved first year college grade point average is expected.
Definition of Terms
The terms below are referred to throughout this dissertation. The operational
definitions related to these terms, when applied to the research methodology, will be
described in chapter three.
Academic Outcomes: The term refers to any achievement outcome linked to
participation in high school or college coursework that may be utilized to determine the
impact of participation in the concurrent enrollment program. The performance of
students on standardized assessments are one such outcome and will comprise much of
the focus of this study.
Behavioral Outcomes: The term refers to any social behavioral outcome linked to
participation in high school or college coursework that may be utilized to determine the
impact of participation in the concurrent enrollment program. In this study, behavioral
outcomes include high school graduation rates and dropout rates.
25. 14
Concurrent Enrollment (CE): “Refers to the simultaneous enrollment of a
qualified student in a local education provider and in one or more postsecondary courses,
including academic or career and technical education courses, at an institution of higher
education” (Colorado School Law, 2011). Concurrent enrollment programs have been
identified by numerous names such as dual enrollment programs and postsecondary
enrollment opportunities. For the purposes of this study, no distinction of significance is
made regarding these terms as both refer to the acquisition of college credit during high
school. However, the multiple terms do serve to expand the breadth of the literature
review to ensure that all relevant research studies are identified. It should also be noted
that this study fails to identify the particular means of CE delivery. Thus, CE
participation, for the purposes of this study refers to both in-school and out-of-school
participation options.
Concurrent Enrollment Credit: In this study, concurrent credit refers to college
credit hours earned through participation in programs operating within the defined
parameters of the concurrent enrollment programs act (HB09-1319). The data obtained
and reported does not include hours earned in other programs such as the postsecondary
enrollment opportunity act, Fast Track, and institutional programs like CU succeeds.
Dual Enrollment (DE): This term refers to programs that permit high school
students the opportunity to enroll simultaneously in a higher education or vocational
course (Allen, 2010). This allows the student to qualify for both high school and college
level credit at the same time.
26. 15
Free and Reduced Lunch (FRL): This refers to a student being eligible for
subsidized and/or free meals based on federal criteria that links federal poverty guidelines
to household income criteria (Harwell & LeBeau, 2010). For our study, the identification
of a free or reduced lunch status on this variable reflects a proxy for a student’s
socioeconomic status. The calculation of free and reduced lunch status is based on one of
two criteria (2010). First, students may be eligible for a reduced price lunch if the
income of their household is less than 185% of the federal poverty guidelines and for a
free lunch if their income is less than 130% of the guideline. Also, if a student receive
direct certification, based on household receipt of food stamps, has foster children in the
home, or participates in at least one federally funded program such as TANF or WIC they
would be deemed eligible (2010).
Impacted Students: This term refers to students who may be at increased risk of
failing or dropping out of high school due to exposure to poverty. It may also include
students who possess other attributes or life histories that create unique educational
challenges that are associated with less favorable educational outcomes.
Local Education Agencies (LEA): This term refers to any identified school
district within the state of Colorado that provides or has the opportunity to provide CE
opportunities to students via Colorado concurrent enrollment legislation.
Low-Income Students: A term that is applied to students that qualify for free or
reduced price lunch based on federal eligibility criteria. This dissertation also refers to
27. 16
these students as students from impoverished backgrounds, impoverished students, low-
SES students and FRL eligible students.
Postsecondary Enrollment Opportunities (PSEO): A term that may be used
synonymously with concurrent enrollment or dual enrollment opportunities. Also, it is
sometimes used to identify other college transition programs that allow one to obtain
college credit (e.g. Advanced Placement & International Baccalaureate; Allen, 2010). In
Colorado, PSEO referred to dual enrollment opportunities and legislation that preceded
Concurrent Enrollment Act legislation. This legislation required tuition payment prior to
participation with later reimbursement provided directly by the Local Education Agency
(see Colorado School Laws, 22-35-101 CRS).
Poverty: A term that has been defined in regards to income and one’s ability to
obtain a minimum level of calories (Tilak, 2002). For the purposes of this study, poverty
refers to students who meet the free and reduced lunch eligibility criteria (i.e. see
previous definition for free and reduced lunch).
Remedial Education: This term refers to coursework intended to adequately
prepare students for college level course work. In Colorado, remedial coursework is
currently identified and tracked for reading, writing, and math (CDHE, 2012). This study
examines enrollment rates in all three areas.
Social Capital: This term, as applied to postsecondary access, refers to the ability
of a student to access college information, understand the norms for college, and have
available the actual guidance and supports necessary to enter college (Coleman, 1988;
28. 17
Smith 2009). This study proposes that acquired social capital will be obtained from
participation and lead to a number of beneficial outcomes.
29. 18
Chapter Two: Literature Review
Social Capital Theory
The social capital theory is based on the central thesis that ‘social networks are a
valuable asset’ (Field, 2008). Social networks have the capacity to both directly and
indirectly bring benefits to individuals by the development of trust (Smith, 2009).
Trust between individuals thus becomes trust between strangers and trust of a
broad fabric of social institutions; ultimately, it becomes a shared set of values,
virtues, and expectations within society as a whole. Without this interaction, on
the other hand, trust decays; at a certain point this decay begins to manifest itself
in serious social problems…The concept of social capital contends that building
or rebuilding community and trust requires face-to-face encounters (Baem, 2009).
Putnam (2000) points out three ways in which social capital may be important.
Foremost, social capital supports the resolution of collective problems. People will often
be better off if they cooperate and provide support to each other when possible. Second,
social capital creates less costly repeated interactions with fellow citizens creating more
smoothly running communities. Finally, social capital increases individual awareness of
the ways that we are linked to others. When people lack connections to other individuals
they are unable to test their perspectives through conversation and are more likely to be
influenced by poor judgment (2000). In sum, the presence of social capital can be
viewed as a primary force in supporting the movement of people to larger individual and
30. 19
collective capacity. The increased access to social capital results in established
relationships that may support personal and professional success leading to an improved
quality of life.
Social Capital and Education. Empirical research is beginning to reveal a
reciprocal relationship between education and social capital (Huang, Van den Brink,
Groot, 2009; Plagens, 2010). In the past, scholars and researchers have primarily focused
on how social capital may be enhanced within the family and community (Bordieu, 1986;
Coleman 1987; Coleman 1988). A limited body of research examined how schools may
cultivate increased social capital and lead to improved student outcomes. More recently,
social capital has been explored in relation educational achievement outcomes; positive
relationships have been revealed (Coleman and Hoffer, 1987; Putnam, 2000; John, 2005;
Plagens and Stephens, 2009).
One meta-analysis involving 286 evaluations on social participation revealed that
education levels serve as a strong correlate of individual social capital (Huang et al.,
2009). This finding may indicate that educational persistence may eventually be shown
to be a causal mechanism that leads to increased social capital and produces favorable life
outcomes. Another recent study explored the question of why some schools, with similar
resources have disparate rates of performance (Plagens, 2010). It was concluded by the
use of teacher and principal perception data that social capital levels within schools are
related to student achievement. The mechanism mediating this relationship wasn’t
identified within the study (2010). However, clearly defined expectations and guidance
31. 20
for students lacking familiarity with college may serve as a catalyst for student
achievement (Karp & Bork, 2012). Lastly, one study identified a positive impact of
social capital, as identified by parental investment, as contributing to improved
educational achievement outcomes thus serving to minimize at least one negative impact
of poverty (Hango, 2007).
It may be surmised, based on the aforementioned studies that when social capital
is tied to improved social networks that support the college going and participation
process the likelihood of college completion may be increased. Similarly, if programs
exist within schools that provide for the acquisition of social capital in regards to college-
going a number of positive and temporally proximate outcomes may also result. The
acquired skill-sets may lead to improvement in achievement and behavior that
corresponds with college level expectations. The described connection between social
capital and improved college-going rates has the ability to contribute to improved quality
of life, better health, and improved earnings for individuals from impoverished
backgrounds.
Quality of Life and College Completion
A number of studies have established the beneficial consequences associated with
college participation. Two key outcomes include improved physical health and greater
expected career earnings. In effect, some of the most deleterious consequences associated
with poverty have the potential to be mitigated by college participation. The relationship
between college attendance, health outcomes, and earning power are described below.
32. 21
Impact on Health. In their paper, "Education and Health: Evaluating Theories
and Evidence," David M. Cutler and Adriana Lleras-Muney (2006) findings reflect that:
better educated people have lower morbidity rates from the most common acute and
chronic diseases, independent of basic demographic and labor market factors; life
expectancy is increasing for everyone in the United States, yet differences in life
expectancy have grown over time between those with and without a college education;
health behaviors alone cannot account for health status differences between those who are
less educated and those who have more years of education; the mechanisms by which
education influences health are complex and are likely to include (but are not limited to)
interrelationships between demographic and family background indicators, effects of
poor health in childhood, greater resources associated with higher levels of education, a
learned appreciation for the importance of good health behaviors, and one’s social
networks.
The completion of a college degree has been shown to be related to a reduced risk
of mortality along with other positive health outcomes (Ferguson, Bovaird, and Mueller,
2007). For students in poverty, they tend to experience higher rates of “asthma, ear
infections, stomach problems, and speech problems” (Duffield, 2001, p. 326). Also, their
eating is more sporadic, including missed meals, and not eating healthy well-balanced
meals (Milner IV, 2013). In sum, a robust relationship between educational experiences
and beneficial health consequences has been established in the research literature (2013).
33. 22
The relation that exists between a positive health status and advanced education
attainment is clear.
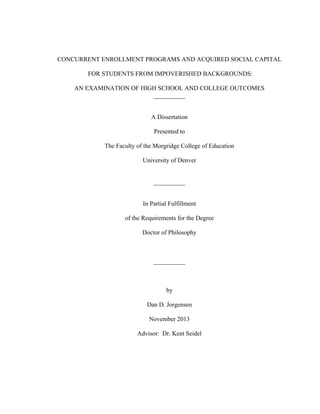
Impact on Earnings. The U.S. Census Bureau continues to provide data that
demonstrates a strong relationship between college experience and an individual’s annual
career salary (U.S. Census Bureau, 2012; see figure one).
Note. The salary projections were obtained from the U.S. Census Bureau, 2012.
It has been estimated that a typical high school dropout can be expected to earn
approximately $746,191 dollars during their career compared to well over $2 million
dollars for those individuals who complete a Bachelor’s degree (2012). The Census
Bureau has also produced data that indicates even limited college experience can have a
sizable and positive impact on lifetime earnings. For example, an individual with just a
few college credits is likely to earn nearly five hundred thousand dollars more than a high
$746,191
$1,129,074 $1,190,565
$1,466,270
$2,088,973
$0
$500,000
$1,000,000
$1,500,000
$2,000,000
$2,500,000
HS Dropout HS Graduate Some College Associates Degree Bachelors Degree
Post-Secondary Experience
CareerSalary
Figure 1. Career Salary Projections based on Level of Education
34. 23
school dropout during the course of their careers. For a high school graduate, compared
to those with some college credits, differences continue to exist with approximately
$71,000 dollars more earned for the latter group (2012). Furthermore, for ethnic
minorities the difference in average career earnings may be more pronounced due to the
relationship between race and the percentage of families that reside below the poverty
line. Across all minority groups, approximately 56.2% of families reside below the
poverty line while for whites only 9.4% of families fit into this category (Milner IV,
2013). As pointed out by Munin (2012),
“Families of color are more likely to live in poverty and thereby have less access
to societal benefits granted to the economically privileged. However, it is
important to point out that this [race and poverty] is not a perfect correlation.
Not all people of color are poor, nor are all white people rich. It is very difficult
to live in poverty regardless of one’s race.” (p.7).
In effect, for all individuals from impoverished backgrounds, the probability of obtaining
a college degree is low, while the obtained benefits for doing so are large. The
relationship between education and earnings has been described within a framework that
hypothesizes the mechanisms of action that impact earnings (see figure two; Tilak, 2002).
The model proposes that while education directly contributes to skills and knowledge,
thus ultimately impacting earnings, the level of earnings also contribute to the
educational opportunities available to the individual. This feedback loop is bound by
social, cultural, and occupational systems. Each system has the capacity to directly inhibit
or promote the functions of any part of the model that comprise the totality of the
feedback loop.
35. 24
Figure 2. Proposed Relationship between Education and Earnings
Tilak (2002) has also proffered another relationship between education and
income poverty (see figure three). He suggests educational deficiencies will directly
contribute to income poverty which will reciprocally lead to a further impact on
education poverty (2002). It may be inferred by this model that any improvement in the
quality of educational opportunities or reduction in poverty will lead to a situation in
which the negative effects of poverty are mitigated.
Figure 3. Proposed Relationship between Education and Income Poverty
Education
Skills &
Knowledge
Employment Productivity Earnings
Social, Cultural, Occupational, and Other Factors
Education
Poverty
Improvement in
Education
Income
Poverty
Reduction in
Poverty
36. 25
The model suggests that numerous negative outcomes resulting from poverty may be
directly impacted by addressing deficiencies in the educational experience of children
from impoverished backgrounds. It may be speculated that improved social
relationships, in regards to the college-going experience, may facilitate improved
outcomes during the high school years. If educational programs provide access to college
credits while improving the social networks related to postsecondary education the
probability of escaping the cycle of poverty may be increased.
Equity and Access to College
The ubiquitous presence of the benefits related to college attendance leads one to
consider the factors that have historically reduced the pursuit of such opportunities. The
largest contributing factors may include poverty, race/ethnicity, and the dominant cultural
norms that have served to marginalize students. Each factor has contributed both
independently and in combination with the other factors to reduce college-going rates for
a large number of students (Payne, 1986; Aud, Fox, & KewalRamani, 2010; Perna, 2000;
Delpit, 2006; Stephens, Townsend, Markus, & Phillips, 2012).
Poverty. It has long been recognized that poverty plays a significant role in a
wide range of academic, social, and community outcomes (Payne, 1986; National Center
for Children in Poverty, 2012). This is especially significant given that 22% of all
children under the age of 18 are identified as living in poverty (U.S Bureau of the Census,
2010). The increased number of educational opportunities being provided by some
school systems has likely failed to adequately account for the unique needs of students
37. 26
brought about by differential access to economic resources and social capital. It could be
argued that the current and persistent achievement gaps for students of poverty provides
confirmatory evidence of this situation. One example, based on research that examined
the relationship between family resource’s and children’s academic performance has
shown that lower income is related an increased likelihood of repeating a grade (Kim,
2004). The lack of equity of access to high impact educational programs along with
reduced social capital has been scarcely examined. However, it can be posited that
without these social supports being available many students of poverty will continue to
be excluded from these postsecondary opportunities. As sociologist Annette Lareau
stated in her book, Home Advantage, “The standards of the school are not neutral; their
requests for parental involvement may be laden with the social and cultural experiences
of intellectual and economic elites.”(2000, p.8) One may conclude that the school system
itself may inhibit the acquisition of social capital by marginalizing some students and
families from these opportunities. The failure to address these needs serves to reinforce
the cycle of poverty and maintain social stratification.
Race and Ethnicity. The race of a student has been shown to be related to college
going rates (Aud, Fox, & KewalRamani, 2010). The disproportionate participation rates
in college may be based on oppressive historical practices tied to institutional racism and
the failure to account for cultural differences and needs within the college application and
admission process. More recently, research is beginning to show increased rates of
college participation by ethnic minorities (2010). However, substantial participation gaps
38. 27
continue to exist between races (2010). Specifically, the college-going rate of white
students ages 18 to 24 was approximately 44% in 2008. In contrast, the rate for
Hispanics was 26% and for African-Americans the rate was 32% (2010).
Dominant Cultural Norms and Values. Possibly of greatest significance is how
have the norms and values of the dominant Anglo-European culture within the United
States served to maintain an inherently unfair system of participation for certain groups
of students including the aforementioned groups. The dominant cultural values have
supported a system that reduced the postsecondary opportunities for those from both
impoverished backgrounds and ethnic minority groups. In addition, the prevailing
culture has created barriers within the K-12 educational system that have inhibited many
forms of postsecondary participation (Delpit, 2006). Similarly, for those first-generations
student who choose to participate in college they tend to report more negative emotions
and experience higher stress then their peers (Stephens, Townsend, Markus, and Phillips,
2012). These outcomes are largely thought to result from differences in culture. This
indicates that if a lack of cultural support occurs then the likelihood of college completion
may be reduced (2012).
Concurrent Enrollment Programs
The availability of postsecondary opportunities during high school may be
essential for providing access to high-paying jobs and may serve to prevent the
recurrence of generational poverty by providing social capital to those student
traditionally marginalized by the educational system (Bedolla, 2010; Burke & Johnstone,
39. 28
2004). Concurrent enrollment (CE), dual enrollment (DE), and postsecondary educational
outcomes programs (PSEO) are one type of program that exists to ease the transition to
postsecondary institutions. The focus of these programs has been to increase the college-
going rates and postsecondary preparedness of participating high school students. The
concurrent enrollment program is best characterized as collaborative efforts between high
schools and colleges which allow high school students to enroll in college courses
(Plucker, Chien, & Zaman, 2006). These programs allow for students to earn college
credits prior to high school graduation (2006). Concurrent enrollment programs have
been implemented in all fifty states for more than thirty years (Plucker et. al, 2006;
Bailey, Hughes, & Karp, 2002). Eighteen states have mandated programs that allow
students to receive college credit and 71% of high schools in the United States offer dual
credit courses (Plucker et al, 2006).
A large body of research exists regarding the effectiveness of concurrent
enrollment programs. However, until recently, very few studies were conducted that
utilized rigorous statistical methods to control for selection bias that potentially impact
outcomes associated with program participation (Bailey et. al., 2002). A 2007 study
conducted by the National Research Center for Career and Technical Education, revealed
moderate support for the causal impact of concurrent enrollment programs on both
achievement and postsecondary outcomes for students in both Florida and New York
City (Karp, Calcagno, Hughes, & Bailey, 2007). Program participants had numerous
favorable statistically-significant outcomes that exceeded those found in demographically
40. 29
matched non-participants (2007). In Florida, dual enrollment was positively related to
students’ likelihood of earning a high school diploma. Other findings revealed a positive
relationship between enrollment in college and program participation (2007). Concurrent
enrollment students were more likely to persist in college while also having higher grade
point averages one year and three years following high school graduation (2007). Also,
concurrent enrollment students had earned more postsecondary credits three years after
high school graduation then non-participating peers (2007). For the New York City
study, findings were similar albeit not identical to the Florida study (2007). The program
participants were also more likely than peers to pursue an undergraduate degree (2007).
Other research has documented that students participating in dual enrollment programs,
had a larger number of college credits earned, a reduced need for remedial coursework,
and an increased likelihood of attaining a degree (An, 2009). A further study, utilizing a
national database of student records showed that students who gained college credits
through dual enrollment were more likely to enter college immediately after high school
and persist to the second year of college (Swanson, 2008). A recent number of
unpublished studies, primarily dissertations, provide additional support for dual-
enrollment effectiveness (Carter, 2009; Duffy, 2009; Hartman, 2007; Pyong, 2009). At a
minimum, these studies indicate that dual enrollment programs are being increasingly
viewed as a viable method to support the successful transition of high schools students to
postsecondary institutions. The existing research studies have applied a wide-range of
analytic techniques and have thoroughly documented numerous, favorable program
41. 30
outcomes (Hartman, 2007; Fowler, 2007; Sell, 2008; Saltorelli, 2008). The findings of
these studies include: dual enrollment students performed better than average
academically in their freshman year of college (Hartman, 2007); the odds of student
graduation and postsecondary enrollment improved by almost three times for dually-
enrolled students (Fowler, 2007); and dual enrolled students were slightly more likely to
enroll full time rather than part time in a community college (Sell, 2008).
Research that has examined the beneficial impacts of CE program participation on
students of poverty has been limited. It is speculated that this paucity of research may
result from the limited number of economically disadvantaged students that have
historically participated in such programs due to restricted program accessibility and/or
recruitment efforts. To present, only one study has been identified that attempted to
empirically demonstrate the impact of CE participation on college graduation rates of
low-SES students (An, 2013). This study identified higher rates of college degree
attainment for low-income students compared to a demographically similar group of
students (2013). The study lacked analysis of other proximate consequences of CE
participation, including outcomes such as college going rates, remediation rates, high
school referral rates, and standardized test scores. It should be recognized that studies
have also just begun to explore the ability of concurrent enrollment programs to address
the needs of minority groups such as Latino populations (Turner, 2010). In effect, the
ability of CE programs to positively impact student subgroups has scarcely been
examined to present using rigorous methodologies.
42. 31
Colorado Concurrent Enrollment. The state of Colorado, while dealing with
increasing poverty levels is also serving to import individuals with college degrees from
other states. Specifically, although Colorado ranks high among states with the number of
adults having college degrees, it ranks near the bottom among states with high school
students who participate in college and receive college degrees (Caley, 2011). In order to
reverse this trend policymakers have focused on increasing postsecondary opportunities
for Colorado students to enhance college-going rates. It was expected that by increasing
the education levels of Colorado high school students it would drive new economic
opportunities while reducing the need for highly skilled workers from other states. This
approach assumes that additional postsecondary opportunities will alleviate poverty by
increasing the skill set(s) of the Colorado worker. One piece of legislation, crafted to
help reach this goal, was related to increasing the accessibility of concurrent enrollment
opportunities that target underserved student populations. The concurrent enrollment
program was proffered as at least a partial solution to some of the educational challenges
facing the state of Colorado. The program has the potential to increase participation of
underserved students in a postsecondary opportunity that was previously, largely
inaccessible.
Concurrent Enrollment Program Act. The “Concurrent Enrollment Program
Act” or CRS 22-35-101 of Colorado school law was enacted by the legislature of the
state of Colorado to improve state coordination of such programs, to focus on quality and
43. 32
consistency, and to define accountability standards (Colorado State Law, 2011).
Specifically, the legislation points out:
“(d) historically, the beneficiaries of concurrent enrollment programs have often
been high-achieving students. The expanded mission of concurrent enrollment
programs is to serve a wider range of students, particularly those who represent
communities with historically low college participation rates” (2011, p. 425).
In addition, the legislation says, “Creating pathways between high schools and
institutions of higher education is essential to fulfilling the Colorado promise of
doubling the number of postsecondary degrees earned by Coloradans and
reducing by half the number of students who drop out of high school in the state”
(2011, p. 425).
The legislation outlines a number of key implementation requirements for districts
(Colorado Department of Education, 2010). First, all high schools were required to
operate all concurrent enrollment programs under the Concurrent enrollment program act
by 2012 with the beginning of implementation occurring during the 2009-2010 school
year. The districts must enter into a cooperative agreement with institutes of higher
education to offer concurrent enrollment opportunities. All of the school districts must
reimburse concurrent courses at the in-state community college tuition rate with all
enrolled students being identified as Colorado resident for the establishment of tuition
setting. A wide range of courses qualify as CE eligible. Lastly, students in grades 9 to
12 are eligible to participate if they have received approval for their academic plan of
study, applied for CE participation within a certain timeframe and meet the prerequisites
for the course while not being required to meet all higher education admission
requirements (2010).
44. 33
State involvement includes the funding of students at the full per-pupil operation
revenue rate for concurrent enrollment participation given that the student meets
attendance and instructional time requirements. The program oversight, including the
establishment of cooperative agreements with institutes of higher education is tasked to
the local education agency. This system reduces the burden on the student with the sole
focus being on class participation (2011). The ability to reduce the impact of poverty and
to provide social capital for future success may be facilitated by providing access to
programs that would not otherwise be available to impoverished students.
The state of Colorado’s concurrent enrollment legislation emphasizes this
possibility by claiming that the programs have the potential to reduce the dropout rate of
Colorado secondary students and increase the college-going rates of underserved student
populations with historically low participation rates (Colorado School Law, 2011).
During the 2010-2011 school year approximately 15,000 students participated in some
type of dual enrollment program within Colorado (CDHE, 2010). The number of these
students that are eligible for free-or-reduced lunch, a proxy variable for poverty, was not
reported (2010).
Impact of Legislation on Student Outcomes. The Colorado Concurrent
Enrollment Program Act has yet to be closely examined in regards to its impact on
underrepresented groups of students. The adopted legislation provides direction to school
districts that has likely facilitated the college application process, addressed tuition needs,
and placed the student directly in the college classroom. In effect, resources are likely
45. 34
directed in a manner that provides social capital to participating students. It is expected
that the acquired social capital may provide both short-term and long term benefits for
participating students.
A more developed understanding of the impact of the CE legislation on secondary
and postsecondary outcomes for students of poverty will support a more comprehensive
research agenda into the future. The research will examine the specific mechanisms that
constitute acquired social capital and serve to improve college going rates. This research
agenda will include the identification of programmatic components that best support the
needs of traditionally underrepresented students. Similarly, it will identify the variables
that facilitate program recruitment of underserved populations.
Key Components of Effective CE Programs
A number of factors within American public schools have reduced the availability
of social capital for some student groups which has in turn reduced college accessibility.
The availability of concurrent enrollment programs, as established by the Colorado
Concurrent Enrollment Program Act, may serve to increase college-going rates for these
students. However, the ability of the CE programs to increase college-going rates will
largely be contingent on the effectiveness of the implementation methods utilized by
local education agencies.
The most effective CE program will likely include a number of key components.
Foremost, the ability to participate in the program must be conveyed to all students to
support equity of access. If traditional informational delivery routes are utilized to
46. 35
inform students about CE program availability then it’s possible the program will
continue to serve the same student populations as in the past. The dissemination of
information concerning the program must be made accessible to all students and not just
those who come from more affluent households that oftentimes already possess greater
access to social capital.
The enrollment process must be clear and supported by school staff to reduce the
likelihood that marginalized students would choose not to participate based on their
perception of the difficulty of the admission process and/or the appropriateness of the
program to meet their educational needs. The most effective programs will also account
for the payment of any fees, textbooks, and tuition. The Colorado CE programs address
the payment of tuition by the district directly. However, additional costs may discourage
the recruitment of students lacking the resources to cover these expenses.
Students that are admitted to the program must have access to social capital that’s
deliberately embedded within the CE experience. Once enrolled, the students need to be
provided with relevant college curriculum within a classroom of college-going peers. It
may be that class work that occurs directly within the postsecondary institution will
provide the greatest value for establishing of college level social networks. However, the
availability and quality of school counselors and faculty members may also serve as
another source of social capital, in all educational environments, for impacted students
(e.g. African-American students; Farmer-Hinton & Adams, 2006). Finally, the program
must maintain high academic and behavioral expectations for students to foster beneficial
47. 36
outcomes (Brophy, 1983; Weinstein, 1995). The benefits of participation, including the
newly acquired social networks, will be reinforced by the observation of one’s own
ability to perform at a higher level in line with these more rigorous expectations.
This study is not examining the systems that have been put into place by local
education agencies. All causal attributions are based on CE participation alone and not
specific program characteristics. However, if a connection is made between program
participation and outcomes then the aforementioned systems may serve as the foci for
future studies trying to identify program attributes that contribute to any favorable
outcomes. Conversely, if no program impact is identified it must be considered that
differences in program implementation may require a more intense examination to ensure
that it is not a mitigating factor that led to weak or non-existent outcomes within this
study and/or within any similar studies.
Summary
Concurrent enrollment programs, and the accessibility of social, emotional and
financial platforms they present, serve as a potentially significant solution to improve
secondary and postsecondary achievement outcomes for traditionally underrepresented
populations. To present, limited research exists that has examined the impact of dual
enrollment participation on students from low-income families. This paucity of research
has founded this study’s focus on students from impoverished backgrounds and their
educational advancements. Social capital theory is applied as the underlying conceptual
framework to shape our understanding of how the CE program may positively impact
48. 37
students from impoverished backgrounds. This study explores the concurrent enrollment
program as one mechanism to support poverty alleviation by increasing college-going
rates for underserved students. It is believed that CE programs are best understood by the
economic and social resources they provide to students (i.e. social capital). The
recognition of this implicit connection leads to an exploration of the impact of CE
participation on students from impacted backgrounds. The obtained findings will be
discussed in relation to the issue of low college participation rates by traditionally
underrepresented student populations. The discussion will also consider the impact of CE
legislation and program implementation on desired outcomes.
49. 38
Chapter Three: Methodology
Background
This dissertation examined a range of high school and postsecondary outcomes
for CE participants from impoverished backgrounds. It was expected that CE
participation would positively impact high school performance as evidenced through
improved assessment scores, improved graduation rates, and reduced dropout and
expulsion rates. Also, students that participate in the program were expected to
matriculate at a higher rate to college, have a reduced need for remediation, and have a
better college grade point average during their first year of enrollment. In addition, this
study examined the participation rates of FRL students and how it changed between
years. This analysis also included comparisons based on CE credits enrolled and earned
(i.e. including remedial credits).
The primary research methodology applied, to examine impact of participation on
measured outcomes, was a quasi-experimental design that applied propensity score
matching techniques (Shadish, Cook, & Campbell, 2002). Moreover, single-year
snapshots of participation were examined to describe the participation rates of students
identified as free and reduced lunch eligible (i.e. research question one). The focus years
included 2010-2011 and 2011-2012 which reflect the second and third years of district
50. 39
implementation of CE programs (i.e. the Concurrent Enrollment Program Act was
adopted in 2009). The 2009 data was obtained from the Colorado Department of Higher
Education but was omitted from this study as the file failed to identify the number of
credits that CE students were enrolled for during that year. Given that this file reflected
the initial year for reporting of CE participation it is believed that the accuracy of the
reported data may be reduced. Similarly, the lack of credit data further prevented a
reliable determination of program participation.
The complete list of addressed research questions included:
1. Has CE participation of students identified as FRL eligible increased each
year since the concurrent enrollment legislation was first implemented? Do
participation rates by FRL students reflect rates that would be expected based
on their representation within state membership? Do some local education
agencies appear to be more effective with the recruitment of these students
into their CE program? Has the percentage of graduating students (i.e. free or
reduced lunch eligible) earning concurrent enrollment credit increased since
the concurrent enrollment legislation was first implemented?
2. What is the impact of participation in a concurrent enrollment program for
economically disadvantaged students during high school compared to matched
non-participants?
51. 40
3. What impact does concurrent enrollment program participation have on
college going rates and first-year grade point average for the economically
disadvantaged students compared to the matched non-participants?
Study Design
The identified research questions were addressed by cross-sectional and
longitudinal analyses. A snapshot of the research design including key variables is
presented in figure four.
The first research question was addressed by examining cross-sectional data for
each year from 2010-2011 to 2011-2012. The remaining questions are addressed by
examining three groups of FRL concurrent enrollment students from 2010-2011 and
2011-2012. This includes two groups of one-year participants and one group with two
year CE participants. In addition, matched cohorts of non-participants that are
academically and demographically similar to the CE participants were constructed for
comparisons of high school and postsecondary outcomes.
The quasi-experimental research design was selected for utilization in this
dissertation due to its ability to support causal attributions related to the proposed
research questions (Shadish, Cook, and Campbell, 2002). The study includes data
representing all of the CE participants from the first two years of full legislative and
district implementation. This study is based on extant data as a randomized control trial
was not conducted. A quasi-experimental design is the single best method to support
causal attributions with the available data due to the lack of random assignment.
52. 41
Note. *: These variables were initially considered for matching but were ultimately
removed from analysis due to missing data that would result in a substantial number
of lost cases.
Figure 4. Quasi-Experimental Design with Matched Control Group
Pre-Program
Matching
Variables
Demographic
Ethnicity
Giftedness
Special Education
Free Lunch Status
Gender
Language
Proficiency
CSAP
Performance*
Reading Scale
Score
Writing Scale
Score
Math Scale Scores
ACT Composite
Score*
Grade in School
2010-2011
&
2011-2012
CE Participation
Credits Enrolled
Credits Earned
Behavior
Graduation
Dropout
Expulsions
ACT Performance
Composite Score
CELA
Performance
Composite Score
Proficiency Level
CSAP Performance
Reading, Writing,
Math and Science
(Scale Scores,
Proficiency, and
Growth
Percentiles)
Postsecondary
Outcomes
1st
Year of college
(as applicable)
Enrollment Rates
Fall Term GPA
Remediation
Required:
Math
Reading
English
53. 42
The randomized experimental control trial has shown itself to be the “gold
standard” for attributions of causal inference (Greeno, 2002; Fortson, Verbitsky-Savitz,
Kopa, and Gleason, 2012). The ability to randomly assign subject to conditions generates
group equivalence and reduces error that serves to localize the impact of the independent
variable providing for causal attributions (Rosenbaum, 1995). However, the use of the
experimental design was not possible for this study due to the inability of the researcher
to randomly assign individual students to participate in the CE program. A quasi-
experimental design provides a conceptually sound alternative that supports causal
attributions. The most common research designs fitting into this approach include studies
utilizing nonequivalent control groups, regression discontinuity, or time-series designs
(Shadish, Cook, & Campbell, 2002; Trochim, 2005). The available data makes the
generation of a matched nonequivalent control group the strongest design to address the
identified research questions. Most importantly, the matched control group as determined
by propensity score matching techniques provides a point of comparison to determine
treatment impacts. The other quasi-experimental methods were not amenable to the
extant data available to investigate the questions of interest since a clear point of program
implementation fails to exist within the data sample (2002).
The design has one significant methodological limitation that must be recognized
to support proper data interpretation and analysis. The longitudinal phase of the study,
including the generation of propensity scores serves to equate groups on a range of
covariates. This method, while empirically sound, fails to provide definitive causal
54. 43
attributions. This occurs due to the inability of matching procedures to account for all
group differences that may contribute to the observed outcomes. For example, the
available data-set doesn’t allow for the matching of students based on school curriculum,
teacher quality, or supplemental programmatic opportunities. Sensitivity analysis was
applied to determine the possible impact of unaccounted variables.
CE Participation and Representation Rates
In order to address the initial research question a cross-sectional examination of
CE participation within the state of Colorado for the 2010-2011 and 2011-2012 school
years occurred. A comparison of the percentages of the free and reduced lunch students
participating in the program to the overall 9th
to 12th
grade free and reduced lunch
percentages of the local education agencies in which they are enrolled occurred. Also,
overall comparisons were made to the 9th
to12th
grade free and reduced lunch rate for
Colorado. These comparisons allowed for a determination of representation rates of FRL
students within CE programs at the district and state levels. The obtained rates were
examined between the two years to identify any changes in the percentage of
impoverished students that are participating in the CE program. The same comparison
also occurred for high school graduates. It was also determined if graduates from
impoverished backgrounds are becoming more likely to have received CE credit.
Similarly, the number of CE credits earned and enrolled in was determined for CE
participants by FRL status.
55. 44
CE Program Impacts in High School and College
The remaining research questions are all tied to the quasi-experimental
examination of outcomes that involved comparisons between CE participants and
demographically matched non-participants. The students that enrolled for a minimum of
one CE credit during the 2010-2011 or 2011-2012 school year constitute the treatment
group. The comparison groups were generated by the matching of non-participants on a
host of demographic and achievement measures. Statistical analyses involved
comparisons of between-group performance during high school and the first semester of
college (i.e. where applicable).
Data Sources & Operational Definitions
The data, utilized in this study, was obtained from the Colorado Department of
Education (CDE) and the Colorado Department of Higher Education (CDHE). All CDE
file specifications are located at, www.cde.state.co.us. The Colorado Department of
Education files included:
1. October count and end-of-year submission data that included district/school
of attendance, student graduation status, exit codes (i.e. dropouts and
expelled), and demographic data for program participants (i.e. grade,
ethnicity, free-lunch status, age, special education status, language
proficiency, and giftedness designation).
2. Colorado Student Assessment Program (aka CSAP) files for math, reading,
writing and science including proficiency levels, overall scale scores, student
56. 45
growth percentiles (i.e. for math/reading; reflecting a normative measure) and
adequate growth percentiles that identify the level of growth necessary to
move students to proficiency and/or for them to maintain proficiency within
three years or by 10th
grade (see Bonk, 2012).
3. Colorado English Language Assessment (aka CELA) files that include overall
scale scores and proficiency levels for all participating students along with the
grade of the test (data available for spring 2010 & 2011 only).
4. American College Testing (aka ACT) data file for 11th
grade students with
composite and performance scores.
The files provided by the Colorado Department of Higher Education were obtained from
CDE via a data-sharing agreement and included:
1. Concurrent enrollment participation files for the 2009-2010, 2010-2011, and
2011-2012 academic years that included the following data: all students that
participated in a concurrent enrollment course, the total number of concurrent
enrollment credits attempted, and the total number of concurrent enrollment
credits earned by the student. Also, the number of credits taken that addressed
remedial needs in reading, writing, and math was provided. The CE
participant lists only included students that had confirmed attendance from
higher education institutions and were identified as enrolled for at least one
credit hour in the provided data files (i.e. except for 2009-2010 in which credit
information was not provided so the file was omitted). Additional details
57. 46
regarding CE enrollment such as on-site or off-site coursework, type of
classes, etc. weren’t identified within the provided data files.
2. A comprehensive data file reflecting all Colorado high school graduates
including GED recipients along with college enrollment information for the
graduating classes of 2011 and 2012. The enrollment information included
both in-state and out-of-state enrollment.
3. The number of credits earned and the college grade point average during the
first year of postsecondary enrollment for the graduating classes of 2010,
2011, and 2012.
A comprehensive description of the data provided by institutes of higher education that
are maintained by the Colorado Department of Higher Education is available at:
www.highered.colorado.gov/Data/html.
Population and Cohort Description
The study includes data from all CE participants since the first year the program
offered. The data files reflect academic years 2008-2009 to 2011-2012. The 2008 file
ensured that data from all students, prior to program participation, were available for
appropriate statistical matching. In order to determine programmatic impacts artificial
control groups were created for comparisons. It was expected that the total CE enrollment
would not exceed 12,000 students based on historical reports (Bean et al., 2012). Given
that student identifiers provided by the DHE were required to be validated by Institutions
of Higher education, CE enrollment was lower than that previously reported as many of
58. 47
our cases failed to identify any credits enrolled for within our CE participant lists. Also,
the focus of this study was on FRL students thus substantially reducing the sample sizes
for the student groups used to address research questions two and three.
It has been reported that entry into high school corresponds with a reduced
willingness by some students to apply for and/or receive free or reduced price lunches.
This is evidenced by a reduction in free and reduced lunch applications following the
middle school years (Data First, 2012). In addition, it has also been suggested that, “the
use of FRL as a measure of SES can expect a significant percentage of students, perhaps
as high as 20% to be misclassified” (Harwell & LeBeau, 2010). This misclassification
likely results in underreported poverty levels. For this dissertation, matching will only
occur for those self-identified FRL students between the treatment and matched control
group. Thus, biased reporting of eligibility should not impact any outcome findings
related to our final three questions. For the initial question regarding participation it is
possible that the accuracy of the reported number of FRL students may be reduced if such
reporting bias exists within the analyzed student populations.
Analysis
Data Analysis Software Tools. The IBM Statistical Package for the Social
Sciences (SPSS), version 20 was utilized for all statistical procedures that constitute this
study (IBM Corporation, 2011) along with a SPSS R plug-in. The R version 2.12.0
software program was applied for matching procedures by use of a custom SPSS dialog
box for propensity score matching (see Thoemmes, 2012). The building of the master
59. 48
data file occurred by the use of a Microsoft Access relational database, 2010 version. The
database served to consolidate the disparate files provided by the Colorado Department of
Education and Colorado Department of Higher Education into three student level tables
that were imported into SPSS for use with all statistical analysis procedures.
Missing Data Analysis Procedures. The constructed data set was examined for
missing data for all variables prior to analysis. Based on the extent of missing data,
appropriate analytics were to be selected and applied to address any gaps in reported data
that could impact analysis (Enders, 2010). The possibilities for addressing these issues
ranged from no adjustment to the use of multiple imputation methods (2010). In sum, the
demographic data were complete for all cases due to the Colorado reporting requirements
for local education agencies regarding the state submissions in which this data was
obtained (i.e. missing data was not permitted). However, prior year achievement scores
for CSAP and ACT were more likely to be missing primarily due to the grade levels of
the CE participants. Approximately 80% of each sample consisted of 11th
or 12th
grade
students. This means that the 11th
grade students would have CSAP scores only while the
12th
grade students had ACT scores only from the prior year. Thus, the inclusion of these
fields would omit most of the sample since they would be missing one or both of these
assessment data points. In order to facilitate the most effective matching, while
preserving cases, the assessment data was omitted from the logistic regression equations.
In effect, the logistic regression models that were utilized contained no additional
adjustments for missing data.
60. 49
Propensity Score Matching (PSM). The inability to randomly assign
individuals to participate in the concurrent enrollment program led to the utilization of
the propensity score matching technique to provide for the determination of program
effectiveness. The propensity score is best described as the “conditional probability of
assignment to a particular treatment given a vector of observed covariates” (Rosenbaum
& Rubin, 1983). A control group is constructed based on similarity of obtained group
conditional assignment probabilities with that of the program participants (Rudner &
Peyton, 2006). This “constructed” control groups then allows for comparisons between
matched groups that have been created to minimize group differences that exist
independent of program participation. The adopted methodology parallels the three-step
procedure outlined by Guo and Fraser (2010). The steps include: (1) Logistic Regression
analysis between-groups. This includes a dependent variable reflecting the log odds of
receiving treatment (i.e. CE participation), searching for an appropriate set of matching
variables, and obtaining estimated propensity scores with predicted probability (p) or
log[(1-p)/p)], (2) matching with appropriate caliper method that may include case
replacement, and (3) post matching analysis of treatment cases to matched sample cases
(2010). The propensity score analysis technique is recognized by the “What Works
Clearinghouse” as an appropriate method to support claims of internal validity in regards
to a quasi-experimental research design and is recognized as meeting evidence standards
with reservation (What Works Clearinghouse, 2008).
61. 50
Logistic Regression Procedure. A logistic regression procedure was utilized in
this study to identify the variables in which the program participant and control groups
can be reliably discriminated. The logistic models were used to discriminate program
participants from non-participants based on the obtained criterion measure (i.e. treatment
or non-treatment condition). This allows for the development of a matched sample of
cases based on the obtained value of the criterion variables (i.e. representing the log odds
of being a member of the treatment group). In turn, the matching procedure served to
generate a control group that best matched the CE participant group based on the range of
covariates that is summarized by the obtained criterion value. The final predictor
variables included within the logistic regression equations, for each CE cohort, are
identified in table one.
The variables included both achievement and demographic measures. The
variables were entered into the logistic regression equation utilizing a direct-entry
procedure. The dependent variable reflects the obtained log odds of participating in the
CE program and was saved for each CE student. This generated propensity score was
then utilized for the matching process described below. The procedure was repeated for
the 2010-2011 CE participants, 2011-2012 CE participants, and the two-year CE
participants that were identified as free or reduced lunch eligible (i.e. ineligible students
are excluded from these analyses). The free and reduced lunch variable was entered into
the logistic equation due to its integral role in addressing the key research questions and
to account for absolute differences in free or reduced lunch participation status between
62. 51
years. In sum, all of the included variables were selected for inclusion based on
availability and relevance for group discrimination.
Table 1.
Data Elements for Propensity Score Matching Procedure
Identified
Predictors/Covariates
Category Description/Values
FRL Demographic Free: 1; Reduced: 0
Gender (male) Demographic Male: 1; Female: 0
Race (Hispanic)
Demographic Not Hispanic:0, Hispanic:1
Race (White)
Demographic Not White:0, White:1
Giftedness Demographic 0: Not, 1: Gifted
Special Education Demographic
0: Not Special Education,
1: Special Education
Language Proficiency Academic/Demographic
NEP: 1; LEP: 2;
FEP: 3; 4: Not ELL
Grade in School Academic Achievement 9th
-12th
Note. All data utilized for matching was obtained from files that included data from the year prior
to CE program participation. This allowed for matching of attributes that were present prior to
program participation.
Case Matching Procedure
The propensity scores obtained from the logistic regression analysis for the CE
participants was matched with the control group estimated scores by use of a statistically
appropriate matching procedure (Guo & Fraser, 2010). The matching procedure was
63. 52
determined following review of the regression results including the variability in the log
odds obtained from cases for potential matching. A ‘caliper’ method was applied that
matched cases based on a narrow range of scores (2010). CE participants were matched
using calipers of width equal to 0.2 of the standard deviation of the logit of the estimated
propensity score. This caliper width has been found to result in strong matching within
a variety of settings (Rosenbaum & Rubin, 1985; Austin, 2010).
The large number of cases available to serve in the matched control group
removed the need for case replacement within the non-participant data file. The
unmatched comparison sample allowed for matching ratios of greater than 3:1. Prior
research has suggested that a 3:1 matching ratio is likely to lead to reasonable case
matching (see Guo & Fraser, 2010). The quality of the obtained matches was determined
based on an examination of descriptive statistics and frequency distributions of the
variables that served as model predictors. Also, the pre-program participation assessment
data was examined to help account for any possible preexisting differences between
groups. Due to the strong alignment of the matches for each year, no additional
procedures were utilized.
Sensitivity Analysis
A sensitivity analysis occurred following generation of propensity scores to
evaluate how results would have differed based on the presence of bias resulting from
unmeasured variables (Guo & Fraser, 2010; AERA, 2010). This procedure serves to
increase our confidence in our statistical matching procedures and informs us off the
64. 53
thoroughness of the matching procedure to capture relevant covariates. The method
employed was a Wilcoxon’s signed-rank test for sensitivity analysis of ranked pairs. The
procedure includes the following steps: compute the ranked absolute differences ds,
compute the Wilcoxon signed-rank statistics for outcome differences between treatment
and control groups, and compute the needed statistics for obtaining the one-sided
significance level for the standardized deviate. (Guo & Fraser, 2010).
Between-Group Comparisons
All outcomes measures were examined for differences between the Colorado
concurrent enrollment participants and control group that was identified based on
propensity scores. The selected between-group statistical analyses depended on the
properties of the specific data to be examined. The outcome data included frequencies,
ratio-level data, along with percentile data that all required unique analytics to determine
between-group differences. The three statistical tests utilized included independent
samples t-tests, dependent samples t-tests, and Mann-Whitney U-tests.
Independent/Dependent Samples t-tests. The t-test is the most commonly used
method to evaluate the difference in outcome means between two groups that are
measured on interval or ratio scales. The independent samples t-test allowed for
between-group comparisons on a single dependent variable of interest. The results of the
test inform us of the probability that the observed differences between groups were due to
chance (Keppel & Zedeck, 1989; Schweigert, 1994). The t-test allows for small sample
comparisons provided that the observed variables are normally distributed and the