1. Introduction
One aspect of new thinking about cities is the growing
appreciation for green infrastructure adaptations with
co-benefits such as stormwater management, ecosystem
restoration, and heat reduction. Green infrastructure
such as stormwater green streets; green roofs; and high-
albedo surfaces, membranes, and materials, traps less
heat throughout the day. As global temperatures rise
and global populations increasingly transition into urban
areas, energy demands and heat-related diseases will
increase. Using a FLIR Thermal Infrared Camera, this
study set out to demonstrate a new methodology for
capturing air temperature (Ta) reductions produced by
green infrastructure on both street and roof levels, and
explore the relationship between air and surface
temperatures. This innovative technique for local
measurement of Ta pushes the boundary of powerful
infrared imaging technology by using simple white copy
paper as a proxy for Ta. Understanding the ability of
green infrastructure to reduce local Ta is crucial for
understanding and adapting to urban heat.
Materials and Methods
FLIR T650sc with wide-angle lens
FLIR Tools Software
Simple white copy paper
61cm x 0.8cm x 0.8cm plastic picture frame
Wooden painter’s stick
1.8m and 0.9m hemp cord
White adhesive putty
Black umbrella
Results Conclusions
In this study, a new approach was taken to capture
infrared images of an air temperature proxy to
investigate the performance of green infrastructure in
reducing local air temperature and the relationship
between air temperature and surface temperature. This
study suggests that green infrastructure reduces air
temperature at three feet at the street level, and at
three feet and six feet on the roof level. Reductions
range from 1.9-6.0°C. Additionally, both white and green
roofs demonstrate reduced air temperatures at six feet
when compared to a traditional black roof. When
adjacent to green infrastructure, air temperatures over a
black roof section were also reduced. Roof air
temperature reductions ranged from 1.4-4.1°C.
Katie Byrd1
, Andrew C. Chui2
, Cynthia D. Herrera3
, Grace Y. Kim4
, Natasha Stamler5
The James Baldwin School for Expeditionary Learning1
, Boston University2
, Columbia University3
, Stony Brook University4
, The Bronx High School of Science5
Further Research
A limitation of this study is the assumption that the
surface of simple copy paper closely approximates Ta.
Validation of this assumption was limited to two test
days at the NOAA Central Park weather station, when
the proxy agreed with the weather station within 1.0°C.
At other field sites, the lack of an on-site weather station
limited the validation. Further research on the
performance of the air temperature proxy is warranted.
A more accurate proxy material may be discovered
based on surface properties such as texture, emissivity,
and micro-granularity. Based on close analysis of results,
we suspect that the proxy may be influenced by
longwave radiation from surrounding surfaces. To
evaluate this possibility, more research is needed,
perhaps using a shield or insulating sheet suspended
below the paper proxy surface.
A wider variety of locations should also be tested to
validate results. An ideal field location for a controlled
simultaneous test would be one roof with black, white,
and green roof sections. Other key variables to include in
future research include vegetation type, roof coating and
membrane type, surface elevation, and temporal
variations.
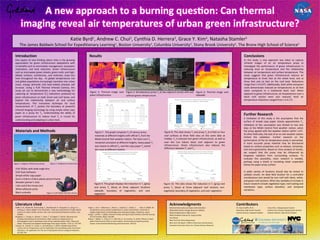
Figure 5. Simultaneous proxy Ta at two adjacent streets with and
without green infrastructure.
SPACE FLIGHT CENTER
Mayor’s Office of
Recovery & Resiliency
Figure 10. This data shows the reduction in Ts (gray) and
proxy Ta (blue) at three adjacent roof sections non-
vegetated, boundary of vegetation, and over vegetation
Figure 9. This graph displays the reduction in Ts (grey)
and proxy Ta (blue) at three adjacent locations
sidewalk, boundary of vegetation, and over
vegetation
Figure 7. This graph compares Ta of various proxy
materials at different heights with official Ta from the
NOAA Central Park weather station. The foam core Ta
remained consistent at different heights, heavy paper Ta
was closest to official Ta, and the copy paper Ta varied
the most at different heights.
Figure 8. This data shows Ts and proxy Ta at 6 feet on four
roof surfaces at three field sites on the same date at
midday. Ta is reduced over green infrastructure, as well as
over the Con Edison black roof adjacent to green
infrastructure. Green infrastructure also reduces the
difference between Ts and Ta.
Figure 3. FLIR T650sc thermal camera.
Figure 1. Diagram of field proxy setup. Figure 2. Fieldwork at street level.
Figure 4. Thermal image over
green infrastructure.
Figure 6. Thermal image over
sidewalk.
Editor's Notes
Copyright Colin Purrington (http://colinpurrington.com/tips/academic/posterdesign).