1. 43
N
0 250 500 1,000
Feet
1,500 2,000 2,500
41
40
25
32
40
54
55
56
63
42
64
41
58
53 77
46
55
40 36
4443
31
42
26
3024
47
33
85
76
40 25
27
41
40
51
32
5256
32
44
35
44
66
20
30
5033 35
62
40
54
11
25
40
35
43
2836
31
42
22
37
44
33
29
53
31
21
46
46
3426
20
26
31
48
48 2824
16
21
45
32
57
30
57
41
19
12
30
14
46
30
44
21
34
25
2819
36
30
24
42
35
40
34
70
56
3928
40
24
21
26
51
16
22
26
12
48
23
34
56
51
38
31
58
48
37
31
26
20
22
54
55
36
24
51
24
33
32
5039
20
32
5761
62
45
34
32
52
36
30
32
40
37
48
62
66
65
71
72
49
77
32
36
36
45
3029
46
22
47
45
42
89
86
74
38
44
21
39 68
28
72
68
82 43
68 50 43
43
28
54
4431
42
44
30
33˚ 9’45”N
33˚ 9’30”N
115˚59’00”W 115˚58’45”W 115˚58’30”W 115˚58’15”W 115˚58’00”W
E
E’
D’
DC B
A’
A
C’ B’ A’
?
?
?
?
?
?
?
PowerlineFault
Lithological Units
Sandy siltstone
Siltstone and sandstone with
spheroidal concretions
Sandstone with platey
concretions
Uncategorized
Above topo line
is projected
100
500
E E’
500100
feet
PowerlineFault
Uncategorized
100
500
C C’
100 500
feet
Above topo line
is projected
Regional Geology
The San Felipe hills are located in the San Felipe-Borrego
basin ~40 miles west of the San Andreas Fault. Prior to
the late Pliocene, dextral slip on the Pacific plate margin
was localized to the San Andreas Fault. Around 1.1ma,
the regional shear zone broadened and dextral motion
was accommodated southwestward. The stratigraphy
and structures in San Felipe-Borrego basin record this
Pliocene transition from regional transtension and de-
tachment, to dextral strike-slip.
The region mapped is within the Pliocene Diablo Formation, which is characterized by cross-
bedded sandstones and mudstones of the ancestral Colorado River delta. Three separate units
were differentiated. Each was estimated to a minimum thickness based on the length of their
longest contiguous exposures. The oldest unit, shown in green, is a ~375ft thick sandstone char-
acterized by distinctly fissile concretions. It is conformably overlain by a ~300-400 ft thick unit of
sandstone with spheroidal concretions which is interbedded with siltstone, shown in orange.
The uppermost unit is a ~1,125 ft thick sandy siltstone, and is shown in blue.
Local Units
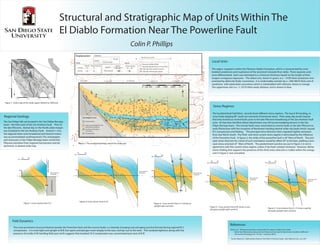
The localized fault-fold fabric records three different stress regimes. The two E-W trending, re-
verse faults dipping 80° south are remnants of tensional stress. Their steep dip would require
that they formed as normal faults prior to the late-Pliocene broadening of the San Andreas Fault
zone. At that time the West Salton detachment was still accommodating tension in the San
Felipe-Borrego basin. The normal faults were reactivated as reverse faults in the late-Pliocene to
early-Pleistocene with the inception of Northwest trending dextral strike-slip faults which caused
N-S compression and folding. The principal stress direction then migrated slightly westward
from due North-South. The third and most current stress regime is dominated by the influence
of the Powerline Fault. In figure 2, the strike of the powerline fault is 45° West of North. The prin-
ciple stress direction for a fault of such orientation would by offset 30° to the East, yielding a prin-
cipal stress oriented 25° West of North. The predominent syncline we see in Figure 2 is not in-
agreement with this current stress regime, unless it has been rotated clockwise. However, dishar-
monic folding that supports the presence of this third stress direction is visible within the orange
unit in Figure 2, but unmarked.
The most prominent structural feature besides the Powerline fault and the reverse faults, is a laterally changing east-plunging syncline formed during regional N-S
compression. It is most tight and upright at B-B’, but opens and plunges more steeply to the east, and tips out to the west. This localized tightness along with the
presence of smaller E-W trending folds just north suggests that localized N-S compression was concentrated just west of B-B’.
Fold Dynamics
Stress Regimes
Figure 1: Index map of the study region relative to California.
Figure 2: The produced geology map of the study area.
Kirby et al. “Pleistocene Brawley and Ocotillo Formations: Evidence for Initial
Strike-Slip Deformation along the San Felipe and San Jacinto Fault Zones, Southern California.”
The Journal of Geology, Vol. 115, No. 1 (January 2007).
Tucker, Maurice E. Sedimentary Rocks in the Field: A Practical Guide. John Wiley & Sons. Ltd. 2011
References
Figure 3: Cross section from A- A’ shows a gently
plunging upright open syncline.
Figure 4: Cross section from B-B’shows a non-
plunging upright tight syncline.
Figure 5: Cross section from C-C’shows an
upright open syncline.
Figure 6: Cross section from D-D’
Figure 7: Cross section from E-E’
100
500
D D’
500100
feet
Above topo line
is projected
?
?
?
?
?
?
?
Explanation Contacts
Poorly exposed
Inferred
?
?
?
?
?
?
?
Definite
Syncline
Anticline
Folds
Definite Poorly exposed
Strike-slip fault
Reverse
Faults
Definite Poorly exposed
38
Measured attitude of bed
Measured attitude of bed in cross section
Strike-slip motion project outward
Strike-slip motion project inward
Denotes cross section
G G’
Structural and Stratigraphic Map of Units Within The
El Diablo Formation Near The Powerline Fault
Colin P. Phillips
feet
Above topo line is
projected
A
A’
0
100
500
500100
B B’100
500
500100
feet
Above topo line
is projected