1. Bishop 1
Improvisational Chamber Music:
Measuring the Speed of Sound Under Varying Conditions
By Clayton Bishop, Nic Lyman, and William Cornell
Research Advisor: Dr. Melanie Lott
Department of Physics and Astronomy
Denison University, April-May 2015
Abstract
Sound waves are longitudinal and thus their speed depends on several factors including
molecular density of the medium and temperature. We used an apparatus consisting of an
adjustable metal chamber inside a larger main chamber, with a loudspeaker and microphone
attached to opposite ends. An input wave from the loudspeaker was received as an output wave
from the microphone and then sent to an attached oscilloscope for closer examining. By filling
this chamber up with various gases, we were able to find the speed of sound within different
mediums around room temperature. The relation is the denser the medium, the faster the sound
will travel through it. These mediums included air, argon, and nitrogen gas. We found the speed
of sound in air to be 347.3 ± 1.6 m/s at 23ºC, in argon to be 317.1 ± 2.1 m/s at 20ºC, and in
nitrogen gas to be 344.1 ± 2.0 m/s at 21ºC. Argon is the least dense of these mediums, and sound
expectedly traveled through it the slowest. In addition to testing out different mediums, we were
able to increase the temperature of the apparatus with a variable autotransformer, and then
measure it with a K-Type thermocouple. This allowed us to measure the speed of sound in air at
different temperatures. We found a correct correlation between the speed of sound and the square
root of temperature for this portion. As temperature increased, the amount of change in the speed
of sound growth decreased. The speeds varied from 361.25 ± 2.12 m/s for 140ºF to 343.75 ±
2.08 m/s for 80ºF.
2. Bishop 2
Introduction
The speed of sound is interesting because of its similarities and differences to the speed
of light. I measured the latter case in the first part of the semester, and so testing the former is a
complimentary exercise. In almost all cases, these two speeds are very contrasting. However,
some articles have shown me that a sound wave traveling on the surface of the sun would
theoretically be faster than light traveling through a certain metamaterial with an index of
refraction over 38!i
Extreme situations aside, the speed of light (in air) is hundreds of thousands
of times faster than sound.ii
Electromagnetic light waves are transverse and do not necessarily need a medium to
propagate. A medium of propagation is critical for sound waves, which are longitudinal. In a
vacuum, sound waves cannot travel; this is where the popular expression, “In space, no one can
hear you scream,” comes from. Sound waves also depend on the temperature of the medium,
whereas light waves do not. Finally, sound has throughout history been only considered a wave
whereas light’s wave-particle duality has been noted.
The study of acoustics began with Pythagoras in Greece in the sixth century B.C.iii
He
was able to identify harmonics as ratios, and stated that there was an inverse relationship to the
length of a string and the pitch of the sound it produced. He also theorized that a vibrating body
would vibrate the air surrounding it at the same frequency.iv
Acoustics were studied on-and-off for about a millennium until the beginning of the
Middle Ages. Sound’s requirement for a medium is the main reason that it was always known to
be a wave. This was most commonly compared to the ripples a stone makes when it is thrown
into a still body of water.v
Aristotle incorrectly hypothesized that sound at a higher frequency
3. Bishop 3
propagated faster than that a lower frequency. However, he did correctly theorize that sound
waves propagate in mediums due to the very motion of that medium.vi
A few decades before the birth of Christ, Roman architect Vetruvius noticed how sound
waves could be reflected and interfere with one another. He solved this problem by installing
equidistantly-spaced, bronze resonating vases behind the audience in a theater.vii
Waves created
by a performer in the center of the stage would strike all of these at the same time which
amplified the sound.
In the sixth century A.D., twelve-hundred years after initial Pythagorean observations,
Roman philosopher Boethius observed acoustics from a viewpoint that favored humanism over
physical science. He wrote about “music of the spheres,” which was a term for the previously-
held notion that planets vibrated and created music. In addition, he spoke of, “the music of the
body,” which is an incredibly abstract concept that connects soul and body through analogy of
sound waves.viii
Despite the use of acoustics to further his philosophical agenda, Boethius
correctly deduced that the human perception of pitch is directly related to the physical reality of
frequency.ix
The list of Reformation Era scientists that studied the speed of sound is as impressive as
it is numerous. Galileo, Hooke, Boyle, Poisson, Newton, Biot, Savort, Euler, LaGrange, and
LaPlace all made contributions to the understanding of acoustics during this time period. Galileo
picked up where Boethius had left off a millennium earlier and studied the relationship between
pitch and frequency. He was able to demonstrate through experimentation that frequency of
sound waves determined pitch. To do this, Galileo created screeching noises by grinding a chisel
against a brass plate. He was then able to show that the distance between the grooves caused by
the chisel was related to the screech’s pitch.x
4. Bishop 4
Frenchman Marin Mersenne is attributed as being the first person to attempt to
experimentally measure the speed of sound in 1636.xi
Mersenne’s simple experiment involved a
gun and a wall. Standing a known distance away from the wall, he would fire his gun at it and
record the time it took for the sound wave emitted from gun to reach the wall then echo back to
him. His original results put the speed of sound in air at about 316 meters per seconds- within
10% of today’s expected room temperature value!xii
This experiment led to dozens of other
scientists testing it themselves at the Florentine Academy, which normalized the distance from
the gun to the wall to be about a mile.xiii
It should be noted that Mersenne’s experimental value
took little account of temperature, humidity, or wind speed/direction.
With Mersenne’s relatively reliable value for speed now available, his contemporaries
were able to focus on different aspects to the physical phenomena of sound. Despite the widely
accepted concept that sound needed a medium to propagate, some 17th
century philosophers
would not rule out the possibility that sound traveled from its source through invisible particles
to the ear of an observer. Robert Hooke took it upon himself to disprove them in 1660 with his
“bell-vacuum” experiment. He placed a bell within a jar then pumped (nearly) all the air out of
the jar, creating an imperfect but reasonable vacuum. The once-audible bell was left mute to
observers after this change took place within the jar. Thus, Hooke was able to prove that a
medium was required for sound waves to transmit.xiv
Newton used his own invention, calculus, to theoretically derive the speed of sound to
within 16% accuracy.xv
The reasons for his error included his assumptions that air particles
exhibited simple harmonic motion and that the heat exchange between the particles through air
was constant. LaPlace and Euler later spent time looking over Newton’s work, and determined
that due to compression/extension of the sound wave, the heat it produced did not remain
5. Bishop 5
constant.xvi
Instead, each medium that sound propagated through had a relative value that would
be called “specific heat.” Specific heat was then loosely defined as the amount of heat necessary
to raise a given quantity of substance a certain temperature difference. Biot and Poisson then
started the experimental movement to begin testing different materials for their respective
specific heats in the early 19th
century.xvii
After these theoretical derivations and known values for specific heat were measured,
researchers were able to spend more time looking for practical applications of sound waves. At
the turn of the 20th
century, Wallace Sabine created the field of architectural acoustics when he
was tasked with figuring out an echo problem within a Harvard lecture hall.xviii
He measured
sound-absorption coefficients of various building materials and found a way to measure
“reverberation time.” Sonars were later used for anti-submarine detection during WWI and
beyond.xix
By the middle of the century, sound waves were helping the medical field. Ultrasound
was first used to view an utero-fetus in 1958, and then expanded for another decade in order to
view human organs without surgery.xx
The speed of sound in air at 0º C was found to be precisely 331.45 meters per second in
1942.xxi
This was altered slightly after additional testing to the current accepted value of 331.29
meters per second in 1986.xxii
Naturally, humankind wanted to travel faster than this speed for
various reasons. Captain Chuck Yeager became the first person to reach the sound barrier.xxiii
He
took advantage of the fact that the speed of sound varies with the square root of temperature, and
took his aircraft up to such an altitude that he was able to travel less than 300 meters per second
and still break the sound barrier.xxiv
A motivating feature of this experiment is the number of variables I can manipulate to get
different results. The speed of light lab was absolute in that no matter what steps were taken, the
6. Bishop 6
end result should always be the same. This case is more fascinating in that I can see how the
alteration of factors such as temperature and medium affect my found results for speed of sound.
Also, the atomic structure of the medium comes into play when calculating final values.
Theory
Sound travels through any medium as a longitudinal wave. A longitudinal wave is one
that transfers energy in the same direction as it is traveling. Particles within the medium that the
sound wave is traveling do not continue along with the wave in this situation; they just receive
some energy and oscillate from their equilibrium position. The maximum amount of energy
transferred is when the wave is at either a peak or a trough. In a standing wave, these points are
known as anti-nodes, and the largest concentration of particles occurs there. These areas of high
concentration are referred to as condensations.xxv
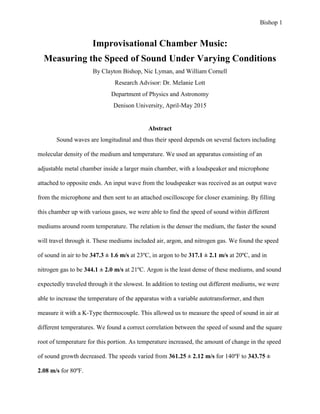
Likewise, the least amount of energy is transferred between particles when the wave is at
a node, the midway point between any consecutive peak and trough. These areas of low particle
concentration within the medium are known as rarefactions.xxvi
Particles within the
5 10 15
1.0
0.5
0.5
1.0
Distance (m)
Amplitude(V)
Figure 2, a Physical Model of Pressure
Figure 1, Displacement Wave
7. Bishop 7
xxvii
condensations oscillate to rarefactions, transfer energy to particles there, then return to their
original condensation. The particles within this rarefaction that have just received energy move
to the next condensation, transfer energy to particles there, and then return. This process
continues through the entire medium.
It is useful to view how a sound wave acts within an air column. Air columns are any
cylindrical (or similarly shaped) volumes that contain some medium. Some, like this experiment,
have two closed ends. Others, like organ pipes, have only one closed end. By having both ends
closed on this air column, it is possible to create standing waves within it. Resonant standing
waves are formed when a sound wave reaches one end of the column perfectly at a displacement
node, so that n/2 (n= 1,2,3…) wavelengths of the sound wave exist within the air column. In
standing waves, the transmitted and reflected waves interfere constructively to double the
amplitude of the single wave that is formed. This is to say that if a transmitted wave of amplitude
A hits one end of the air column at a node, it creates a reflected wave of the same amplitude A
traveling back in the same direction. The constructive interference of these two in-phase waves
will result in a single wave of amplitude 2A appearing.xxviii
The amplitudes can be measured on a device such as an oscilloscope in terms of the
voltage root-mean-squared value, or Vrms for short. The Vrms will be greatest when there are n or
n/2 wavelengths within the air column. The Vrms will be lowest when there are n/4 or 3n/4
Figure 3
8. Bishop 8
wavelengths within the air column. Careful adjustments of either the frequency or length of the
air column will allow for the discovery of a maximum Vrms so that an experimenter will know
there is either n or n/2 wavelengths present.
Standing waves are useful for figuring out a sound wave’s fundamental frequency and
following harmonics. The speed of sound, S, can be measured experimentally with two different
formulas:
(i) S = λ*υ m/s
(ii) S = Squareroot[(R*T*γ)/M] m/s
where λ= wavelength (meters), υ= frequency (seconds-1
), R= Universal Gas Constant, 8.314 (Joules/(mol*K)), T= temperature (Kelvin), γ=
ratio of specific heats (unitless), and M= molecular weight (kg/mol)
Equation (ii) comes from the relation of the force of tension, F, on a string:
(a) F= (m*v2
)/l
Where l is the length of the string, mass is its mass, and v is the velocity of a transverse
wave moving along it. Solving for v, we obtain:
(b) v = Squareroot[(F*l)/m]
Similar to (ii), mass is in the denominator of the square root function. The numerator of
(ii) can then be assumed to cancel into units of Newton-meters. Recall that the term γ is unit-less,
and the Kelvins from temperature cancel out with those in the denominator for the Universal Gas
Constant, R. Newton-meters are then equivalent to Joules per mol.
The molecular mass of a gas sample is much easier to use when it is uniformly the same
element. For argon and nitrogen, the molecular mass is known accurately. Relative to that, air is
more difficult to find since it is composed of various gases of differing molecular mass.
9. Bishop 9
The speed of sound is frequency independent. Increasing the frequency in an attempt to
increase the speed of sound will only decrease the wavelength so that the speed of sound remains
constant. Changing the medium the wave is propagating through (γ) or its temperature (T) will,
however, result in a new speed of sound.
Since air has been the most experimented-with medium on Earth in the last few centuries,
its speed can be easily calculated with a nifty, temperature-dependent formula:
(iii) Sair = 331.29 + 0.606*(T-273.15) m/s
or similarly
(iv) Sair = 331.29 + 0.606*Tc m/s
where Tc is temperature in Celsius.
One can see that if I test this when 0ºC, the second term in (iv) will go to 0 and one will
be left with the universally accepted value of 331.29 m/s for the speed of sound. These last two
equations make it possible to find the speed of sound using only a thermometer.
The speed of sound in a medium is related to the square root of its temperature. A change
from lower temperatures, say 1°K to 2°K, will have much more of an effect on the speed of
sound than a change from higher temperatures such as 300°K to 301°K. The reasoning here is
purely mathematical: the difference between the square roots of 1 and 2 is 0.41, while the
difference between the square roots of 300 and 301 is 0.029. The former is more than 14 times
0
1
2
3
4
5
6
0 5 10 15 20 25 30 35
Square Root FunctionFigure 4
10. Bishop 10
greater than the latter and so it is shown that changes at lower temperatures cause a greater
change in the speed of sound than at higher temperatures. As a limiting case, the derivative of the
speed of sound goes to zero as the temperature goes to infinity.
Involving temperature results in pressure becoming a factor. According to Boyle’s Law:
(v) P1*V1=P2*V2
So that if volume remains constant, so will pressure. This becomes marginally more
complicated when temperature is introduced in the Combined Gas Law:
(vi) (P1*V1)/T1= (P2*V2)/T2
When the volume doesn’t change, those terms cancel out and what’s left is:
(vii) P1/T1= P2/T2
This states that as temperature increases, so does pressure. Pressure can be defined as the
number of gas particles hitting the walls of its container in a given time interval. Heat transfers
kinetic energy to particles, and since their mass does not change upon this transfer, their velocity
must increase. The increase in velocity results in more particles hitting the container walls in a
set time interval which results in an increase in the pressure. As a medium’s pressure increases,
so does the speed of sound traveling through it.
Aside from temperature, the speed of sound in a medium is directly related to its atomic
density. A compact medium requires each particle to oscillate a lesser distance than in an
uncondensed one. Due to each particle traveling less distance, they require less energy to
transmit the sound wave. A reduced amount of energy spent oscillating particles results in a
11. Bishop 11
slower sound wave in the medium. The greater a medium’s atomic density, the faster sound will
travel through it.
Argon has an atomic density of 1.78 grams per liter. Nitrogen has a lesser density of 1.25
grams per liter, but it is diatomic whereas argon is monatomic.xxix
Due to this, nitrogen gas is
actually N2 and its atomic density doubles to 2.50 grams per liter, making it denser than argon.
Thus, a sound wave should travel faster in N2 than in argon (assuming both gases are under
similar conditions). Air’s atomic density is a bit trickier since it is composed of 78.1% N2, 20.9%
O2, and about 1% argon.xxx
Oxygen and nitrogen are both diatomic, and so their atomic densities
will both double. With this in mind, I have calculated air’s atomic density to be 2.57 grams per
liter. If the temperature in all gases is constant, than sound should move fastest in air, then N2,
and slowest in argon.
Experimental Procedures
Two overarching experiments were completed. The first focused on the speed of sound in
different gases; air, argon, and nitrogen (N2). The second concentrated on the speed of sound in
air with varying temperature.
12. Bishop 12
The base apparatus used in both experiments composed of an empty, metal cylinder of
length 1.126 meters. The ends of the tube rested within wooden blocks so that it remained
Note:The“plugtovariac”isonthe
oppositeside.Also,the“GasInsert”is
inbetweentheadjustablechamber
andtheGasNozzle
Apparatus
13. Bishop 13
stationary. Within this main chamber was a thinner, metal cylinder of length 0.955 meters. This
chamber was adjustable from the outside and could be completely removed from the main
chamber. Due to a tube abutting from one end of the adjustable chamber, it could never entirely
enter the main chamber. The system was not perfectly airtight and the opening for the adjustable
chamber allowed trace amounts of gas to move from the high-pressure chamber to the
laboratory.
The main chamber was lined with several heat strips that surrounded the adjustable
chamber. These strips were interlinked and attached to a wire on one end of the main chamber.
This wire led outside the base apparatus to a Staco Energy® Variable Autotransformer,
otherwise known as a “variac.” The variac had an electric potential of 140 volts and could send
any percentage of that in the form of current to the heating strips. Upon cranking the variac up to
its maximum, we observed that the temperature within the main chamber was well on its way to
200ºF. We noted how this could be potentially dangerous and never increased the variac to over
100 volts for the remainder of the experiment. Turning off the variac resulted in the temperature
within the chamber to cool down slowly. When we wanted to keep a high temperature constant
long enough to take data, we set the variac to 5 volts. This created just enough current to prevent
the temperature from dropping for a few minutes.
On the opposite end of the apparatus, a gas insert was attached to the adjustable chamber.
The gas insert is what I mentioned previously as what prevents the adjustable chamber from
entirely entering the main one. This component was crucial for trials involving argon and
nitrogen gas. The insert was attached to a tube with a nozzle on it. From this nozzle, this tube
extended to another nozzle on a massive tank of gas. In order to send gas from the tank to the
chamber, both nozzles had to be opened. When the high-pressure tank was then opened, gas was
14. Bishop 14
able to escape to the low-pressure main chamber. A regulator was attached to the top of the gas
tanks to make sure not too much gas escaped. When the chamber was filled, excess gas escaped
out of the fringes of the hole encompassing the adjustable chamber.
The adjustable chamber housed a loudspeaker at its outer end. This loudspeaker was
attached to external blue and white wires that connected to a Hewlett-Packard® 3311A Function
Generator. The function generator sent sine waves with variable frequencies to the loudspeaker,
which produced sound waves within the adjustable chamber that led out into the main one. The
frequency sent could be easily adjusted with an on-board dial. I observed that an increased
frequency led to an increased pitch, correct with what Boethius theorized almost 1,500 years ago.
The function generator was then connected to Channel 2 on a Tektronix® TDS 10001-B
Oscilloscope so that we could observe the input function. This function only changed when we
adjusted the dial on the generator. Changes to the distance between the loudspeaker and
microphone did not affect it.
An internal microphone rested within the end of the main chamber furthest away from the
loudspeaker. Its purpose was to detect sound waves coming from the loudspeaker and traveling a
variable distance through the medium. The microphone picked up these output waves and sent
them through blue and yellow wires to Channel 1 of the oscilloscope. It was simple to compare
the behaviors of input and output waves on the same scope screen. We were able to observe
factors such as phase shift and relative Vrms. The battery in the microphone had to be changed
after a week, as I foolishly left it on after a lab period for several days. The replacement battery
lead to much more precise measurements in Vrms and a clearer output wave signal.
An 8-inch metal tube with a radius considerably less than that of the main chamber was
inserted right next to the microphone. Two ends of an external K-Type thermocouple were
15. Bishop 15
strung through this tube and into the main chamber. This allowed for accurate temperature
readings within the apparatus. The ends led out of the tube to the thermocouple that was attached
to an Amprobe. Towards the end of the experiment, we had to replace the thermocouple since it
always read as room temperature. We knew this could not be correct as the main chamber felt
warm to the touch. It could have been broken during the extreme temperatures reached when
initially testing the variac. The new thermocouple was only used for the temperature-dependent
experiment. As a result, the temperature readings for the medium-dependent experiment could be
slightly off.
The speed of sound measurements for the room-temperature air required the least
attention to detail. We did four different trials with this set-up using four different frequencies:
2500, 2000, 1500, and 1000 Hz. We chose these frequencies since we knew we would get at
least a full wavelength to measure within the confines of the apparatus. Each trial started with us
entering the desired frequency. Then we would slide the adjustable chamber while closely
monitoring Channel 1’s Vrms value. The Vrms would peak when we had modified the length of the
adjustment chamber so that n or n/2 wavelengths of the sound waves were between the
loudspeaker and the microphone. The Vrms could be read on the oscilloscope. When any one of
multiple maximum amplitudes was found, we placed a piece of electrical tape on the surface of
the adjustable chamber closest to the main chamber. From there, we continued to inch the
adjustable chamber out slowly, until the next peak Vrms was found. Another piece of electrical
tape was put down at this mark. The distance between the centers of the two pieces of tape
represented half a wavelength. We continued this process, until at least four but usually five
maximum amplitudes had been found. This normally represented two full wavelengths. From
here, we were able to calculate the speed of sound using the known frequency from the function
16. Bishop 16
generator and the calculated wavelength from our handmade measurements. Afterwards, we
measured the displacements between consecutive pieces of tape (half wavelengths), multiplied
them by two and then by the frequency to make sure this speed somewhat agreed with the best
measurement for speed of sound. It was also done to make sure none of the intervals deviated too
greatly.
The next portion of this experiment required using argon. My group cracked open the
door to the hallway as well as laboratory window to reduce the chance of suffocation. We
connected the tank of argon to the gas insert and let it fill the apparatus. We knew the tank was
full of argon when the temperature inside the main chamber dropped 2°C from room
temperature. The argon within the insulated tank was known to be less than room temperature.
After a couple minutes, we then took measurements in an identical fashion to when there was
normal air inside. This time, only three trials (at frequencies 2500, 2000, and 1500 Hz) were
recorded. We then turned off the gas supply and removed the tank from the laboratory.
After the argon tests, we allowed the apparatus to sit for a few days so that all argon
would vacate the main chamber. A tank of N2 was then brought in and secured to the lab bench.
The exact same process for the previous two gases resulted in three usable trials of data
collection. These trials were performed with input waves of 2500, 2000, and 1500 Hz. The safety
precautions taken for argon were not as rigorously followed for this gas, as it already composes
78% of the surrounding air. These ten total trials between three different gases gave enough
information to conclude the first experiment.
The temperature-dependent experiment could only be done using air; an astute
observation made by my colleague William. During our attempt to simultaneously fill the
chamber with argon gas while heating it up, we noticed that the temperature was not increasing
17. Bishop 17
at all. William realized that the reason the gas was not being heated was because of the flow.
Cold argon flowed into the chamber, got heated, and then was pushed out of the apparatus by
new, colder argon coming from the tank. The result would have been the same for nitrogen, and
so we did not even bother testing temperature-dependence with that one. This discovery led to
my group only experimenting with air, since it did not have a flow.
The air inside the chamber was initially heated to 140ºF. We decided to measure in
Fahrenheit for this experiment, since Amprobes read it more accurately than Celsius. We could
then make conversions from Fahrenheit to Kelvin for use in (ii). The frequency was kept at 2500
Hz for the entire experiment. The process to measuring wavelengths using the oscilloscope and
sliding the adjustable chamber was the same as in the first experiment. Two wavelengths were
measured at each temperature, with seven trials being done overall. These trials started at 140ºF,
then decreased in intervals of roughly 10ºF until we reached the final trial at 80ºF. The most
challenging part to this was keeping the temperature constant during measurements. We
accomplished this by turning the variac back on and setting it to 6 volts, so that some heat was
returning to the chamber. After measurements, we turned the variac off completely so the
temperature would drop.
Data Analysis
The smallest unit of measurement on the meter stick used in these experiments was the
millimeter. No matter how many wavelengths made up the total length of a trial, the
measurement was always good to the nearest millimeter. The total length was the measurement
from the first piece of tape laid to the last. For instance, if a total length was found to be 28.6 cm,
I knew the actual length had to be between 28.5 cm and 28.7 cm. So if the total length’s
uncertainty was 0.001 meters, than the uncertainty for wavelength had to be less than this,
18. Bishop 18
assuming the total length contained multiple wavelengths. In most cases, there were two
wavelengths found, and so I divided the total uncertainty by two, leaving ± 0.0005 meters.
To make measurements more precise, we measured from the left end of each piece of
tape instead of the middle. Where the middle is “exactly” on a piece of tape is a lot more
subjective than where its edge is. So I would place the beginning of my meter stick on the
boundary between the black tape and the metal adjustment chamber. The displacement values
always went from right to left; the first displacement is from the original, right-most piece of
tape and the piece immediately to its left. The second displacement is from the left side of this
second piece of tape to the left side of the tape to its left. This is the third piece of tape, and the
process continues until all displacements are measured. Although we measured the speed of
sound both between displacements and for the total length divided by the number of
wavelengths, we ultimately used the total length to report our findings.
Frequency uncertainty was more objective to measure than that of wavelength. We got a
much more accurate value for input frequency on the oscilloscope than we did from merely
staring at the dial. The goal was to get the frequency so that it “stuck” on the desired number, i.e.
2500, 2000. Even though this was accomplished, the frequency would still oscillate a small
fraction of itself above and below the preferred number. For example, say we got the frequency
on the oscilloscope to read 2500 Hz most of the time. Without touching the dial on the function
generator, the frequency on the oscilloscope would jump to 2506 Hz for a brief second before
returning to its equilibrium. Another minute later, it may briefly appear as 2494 Hz. We took the
amount that the frequency would oscillate to be its uncertainty. For the above (and usual) case,
the frequency would be 6 Hz.
19. Bishop 19
The use of fractional uncertainties gave final uncertainties for the speed of sound. Since
that can be calculated as:
(i) S = λ*υ
In terms of uncertainties, this can be rewritten as:
(viii) (ϭS/Sbest) = (ϭλ/λbest) + (ϭυ/υbest)
All of these values, besides ϭS, have been found experimentally. Thus we have one
equation, one unknown variable, and can easily solve for that unknown.
Four usable trials were gathered for the speed of sound in air at room-temperature. The
average and most likely temperature for the inside of the main chamber was 23ºC. The ± 2ºC
uncertainty in temperature was extremely generous due to the thermocouple.
Trial 1
Frequency (Hz) 2002
δ Frequency (Hz) 4
Temperature (⁰C) 23
δ Temperature (⁰C) 2
Wavelengths (n) 3
Total Length (m) 0.52
δ Total Length (m) 0.001
Wavelength (m) 0.173
Speed, best (m/s) 346.95
δS (m/s) 1.355
Trial 2
Frequency (Hz) 2500
δ Frequency (Hz) 6
Temperature (⁰C) 24
δ Temperature (⁰C) 2
Wavelengths (n) 2
Total Length (m) 0.278
δ Total Length (m) 0.001
Wavelength (m) 0.139
Speed, best (m/s) 347.5
δS (m/s) 2.084
Trial 3
Frequency (Hz) 1502
δ Frequency (Hz) 4
Temperature (⁰C) 23
δ Temperature (⁰C) 2
Wavelengths (n) 2
Total Length (m) 0.463
δ Total Length (m) 0.001
Wavelength (m) 0.2315
Speed, best (m/s) 347.71
δS (m/s) 1.677
Trial 4
Frequency (Hz) 1001
δ Frequency (Hz) 2
Temperature (⁰C) 23
δ Temperature (⁰C) 2
Wavelengths (n) 1.5
Total Length (m) 0.52
δ Total Length (m) 0.001
Wavelength (m) 0.3467
Speed, best (m/s) 347.05
δS (m/s) 1.364
Table 1: Air
20. Bishop 20
Due to the number of wavelengths measured in each case, the ϭλ differed. Three
wavelengths were included in the total length of Trial 1, and so ϭλ= 0.00033. For Trials 2 & 3,
two full wavelengths were measured and so ϭλ= 0.0005 for both cases. Finally, we didn’t get as
much data for Trial 4 (only 1.5 wavelengths), and so its ϭλ= 0.00067. Taking the average of both
speeds and their uncertainties, the speed of sound in air at 23ºC is 347.30 ± 1.62 m/s. The
expected speed of sound waves is 345.23 m/s, and so the percent difference between the
experimental value and the theoretical one is less than 1%.
Trial 1
Displacement # Displacement Distance (m) Speed (m/s)
1 0.086 344.44
2 0.086 344.44
3 0.09 360.36
4 0.089 356.36
5 0.086 344.44
6 0.087 348.35
Trial 3
Displacement # Displacement Distance (m) Speed (m/s)
1 0.111 333.44
2 0.11 330
3 0.117 351.47
4 0.114 342.46
Table 2: Displacements
Trial 2
Displacement # Displacement Distance (m) Speed (m/s)
1 0.071 355
2 0.069 345
3 0.071 355
4 0.064 320
Trial 4
Displacement # Displacement Distance (m) Speed (m/s)
1 0.174 348.35
2 0.171 342.34
3 0.173 346.35
21. Bishop 21
None of the individual displacements result in a speed that differs with the best found
value by more than 10% and so I accept them all as reasonable.
Argon, which has a much lower atomic density than air, resulted in expected data. Sound
waves were anticipated to move slower within this medium, and they did so considerably. All
three trials had a wavelength uncertainty of 0.0005 meters. The average of all values resulted in a
best value of 317.17 ± 2.12 m/s at 20ºC. Sound waves propagated 9% slower within the argon
than they did in the air.
Trial 1 Trial 2
Frequency (Hz) 2000 Frequency (Hz) 2500
δ Frequency (Hz) 4 δ Frequency (Hz) 13
Temperature (⁰C) 21 Temperature (⁰C) 20
δ Temperature (⁰C) 2 δ Temperature (⁰C) 2
Wavelengths (n) 2 Wavelengths (n) 2
Total Length (m) 0.314 Total Length (m) 0.258
δ Total Length (m) 0.001 δ Total Length (m) 0.001
Wavelength (m) 0.157 Wavelength (m) 0.129
Speed, best (m/s) 314 Speed, best (m/s) 322.5
δS (m/s) 1.628 δS (m/s) 2.927
Trial 3
Frequency (Hz) 1500
δ Frequency (Hz) 5
Temperature (⁰C) 20
δ Temperature (⁰C) 2
Wavelengths (n) 2
Total Length (m) 0.42
δ Total Length (m) 0.001
Wavelength (m) 0.21
Speed, best (m/s) 315
δS (m/s) 1.8
Table 3: Argon
22. Bishop 22
Table 4: Displacements
The displacement data was expected and featured nothing out of the ordinary. The
slowest a displacement velocity got was 304 m/s and the highest was 328 m/s; neither is too
great of an outlier to consider throwing out data.
We expected N2 to produce similar results to that of air. True to form, the best values
respective values were within 1% of each other. At 21ºC, the speed of sound in N2 gas was found
to be 344.08 ± 2.04 m/s. The uncertainty in wavelength was once again 0.0005 meters for all
three trials.
Trial 1
Displacement # Displacement Distance (m) Speed (m/s)
1 0.077 308
2 0.082 328
3 0.076 304
4 0.077 308
Trial 2
Displacement # Displacement Distance (m) Speed (m/s)
1 0.064 320
2 0.063 315
3 0.064 320
4 0.065 325
Trial 3
Displacement # Displacement Distance (m) Speed (m/s)
1 0.102 306
2 0.107 321
3 0.103 309
4 0.103 309
23. Bishop 23
The first trial resulted in some of the most precise data in the entire experiment. Three of
the four displacements resulted in speeds of 345 m/s.
The second experiment was far more focused on finding a relationship between the speed
of sound in air and the square root of its temperature. We got seven reliable trials with the
following data:
Trial 1 Trial 2
Frequency (Hz) 2500 Frequency (Hz) 2000
δ Frequency (Hz) 6 δ Frequency (Hz) 8
Temperature (⁰C) 21 Temperature (⁰C) 21
δ Temperature (⁰C) 2 δ Temperature (⁰C) 2
Wavelengths (n) 2 Wavelengths (n) 2
Total Length (m) 0.276 Total Length (m) 0.346
δ Total Length (m) 0.001 δ Total Length (m) 0.001
Wavelength (m) 0.138 Wavelength (m) 0.173
Speed, best (m/s) 345 Speed, best (m/s) 346
δS (m/s) 2.078 δS (m/s) 2.384
Trial 3
Frequency (Hz) 1500
δ Frequency (Hz) 4
Temperature (⁰C) 22
δ Temperature (⁰C) 2
Wavelengths (n) 2
Total Length (m) 0.455
δ Total Length (m) 0.001
Wavelength (m) 0.2275
Speed, best (m/s) 341.25
δS (m/s) 1.66
Trial 1
Displacement # Displacement Distance (m) Speed (m/s)
1 0.069 345
2 0.069 345
3 0.071 355
4 0.069 345
Trial 2
Displacement # Displacement Distance (m) Speed (m/s)
1 0.085 340
2 0.082 328
3 0.09 360
4 0.085 340
Trial 3
Displacement # Displacement Distance (m) Speed (m/s)
1 0.115 345
2 0.113 339
3 0.116 348
4 0.109 327
Table 5: Nitrogen Gas
Table 6: Displacements
24. Bishop 24
In all trials, the frequency was 2500 ± 6 Hz. The total number of wavelengths measured
was two for each trial. The total length had an uncertainty of a millimeter.
Trial 1 Trial 2
Temperature (⁰F) 140 Temperature (⁰F) 132
δ Temperature (⁰F) 2 δ Temperature (⁰F) 2
Total Length (m) 0.289 Total Length (m) 0.288
Wavelength (m) 0.1445 Wavelength (m) 0.144
Speed, best (m/s) 361.25 Speed, best (m/s) 360
δS (m/s) 2.117 δS (m/s) 2.114
Trial 3 Trial 4
Temperature (⁰F) 119 Temperature (⁰F) 109
δ Temperature (⁰F) 2 δ Temperature (⁰F) 2
Total Length (m) 0.286 Total Length (m) 0.284
Wavelength (m) 0.143 Wavelength (m) 0.142
Speed, best (m/s) 357.5 Speed, best (m/s) 355
δS (m/s) 2.108 δS (m/s) 2.102
Trial 5 Trial 6
Temperature (⁰F) 101 Temperature (⁰F) 90
δ Temperature (⁰F) 2 δ Temperature (⁰F) 2
Total Length (m) 0.282 Total Length (m) 0.28
Wavelength (m) 0.141 Wavelength (m) 0.14
Speed, best (m/s) 352.5 Speed, best (m/s) 350
δS (m/s) 2.096 δS (m/s) 2.09
Trial 7
Temperature (⁰F) 80
δ Temperature (⁰F) 2
Total Length (m) 0.275
Wavelength (m) 0.1375
Speed, best (m/s) 343.75
δS (m/s) 2.075
25. Bishop 25
The graph of temperature vs. speed, with a polynomial trend line, looked like:
Which appears similar to the graph of the square root function:
The derivative is decreasing in both functions. The difference between speeds at 90ºF and
80ºF is 6.25 m/s. Meanwhile, the difference in speeds between 140ºF and 132ºF is only 1.25 m/s.
Although I realize the temperature differences are not the same, the changes in speed are
342
344
346
348
350
352
354
356
358
360
362
364
295 300 305 310 315 320 325 330 335
Speed of Sound (m/s) vs. Temperature (K)
0
1
2
3
4
5
6
0 5 10 15 20 25 30 35
Square Root Function
26. Bishop 26
significant enough to comprehend that as temperature increases, and so does the positive slope of
the speed of sound. So (ii) is upheld by this experiment.
Conclusion
The speed of sound depends heavily on the type of medium the sound waves are traveling
through. This was demonstrated, as waves moved noticeably faster in the air and N2 gas as
opposed to the less-dense argon. As temperature increases, so does the speed of sound. This
relationship has been proven to not be linear, and instead the speed of sound is related to the
square root of temperature. There were some improvements made to our apparatus along the
course of the experiments, such as replacing the microphone battery and installing a new
thermocouple. This was an interesting experiment for me since it brought me back to the speed
of light experiment I did in January. It was also a refresher that gave me an in-depth review of
the difference between transverse and longitudinal waves. I was glad that no one got argon
poisoning. This experiment gave me the opportunity to have a choice in the factors that I could
manipulate and helped me progress as a physicist.
i
http://physicsworld.com/cws/article/news/2011/feb/16/metamaterial-breaks-refraction-record
ii
http://coolcosmos.ipac.caltech.edu/ask/7-How-hot-is-the-Sun-
iii
http://www.eolss.net/sample-chapters/c05/e6-06b-01-05.pdf
iv
Ibid
v
Ibid
vi
http://www.britannica.com/EBchecked/topic/4044/acoustics/64047/Early-experimentation
vii
https://www.herts.ac.uk/__data/assets/pdf_file/0020/12377/WPIAAD_vol4_godman.pdf
viii
http://www.cengage.com/music/book_content/049557273X_wrightSimms_DEMO/assets/ITOW/7273X_01_ITOW
_Boethius.pdf
ix
Ibid
x
http://www.electricalfacts.com/Neca/Science/sound/history.shtml
xi
http://www3.nd.edu/~powers/ame.20231/finn1964.pdf
xii
Ibid
xiii
http://www3.nd.edu/~powers/ame.20231/finn1964.pdf
xiv
http://www.britannica.com/EBchecked/topic/4044/acoustics/64047/Early-experimentation
xv
http://www.eolss.net/sample-chapters/c05/e6-06b-01-05.pdf