Download as PDF, PPTX

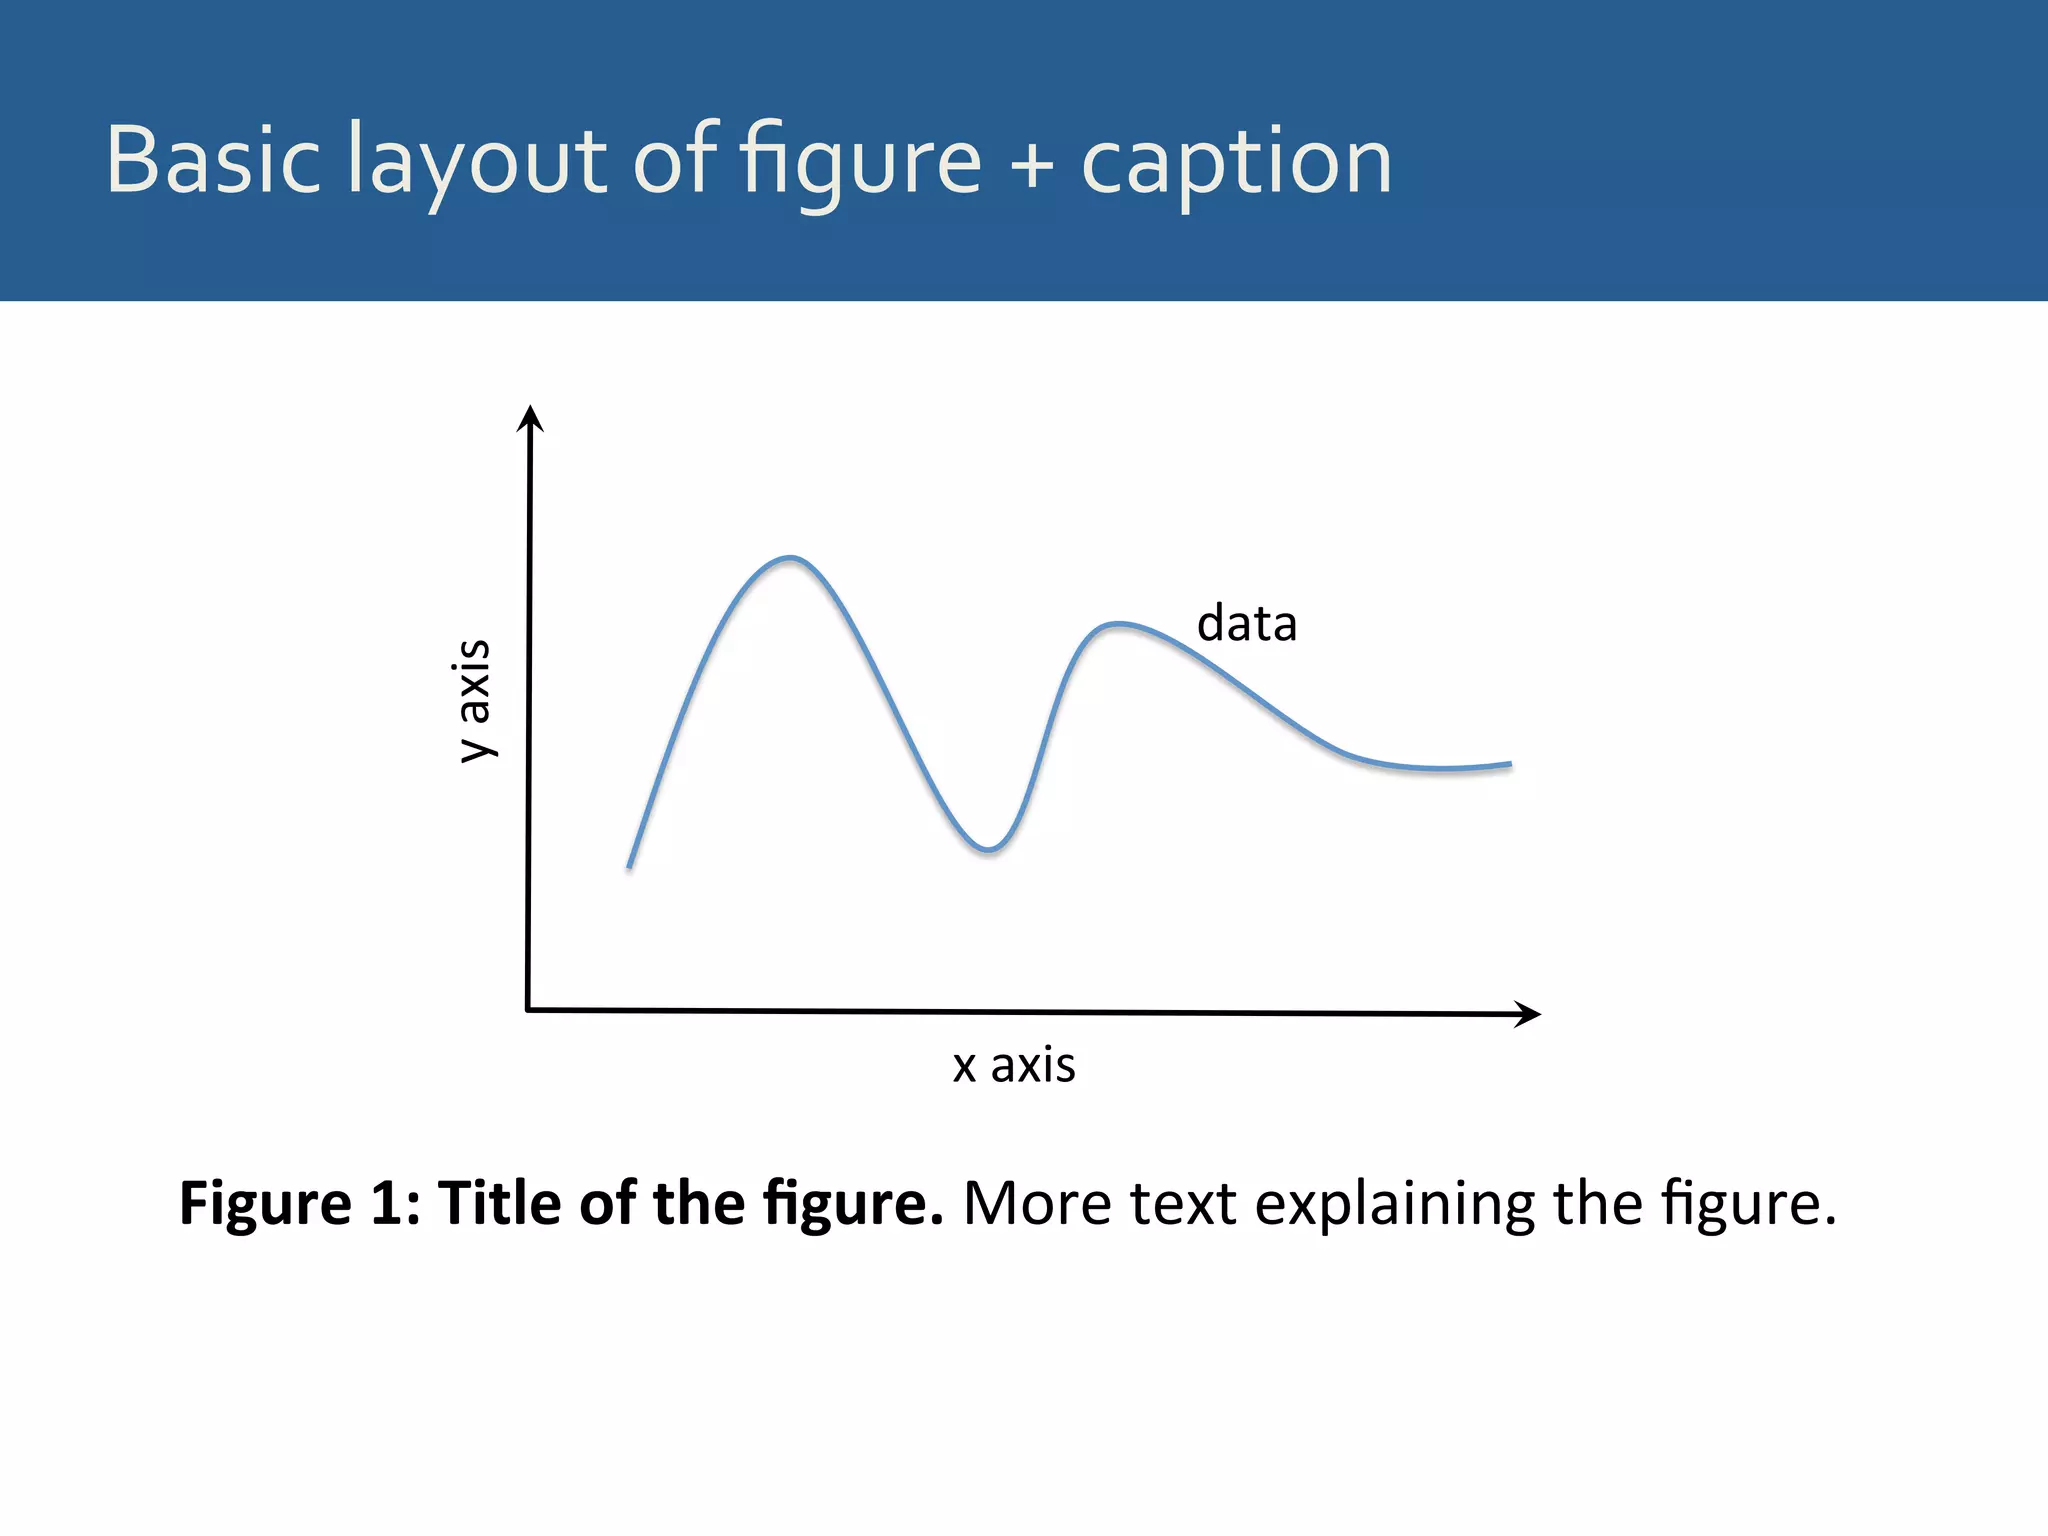
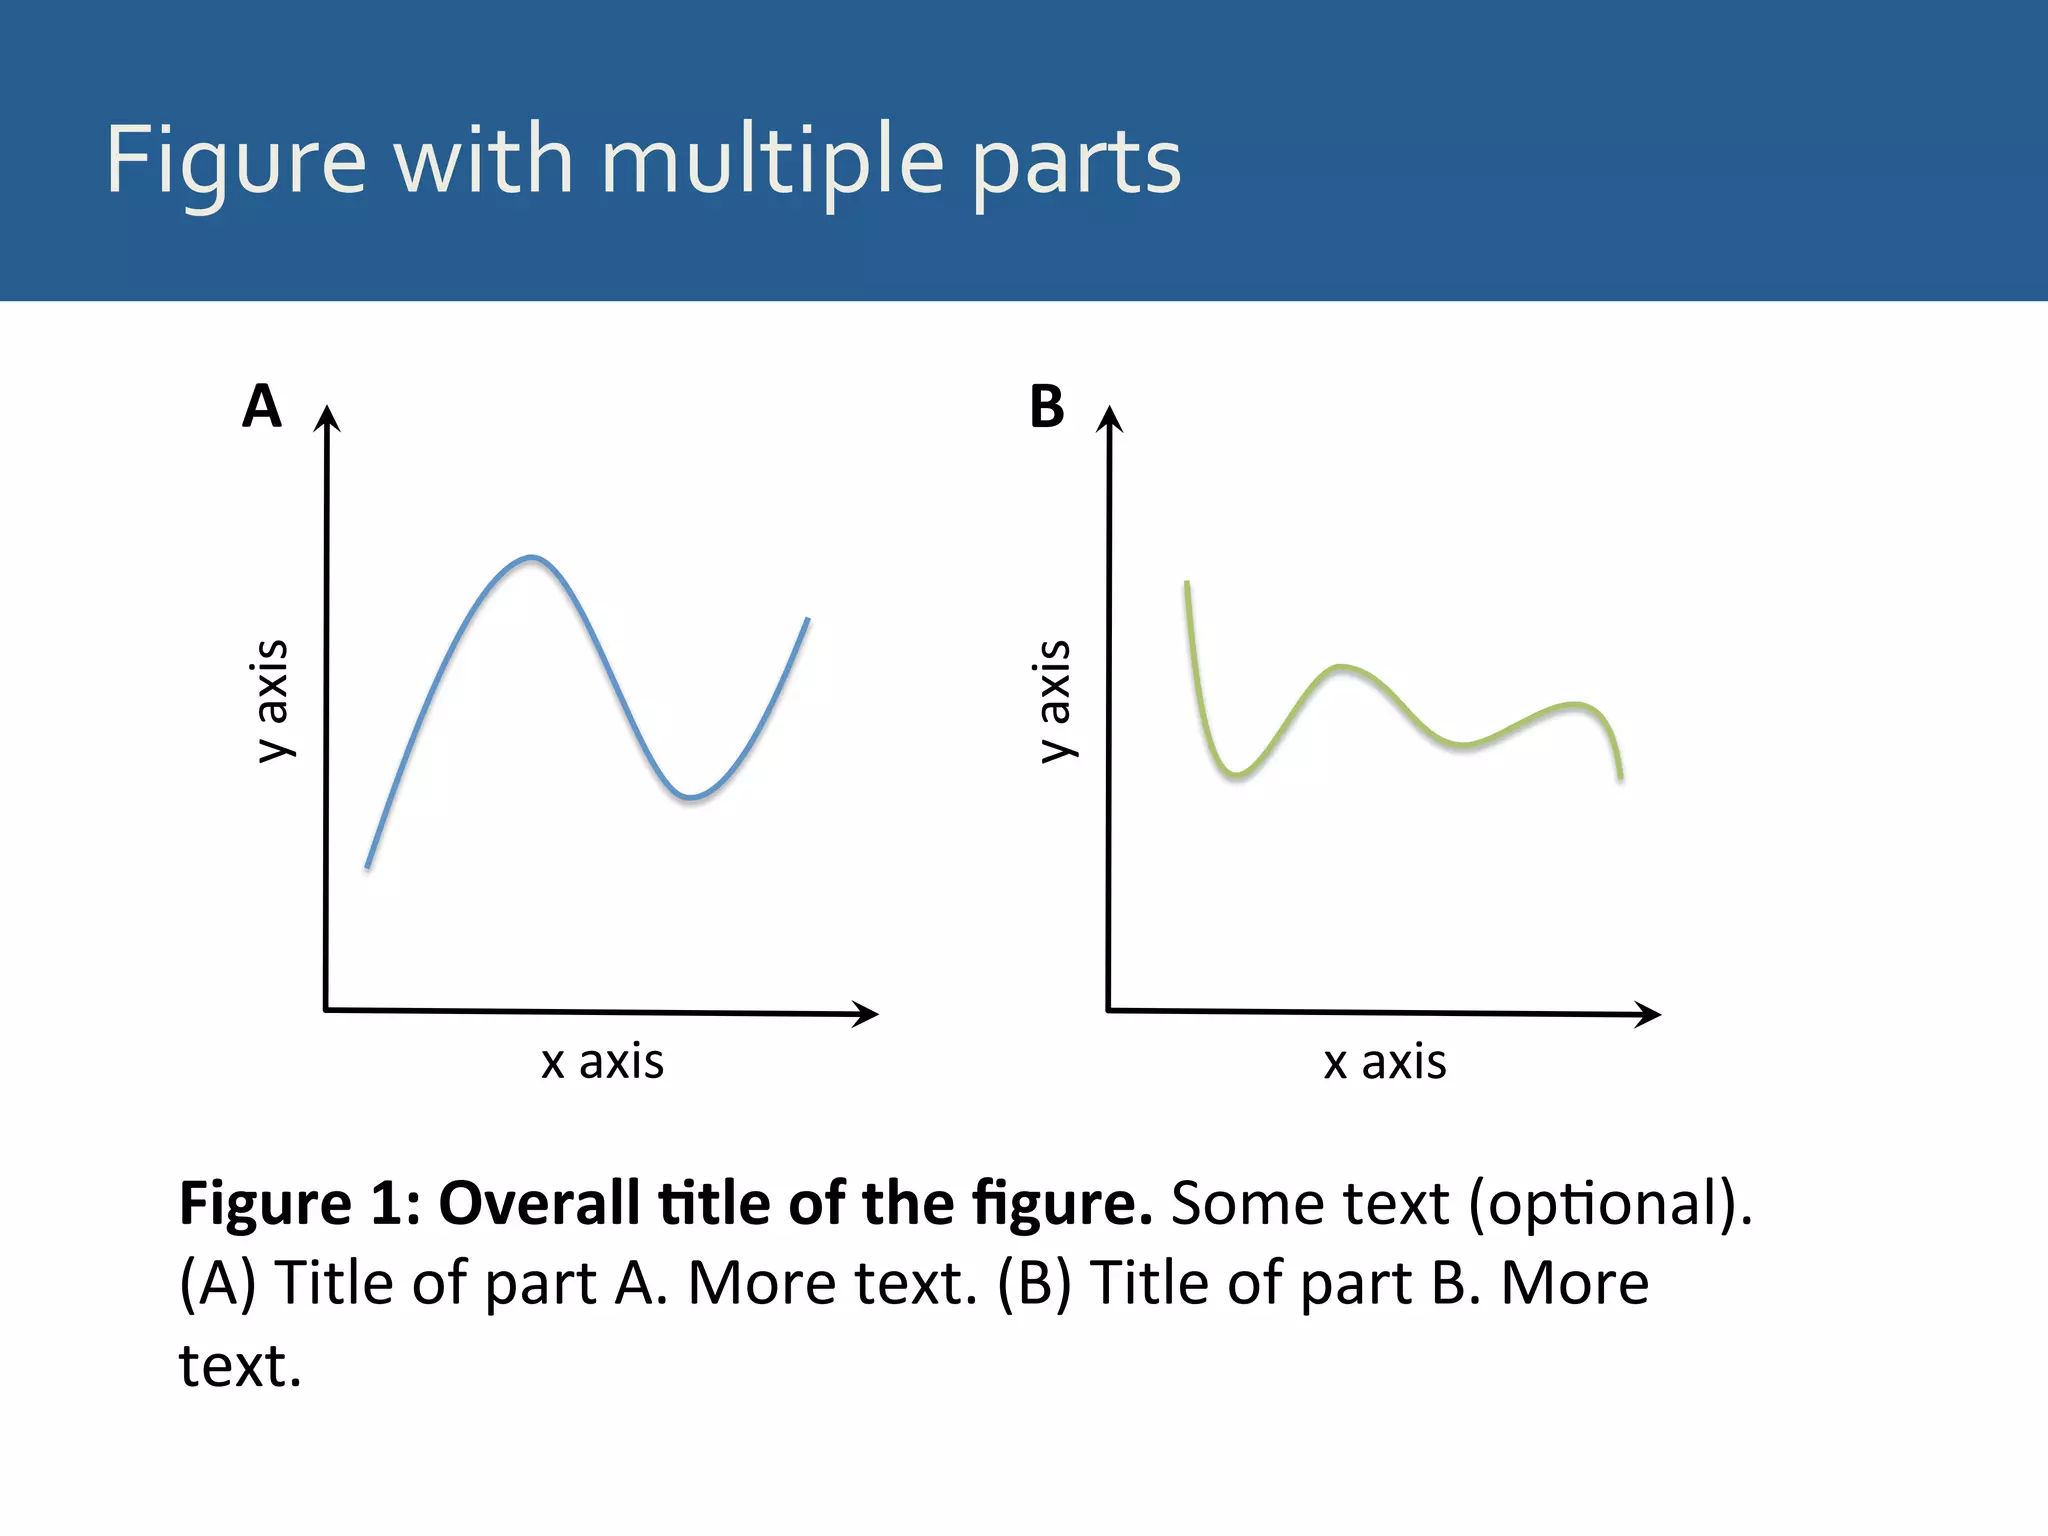

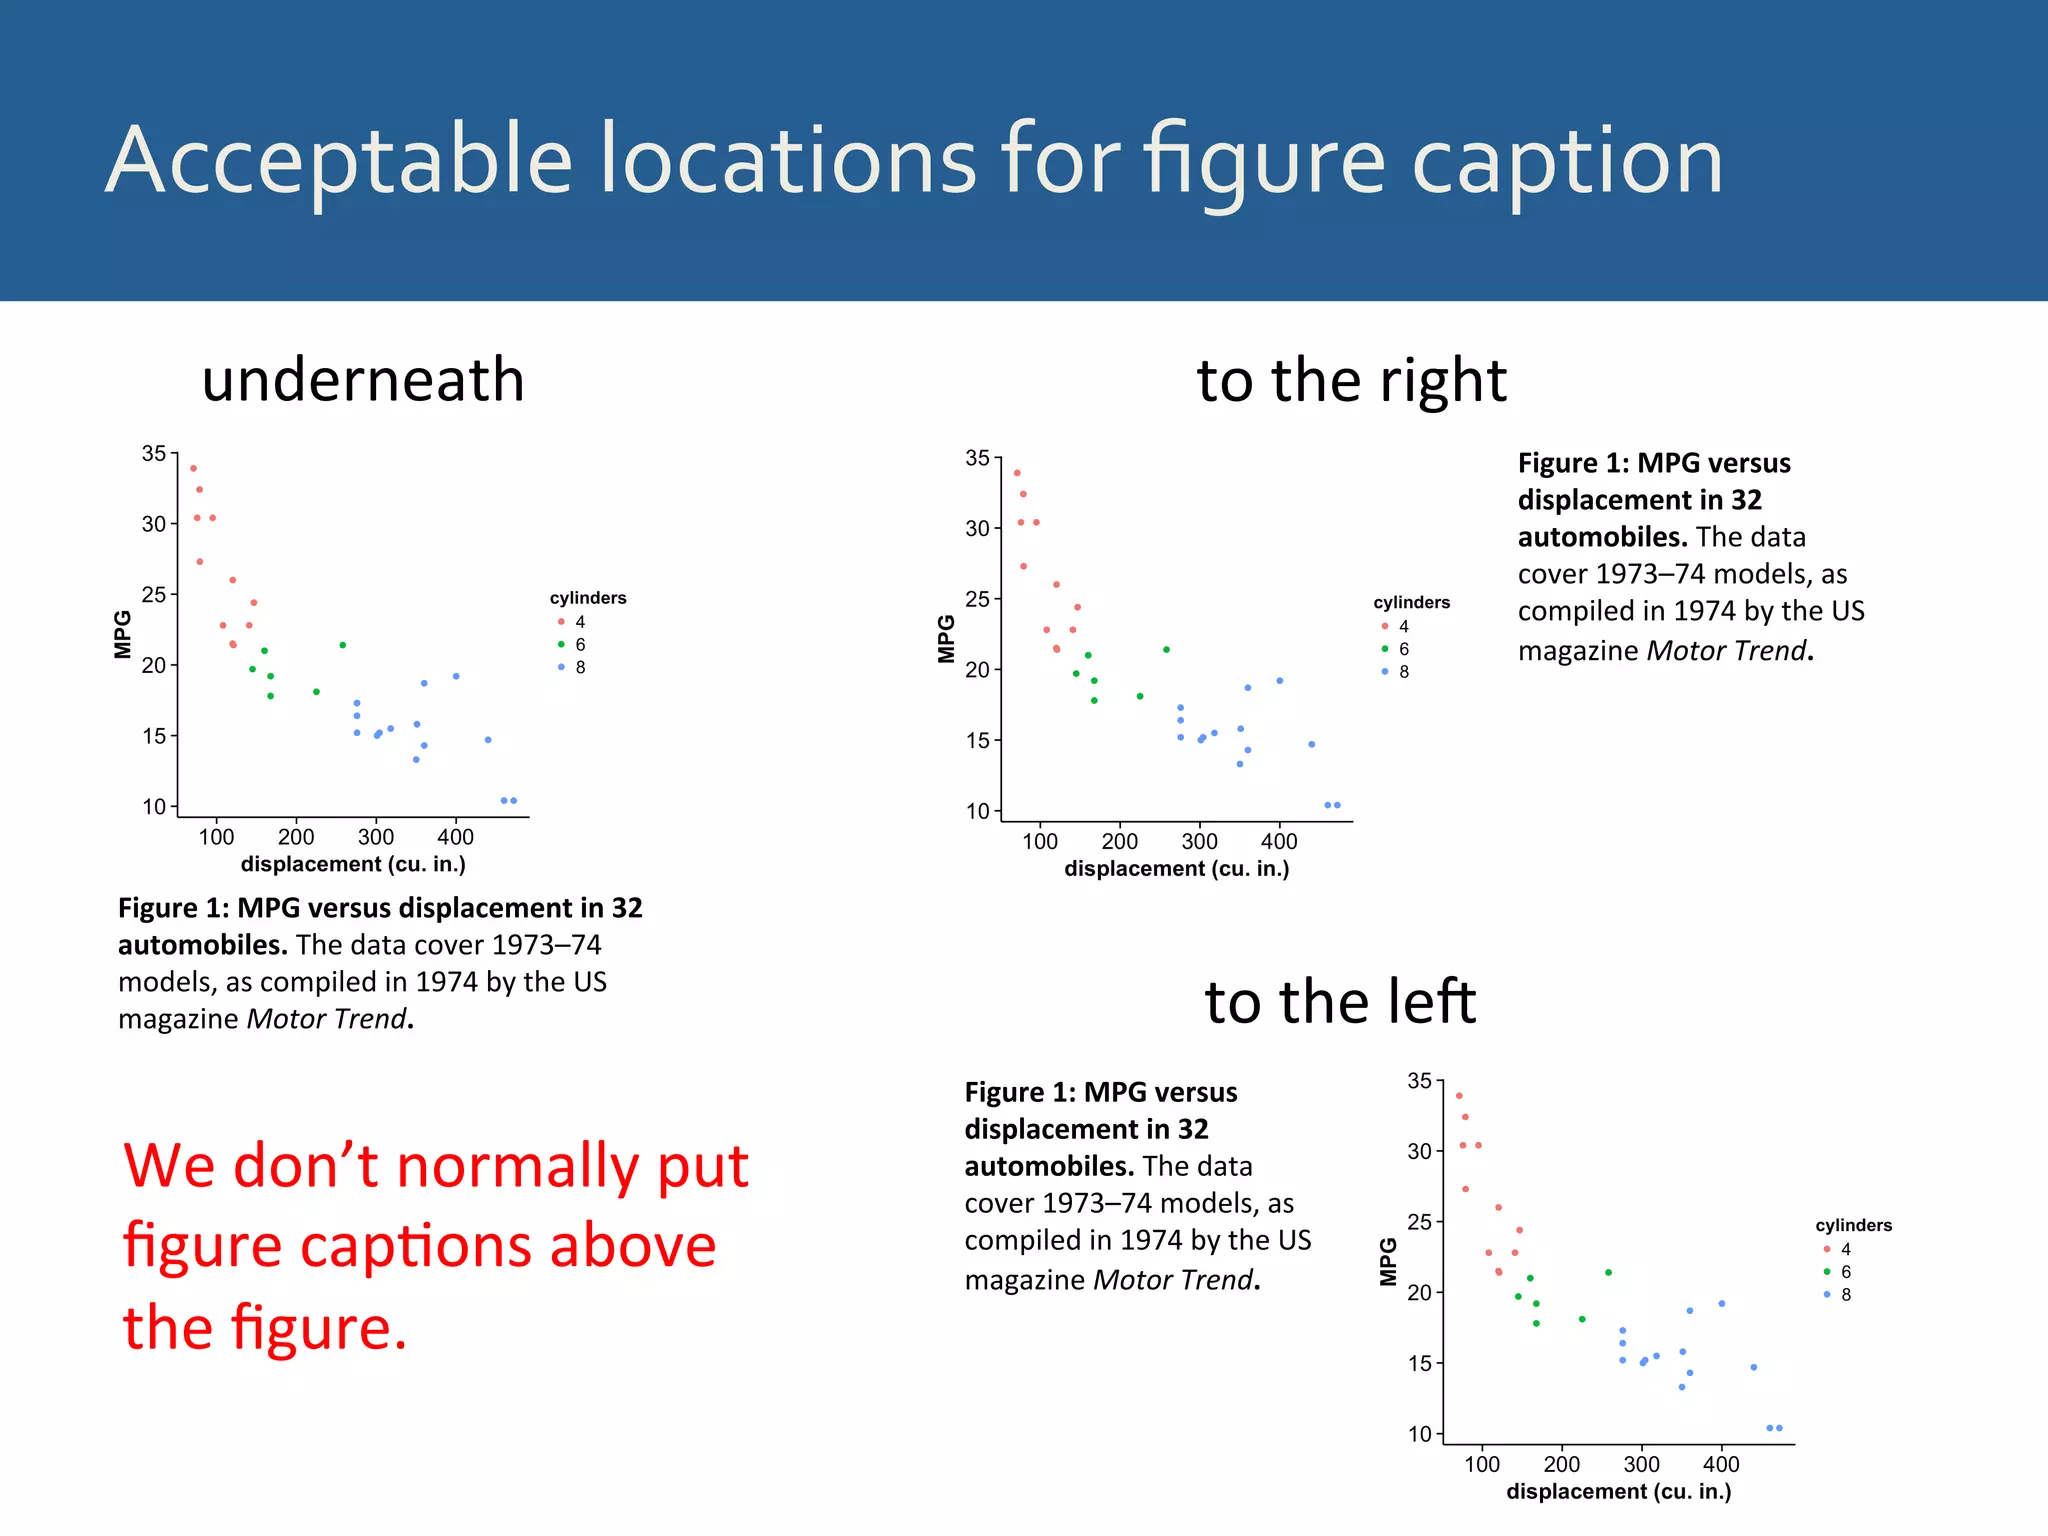
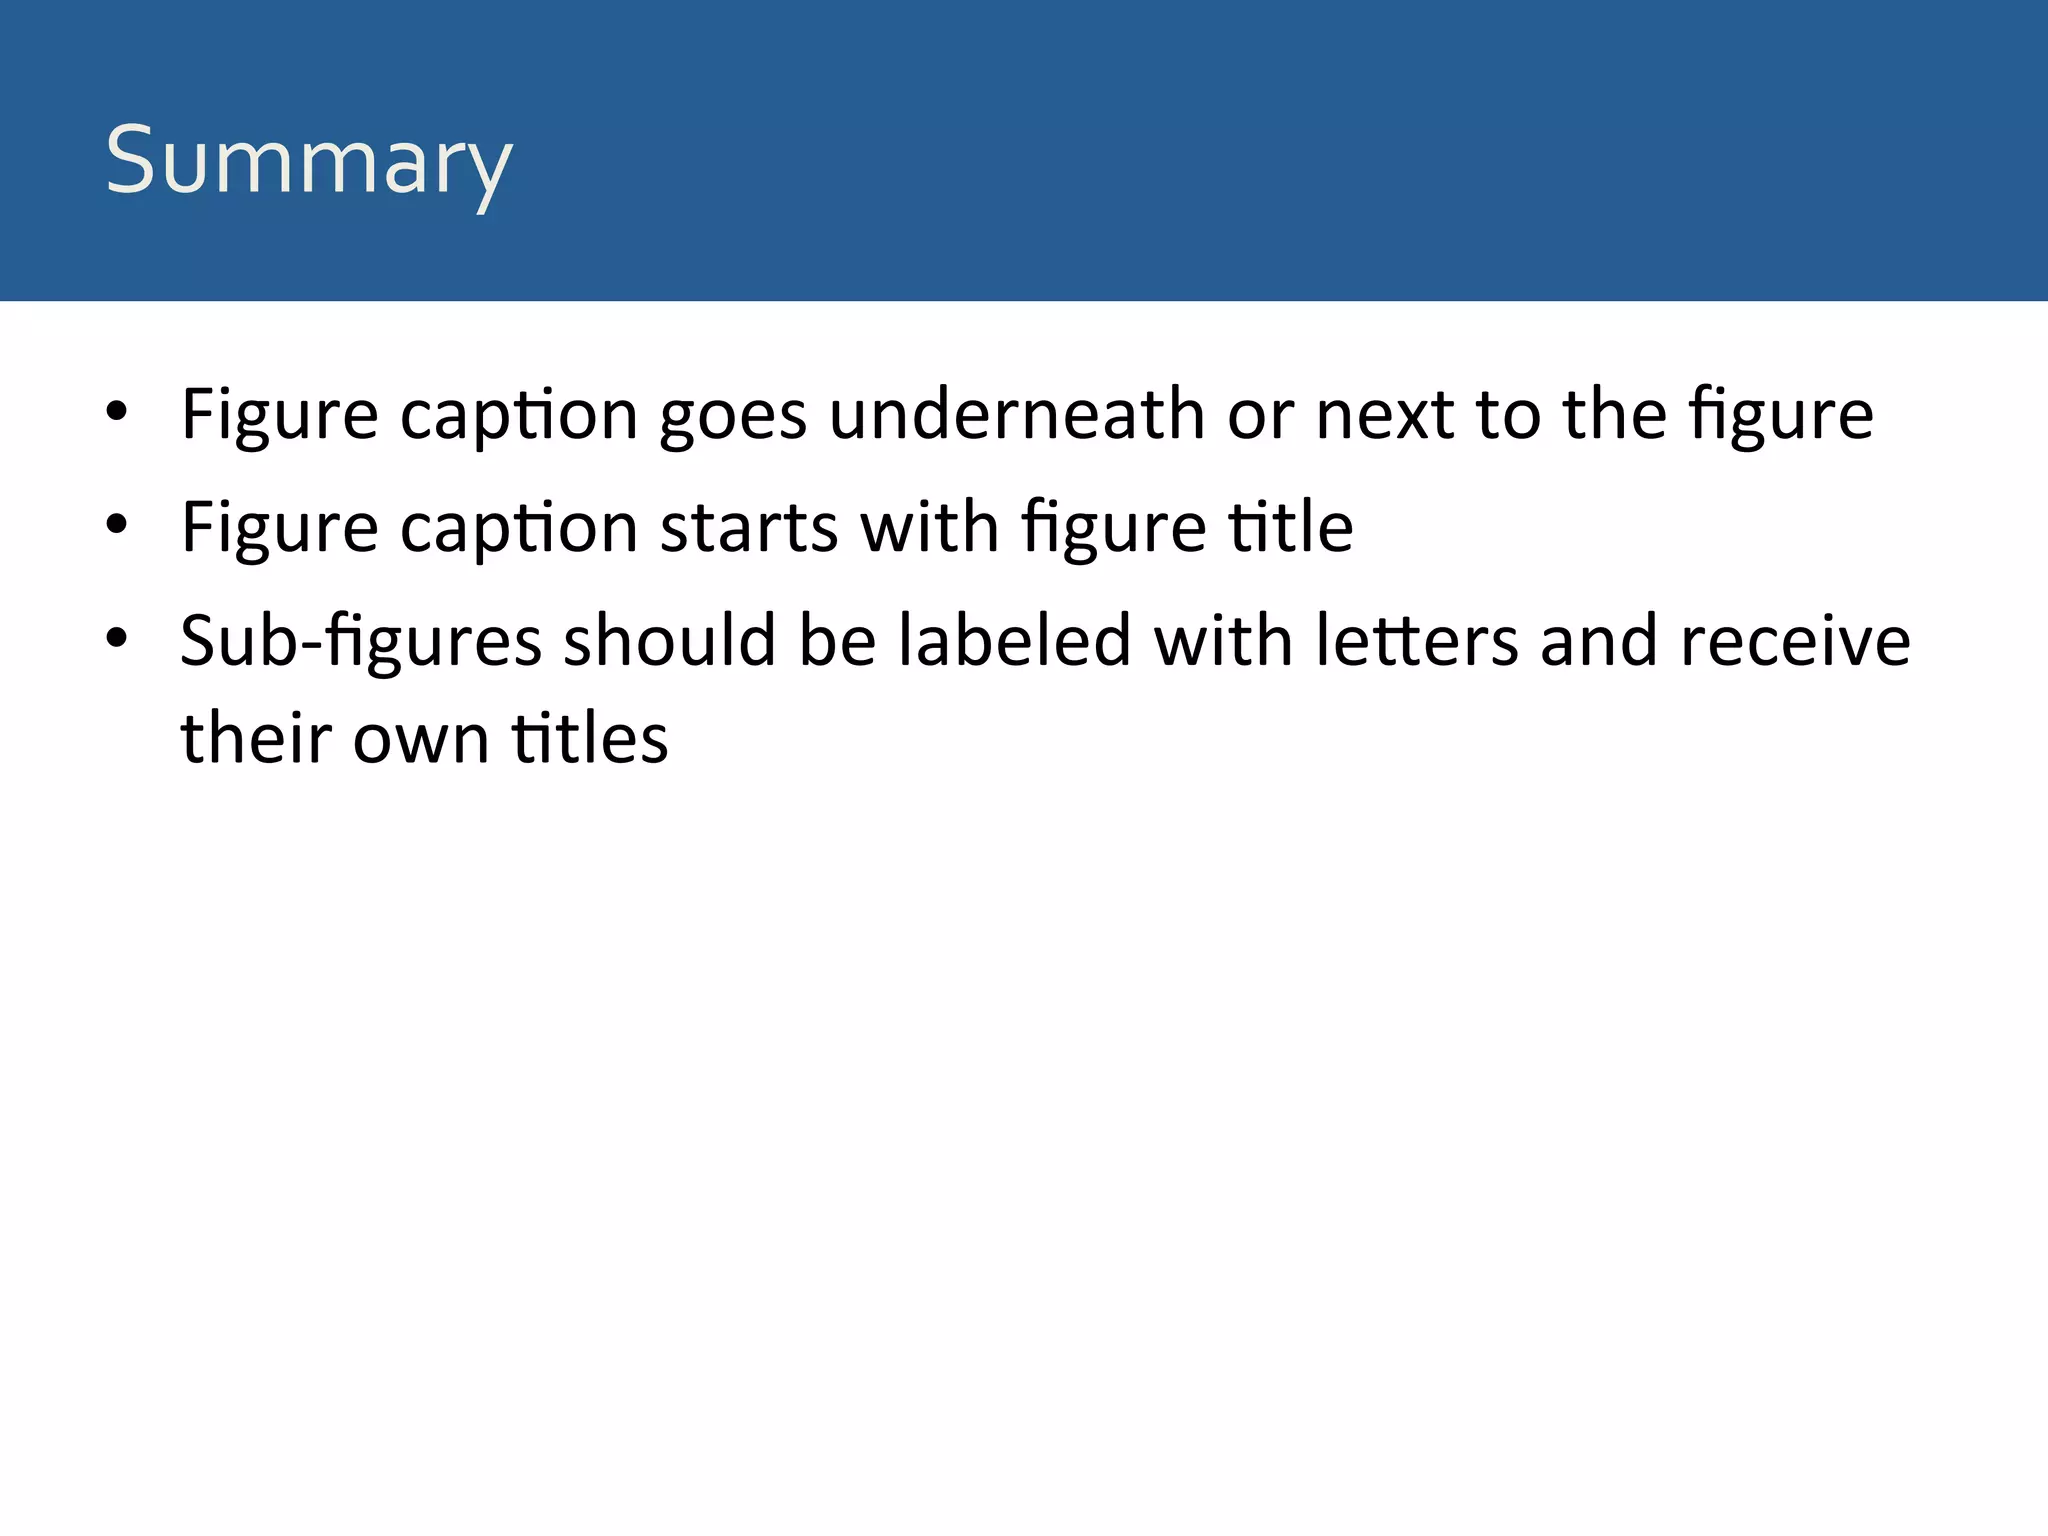

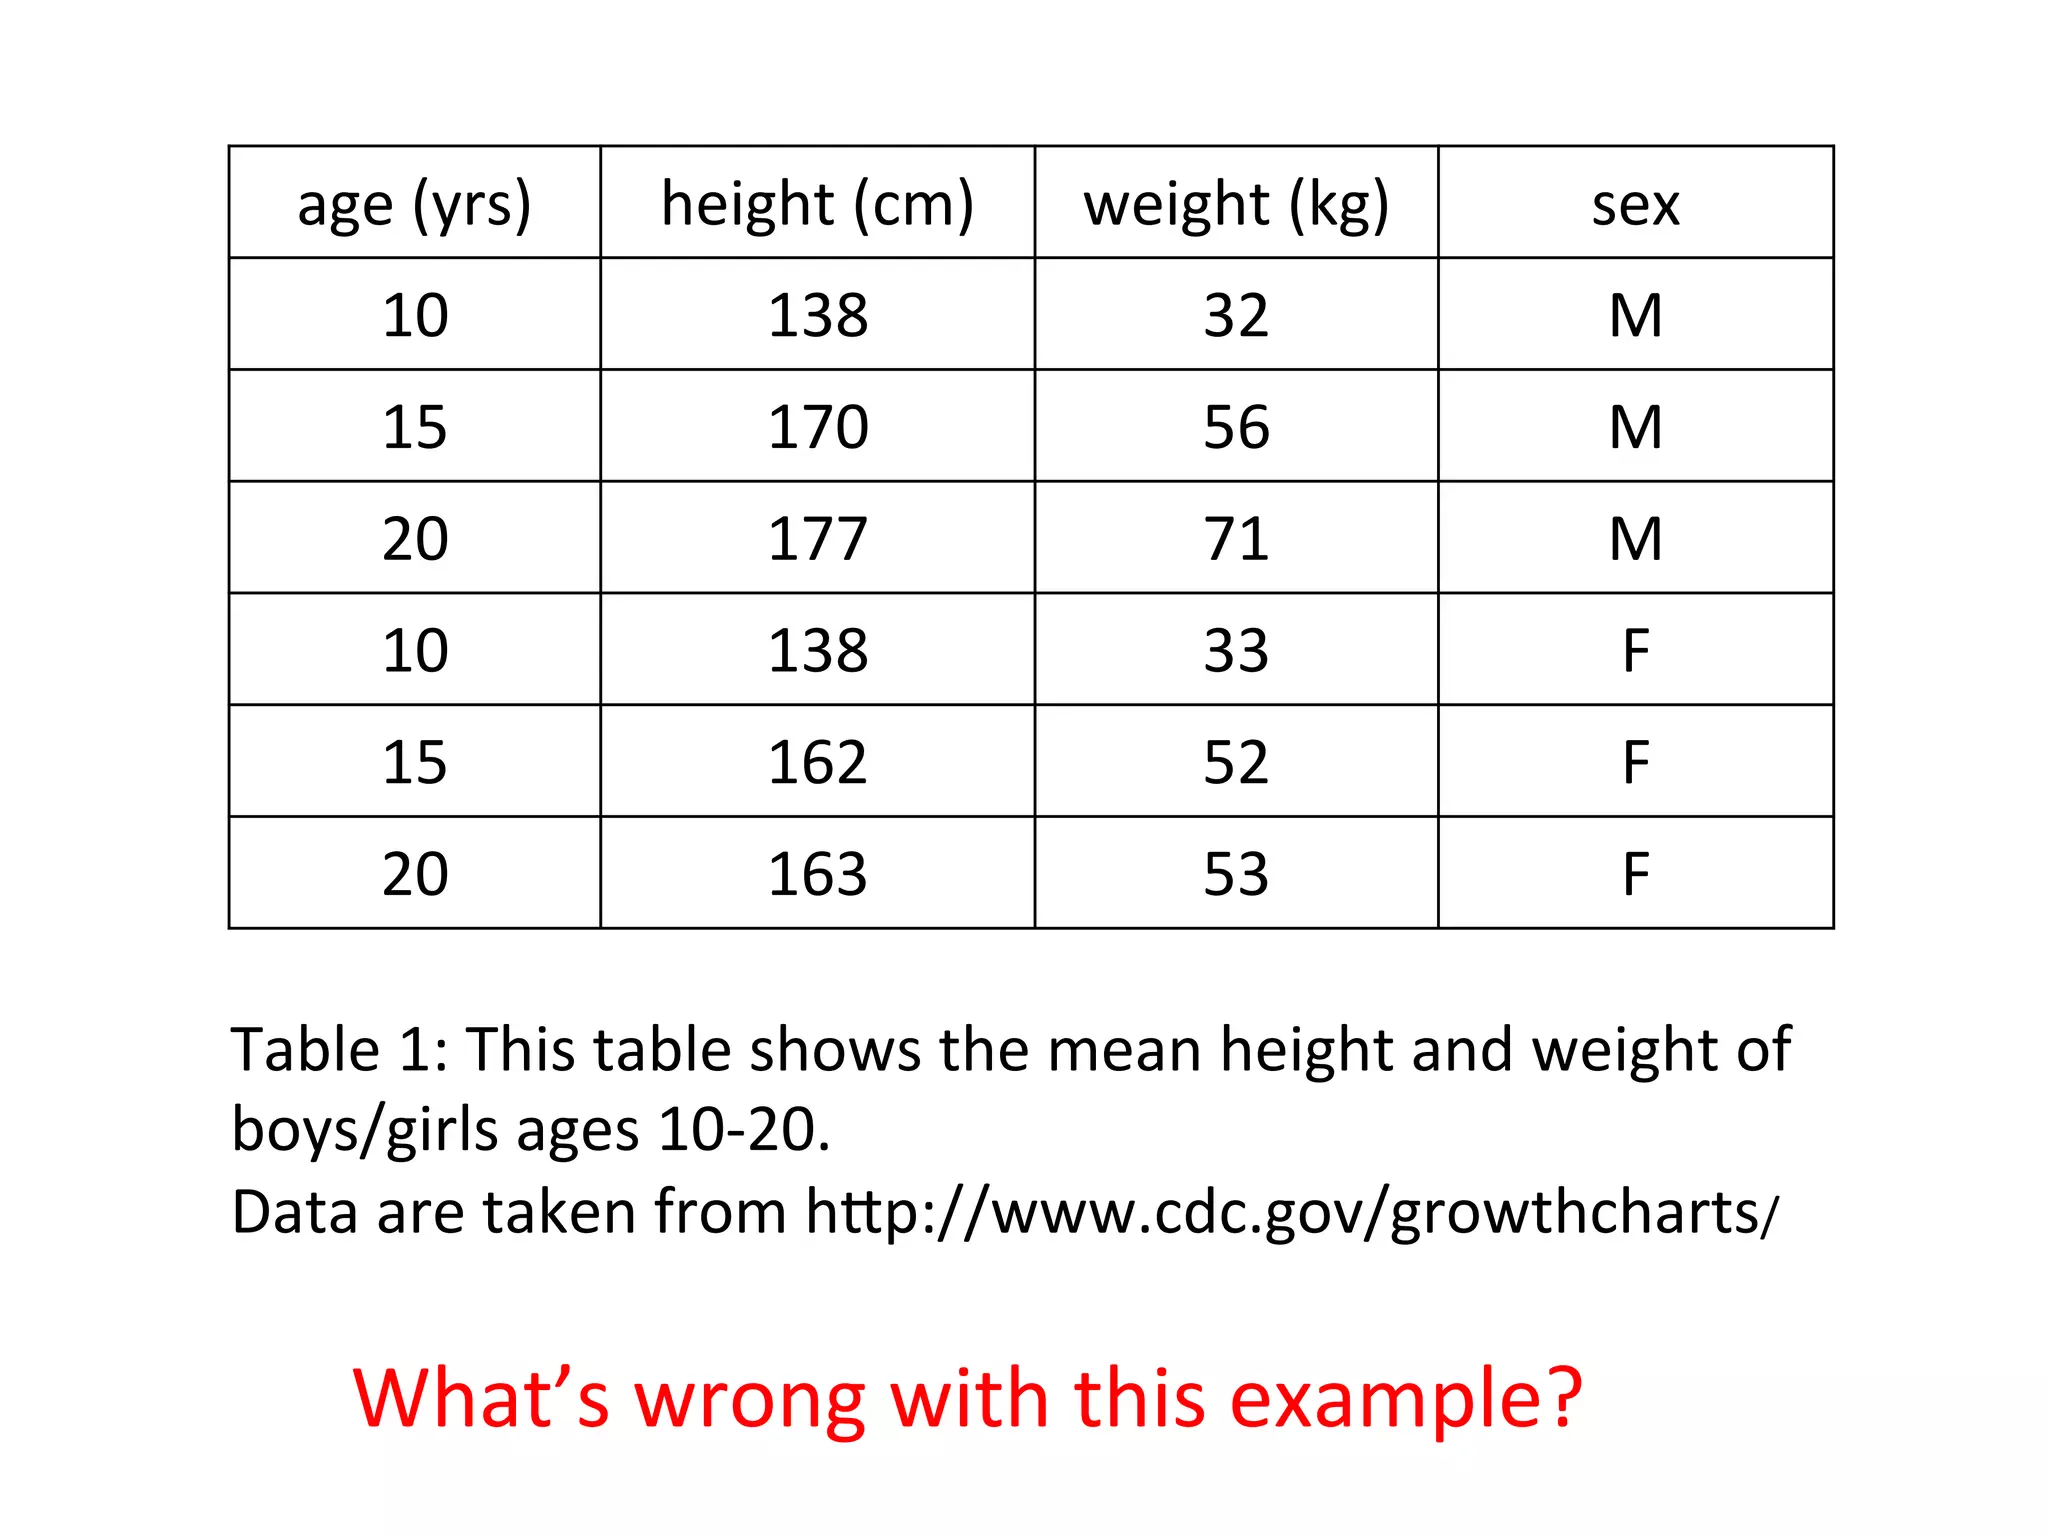
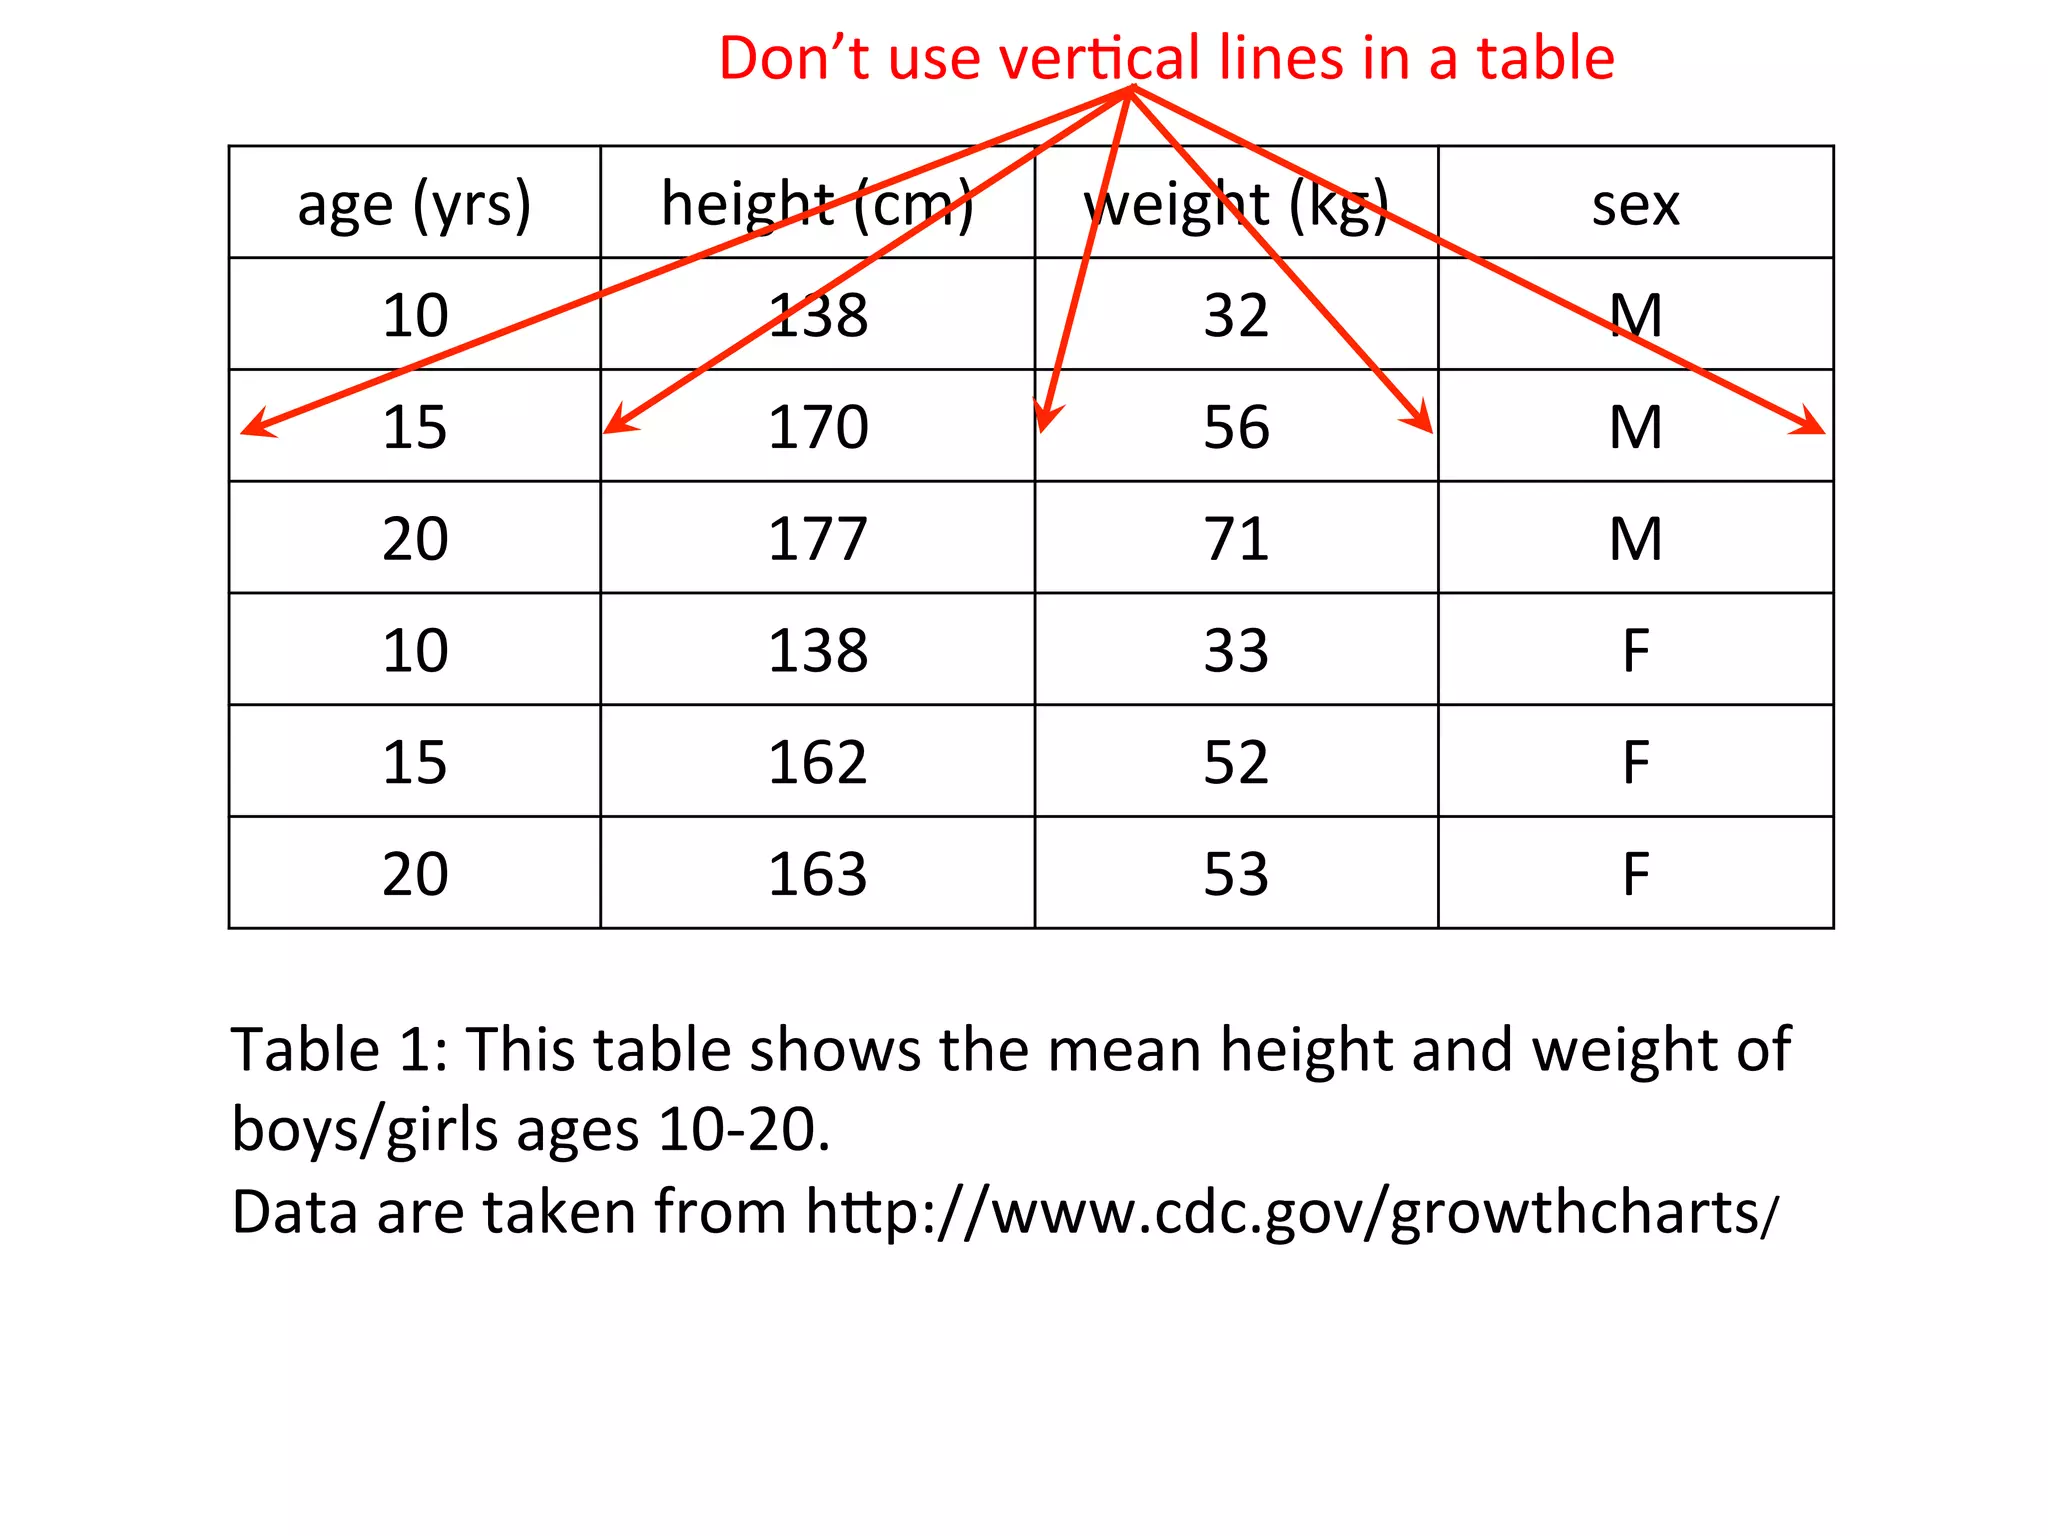
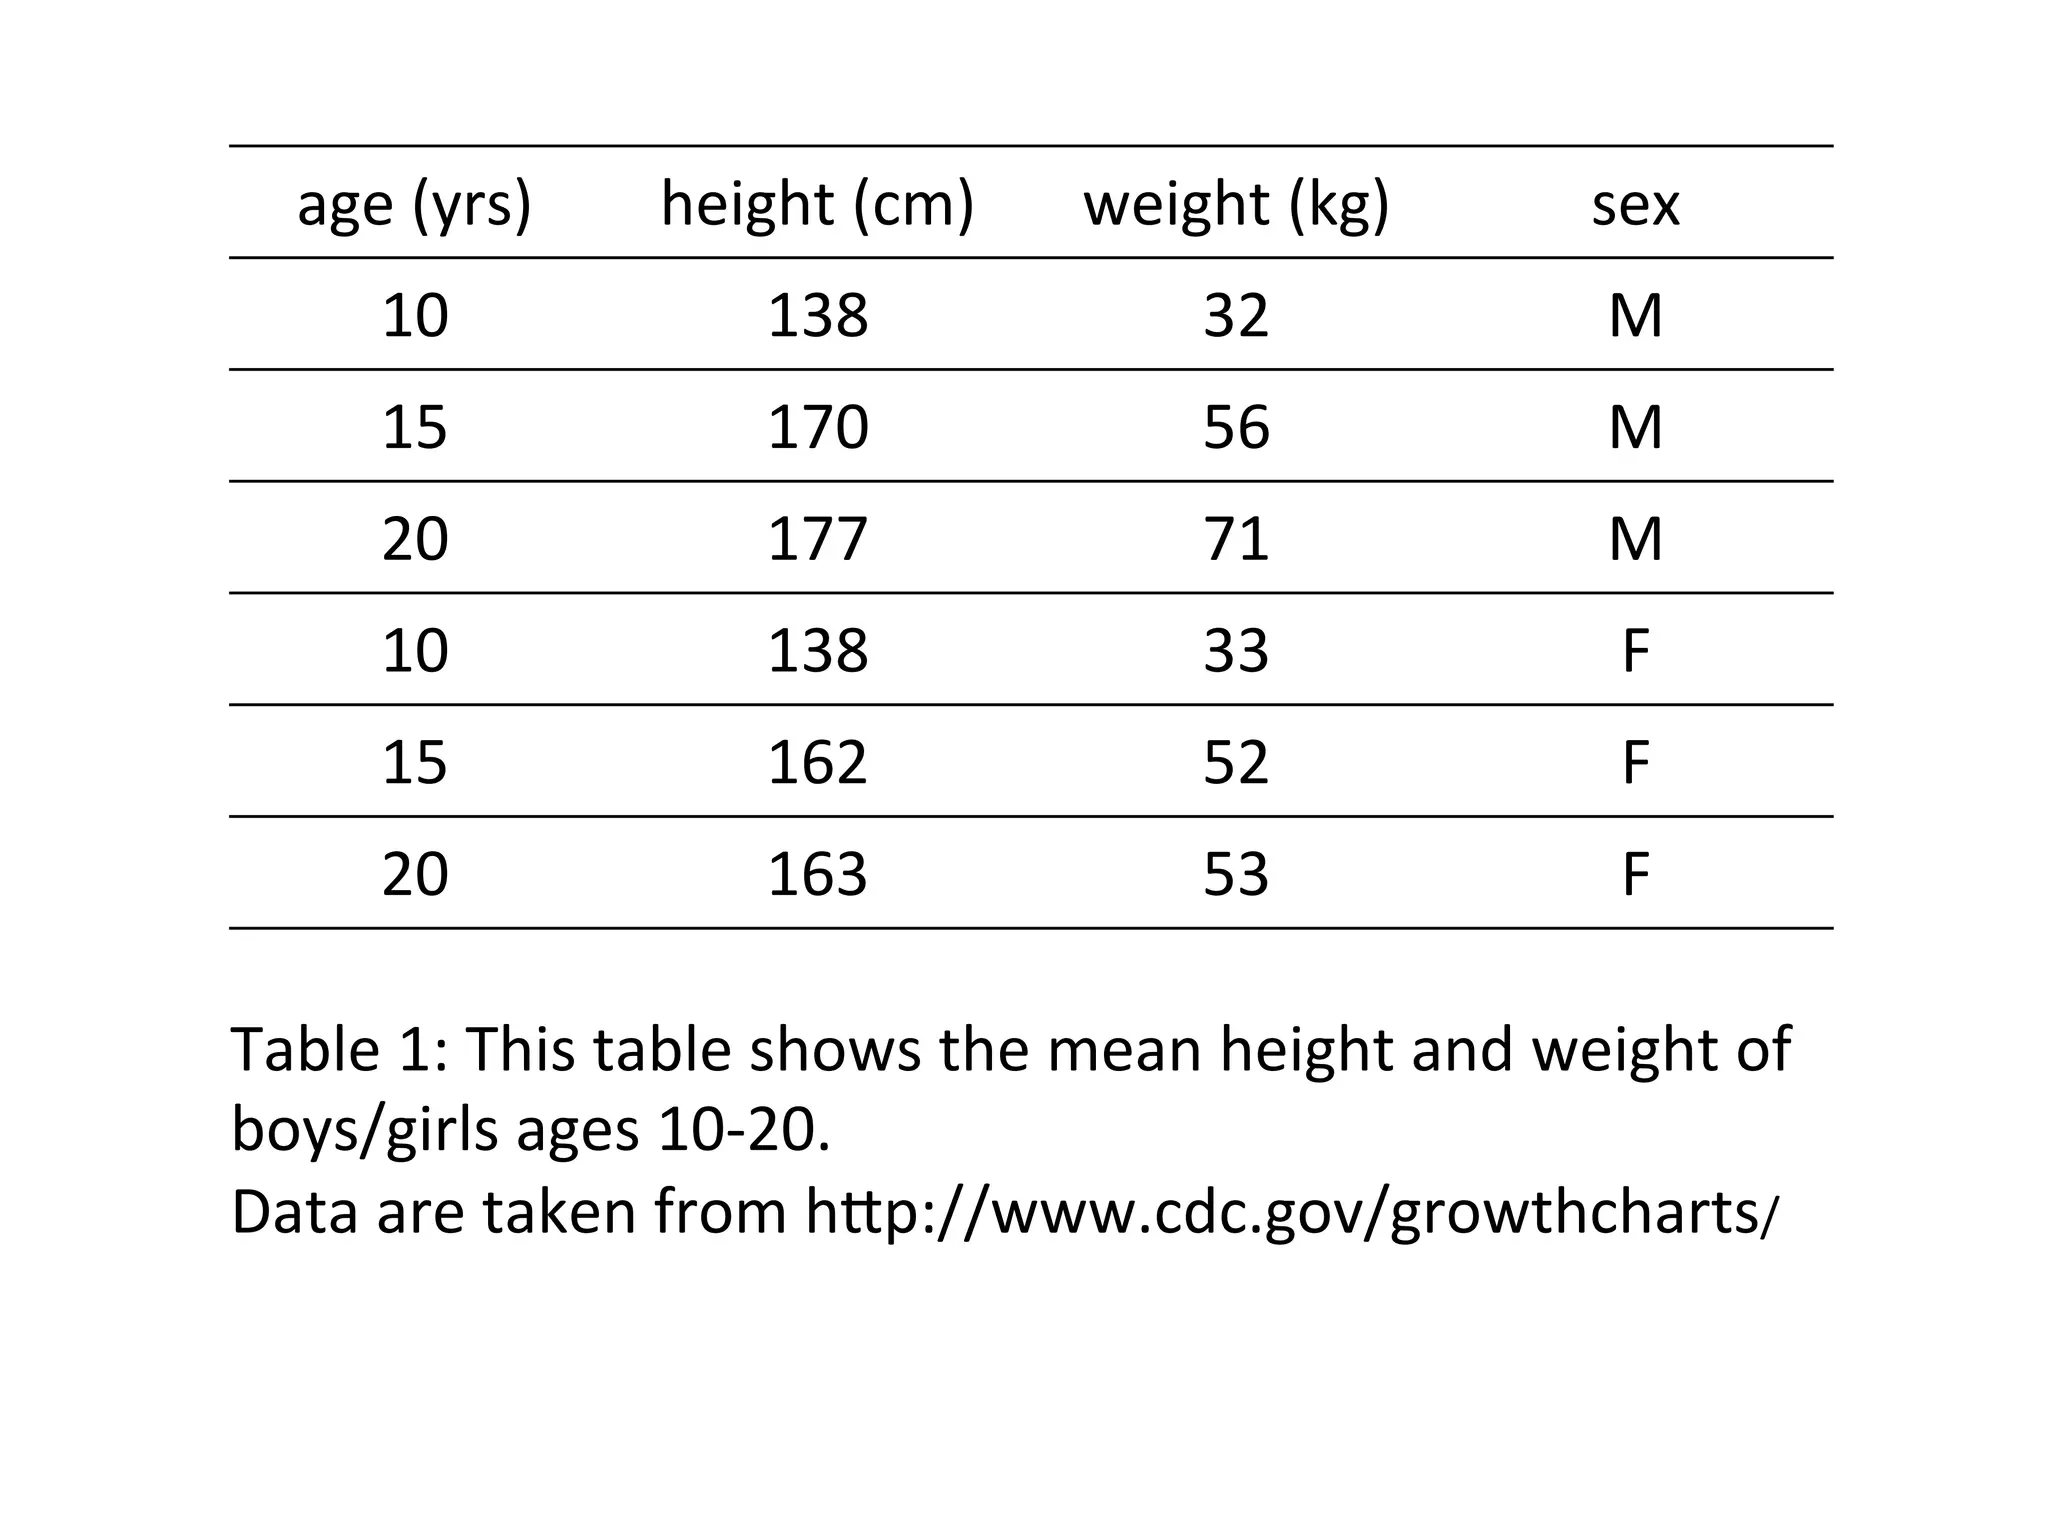
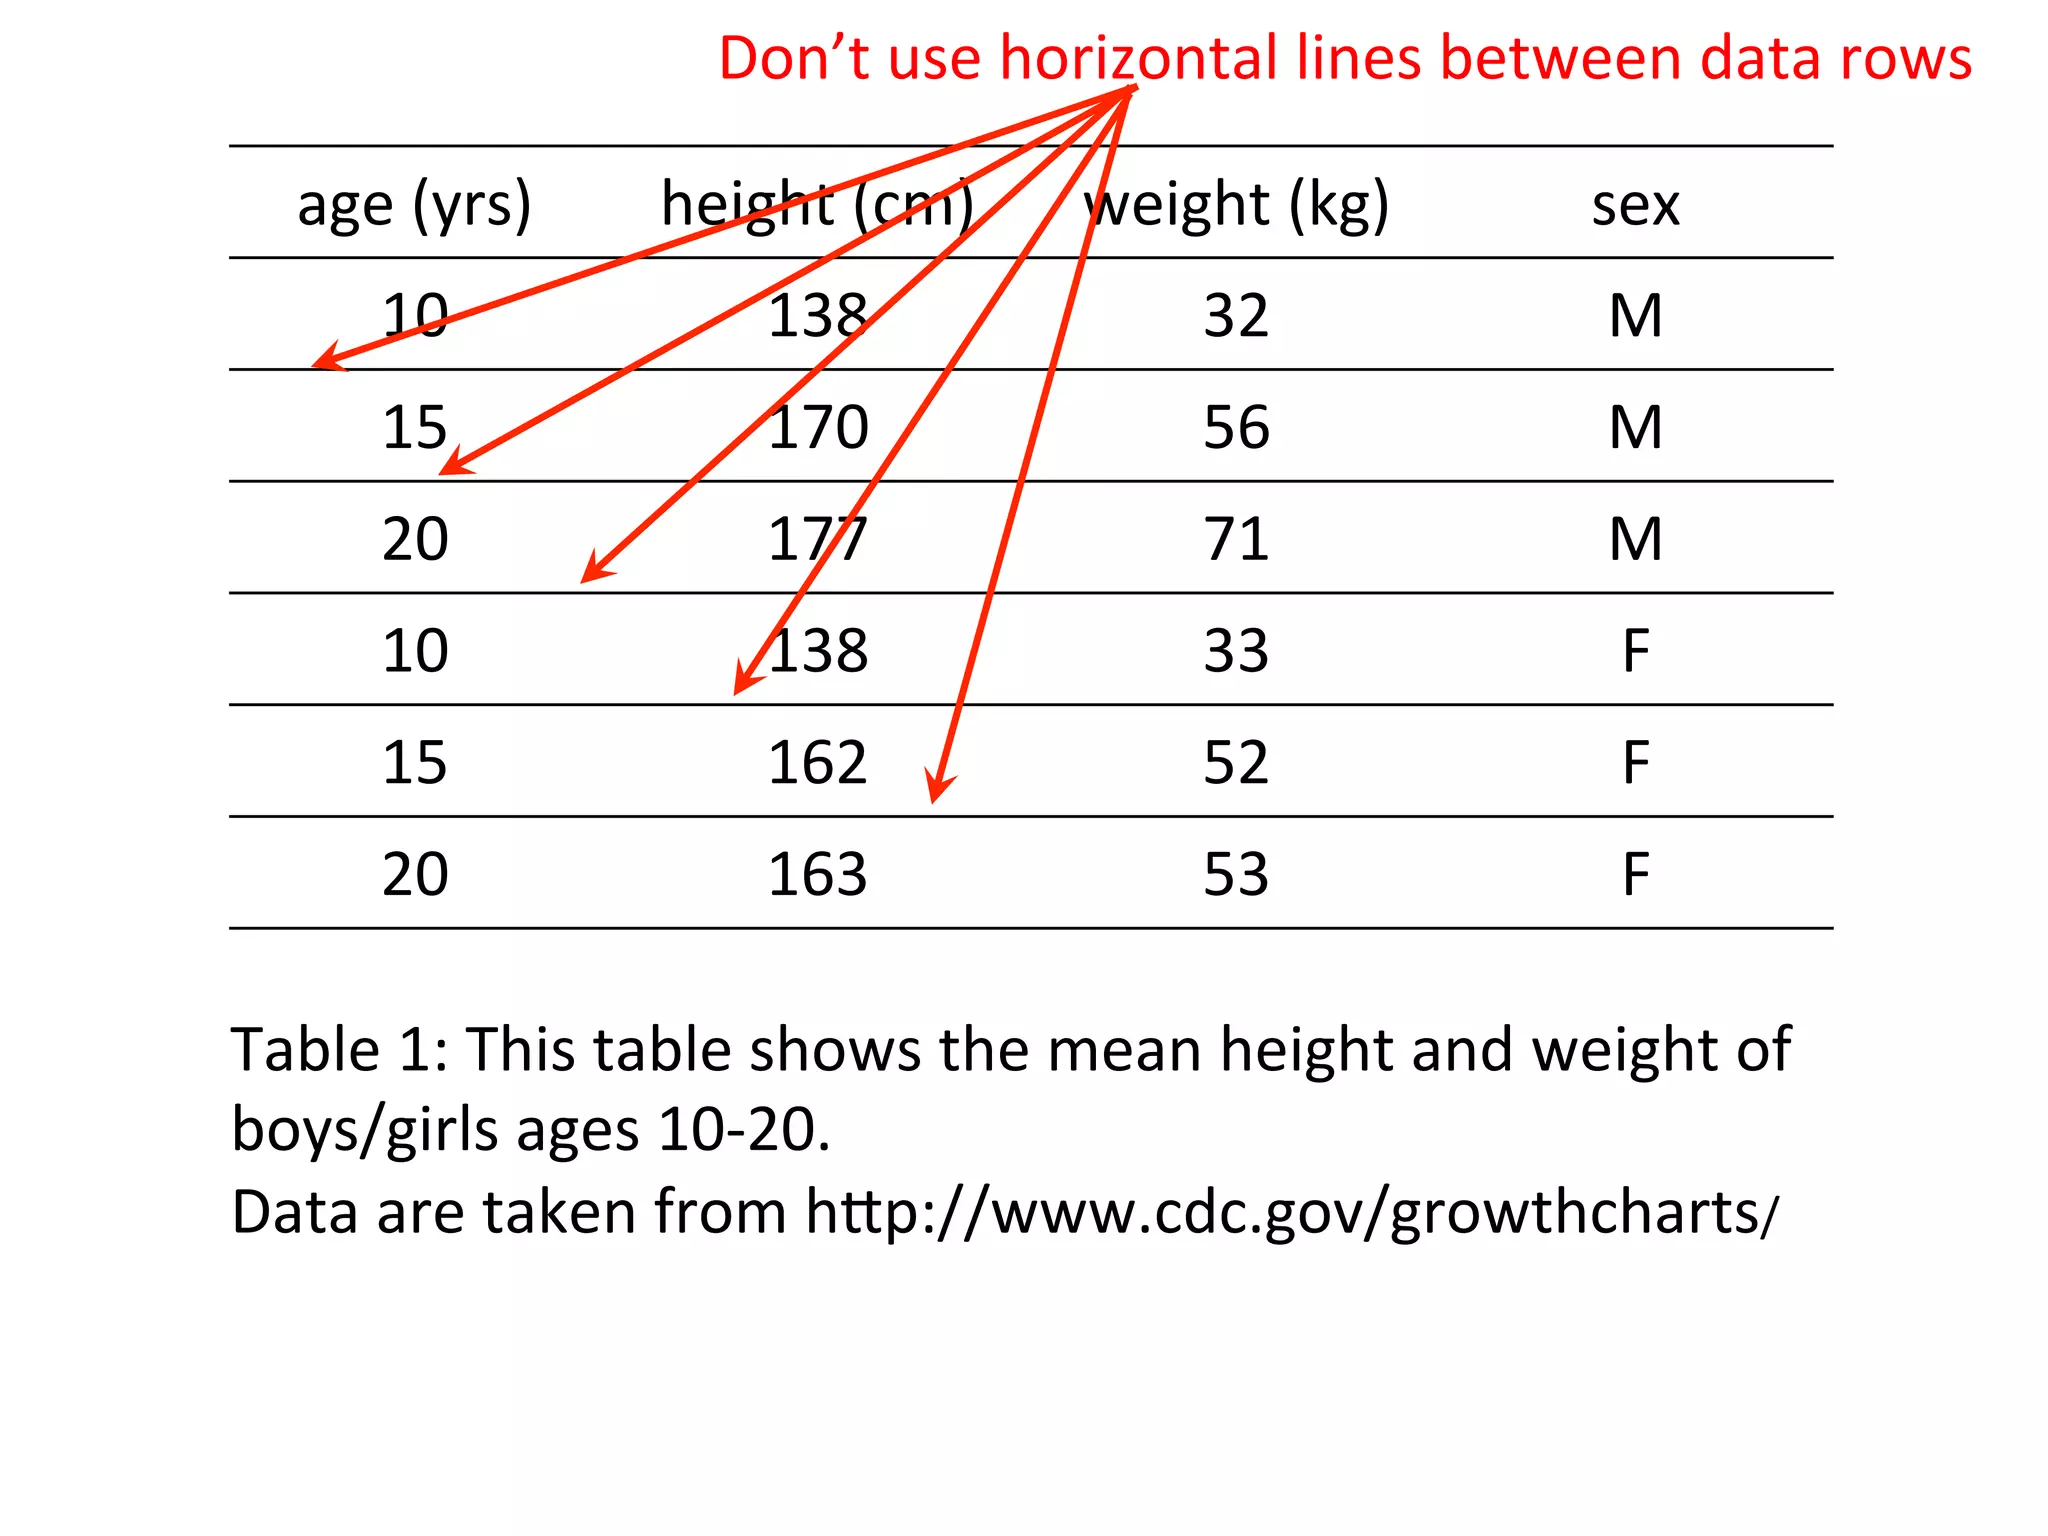
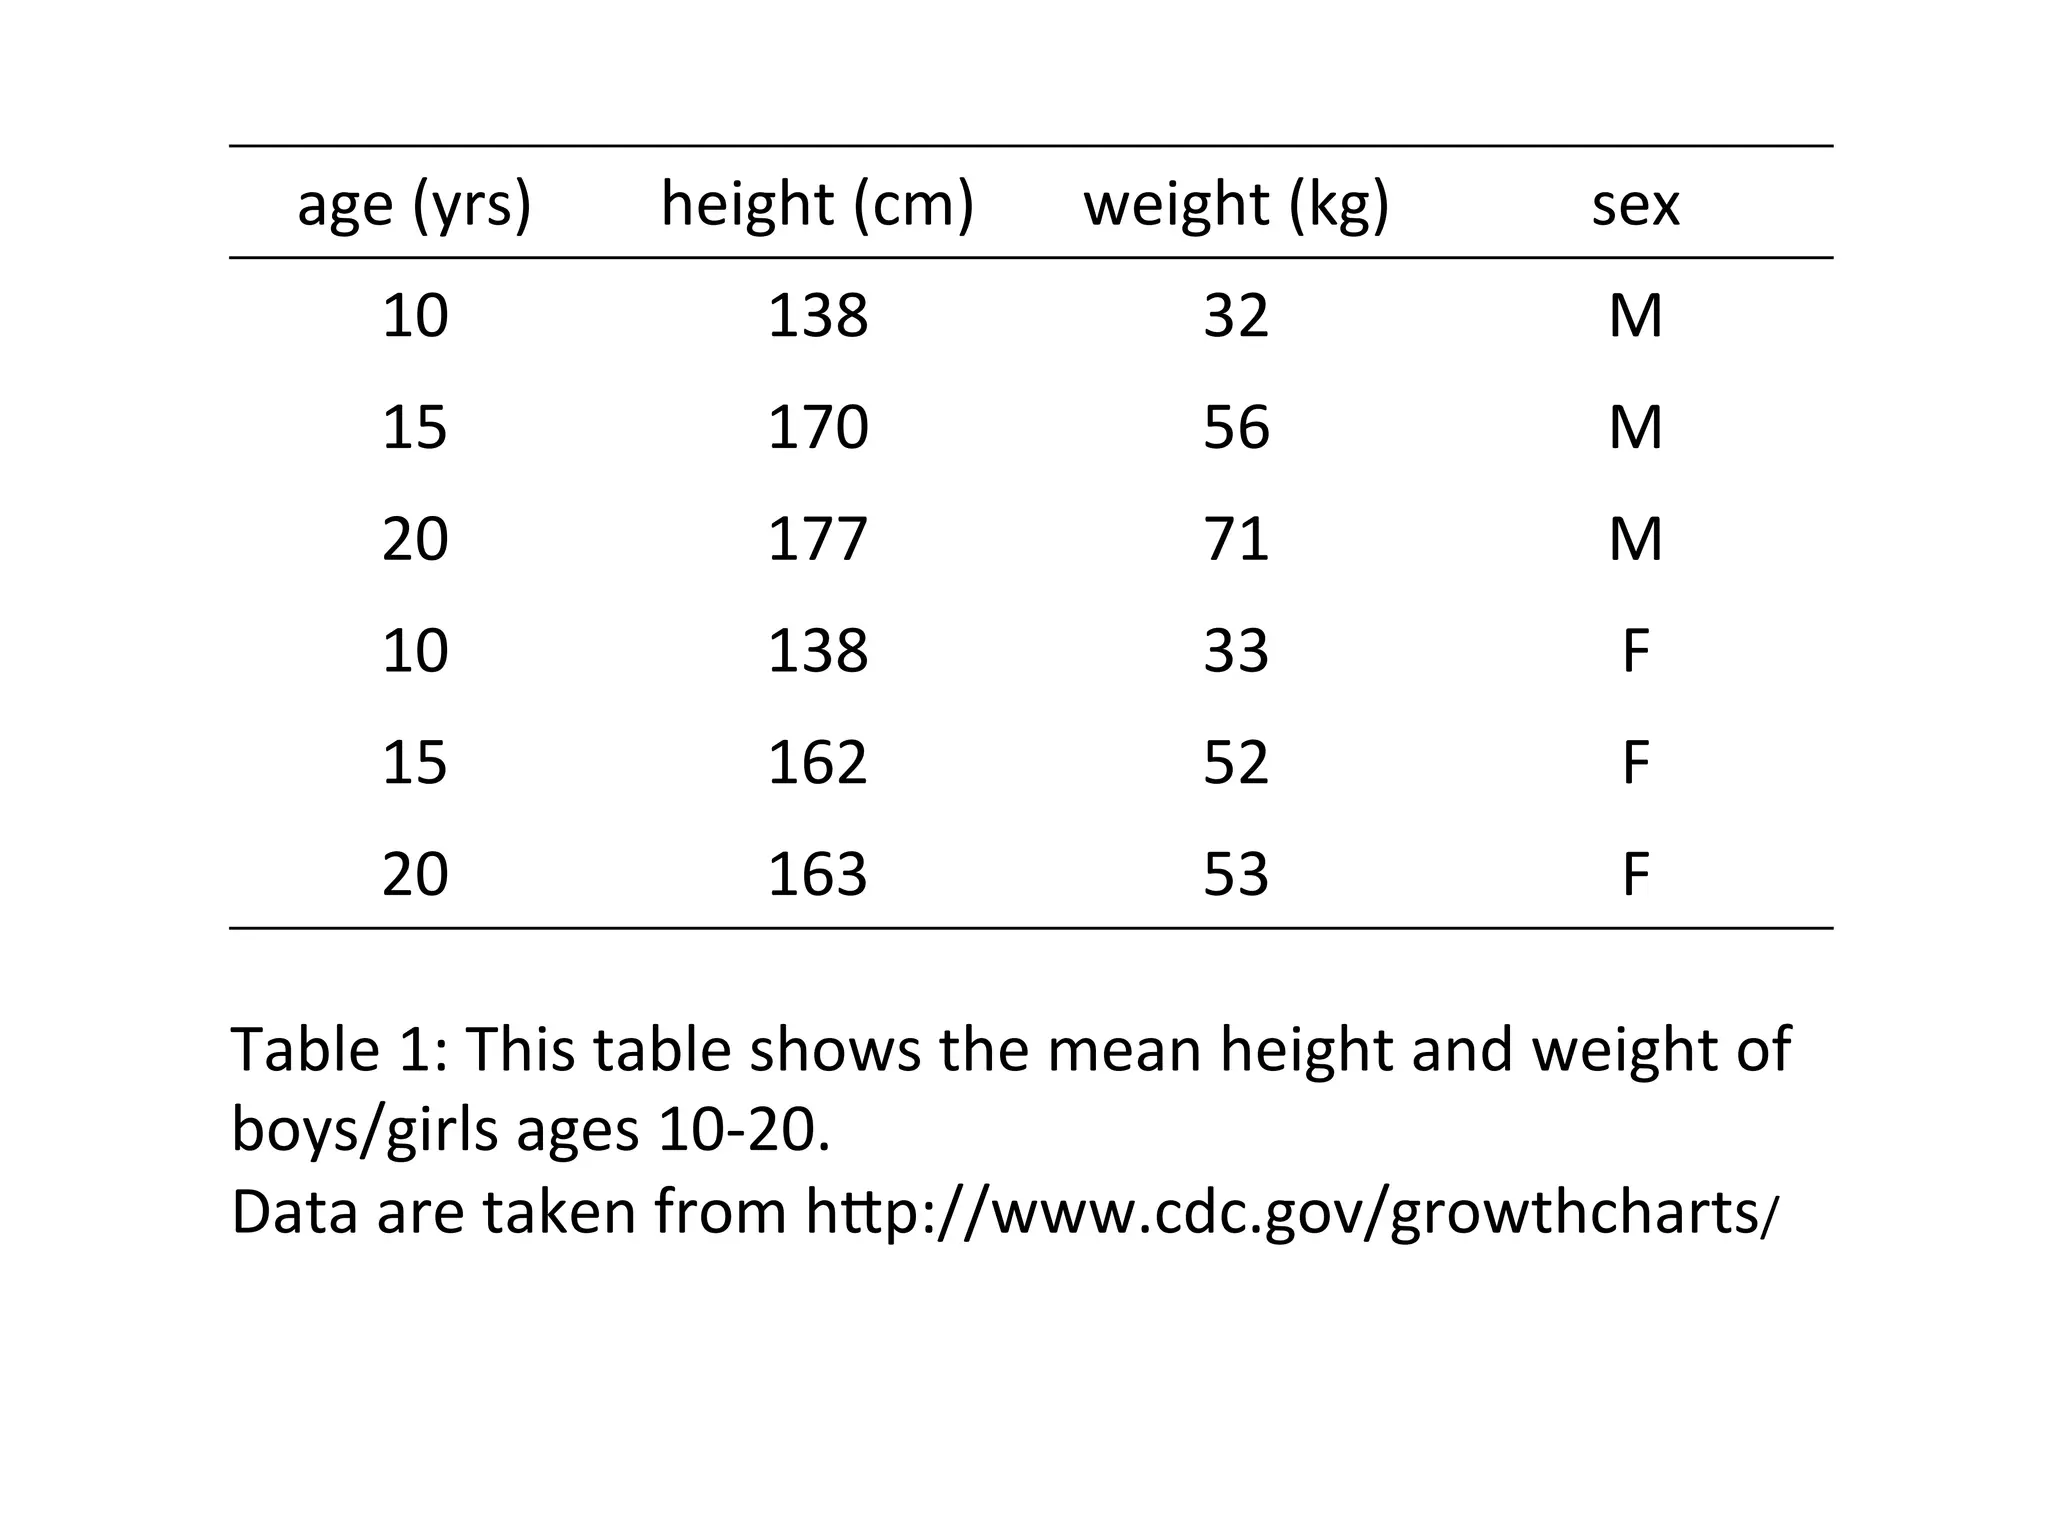
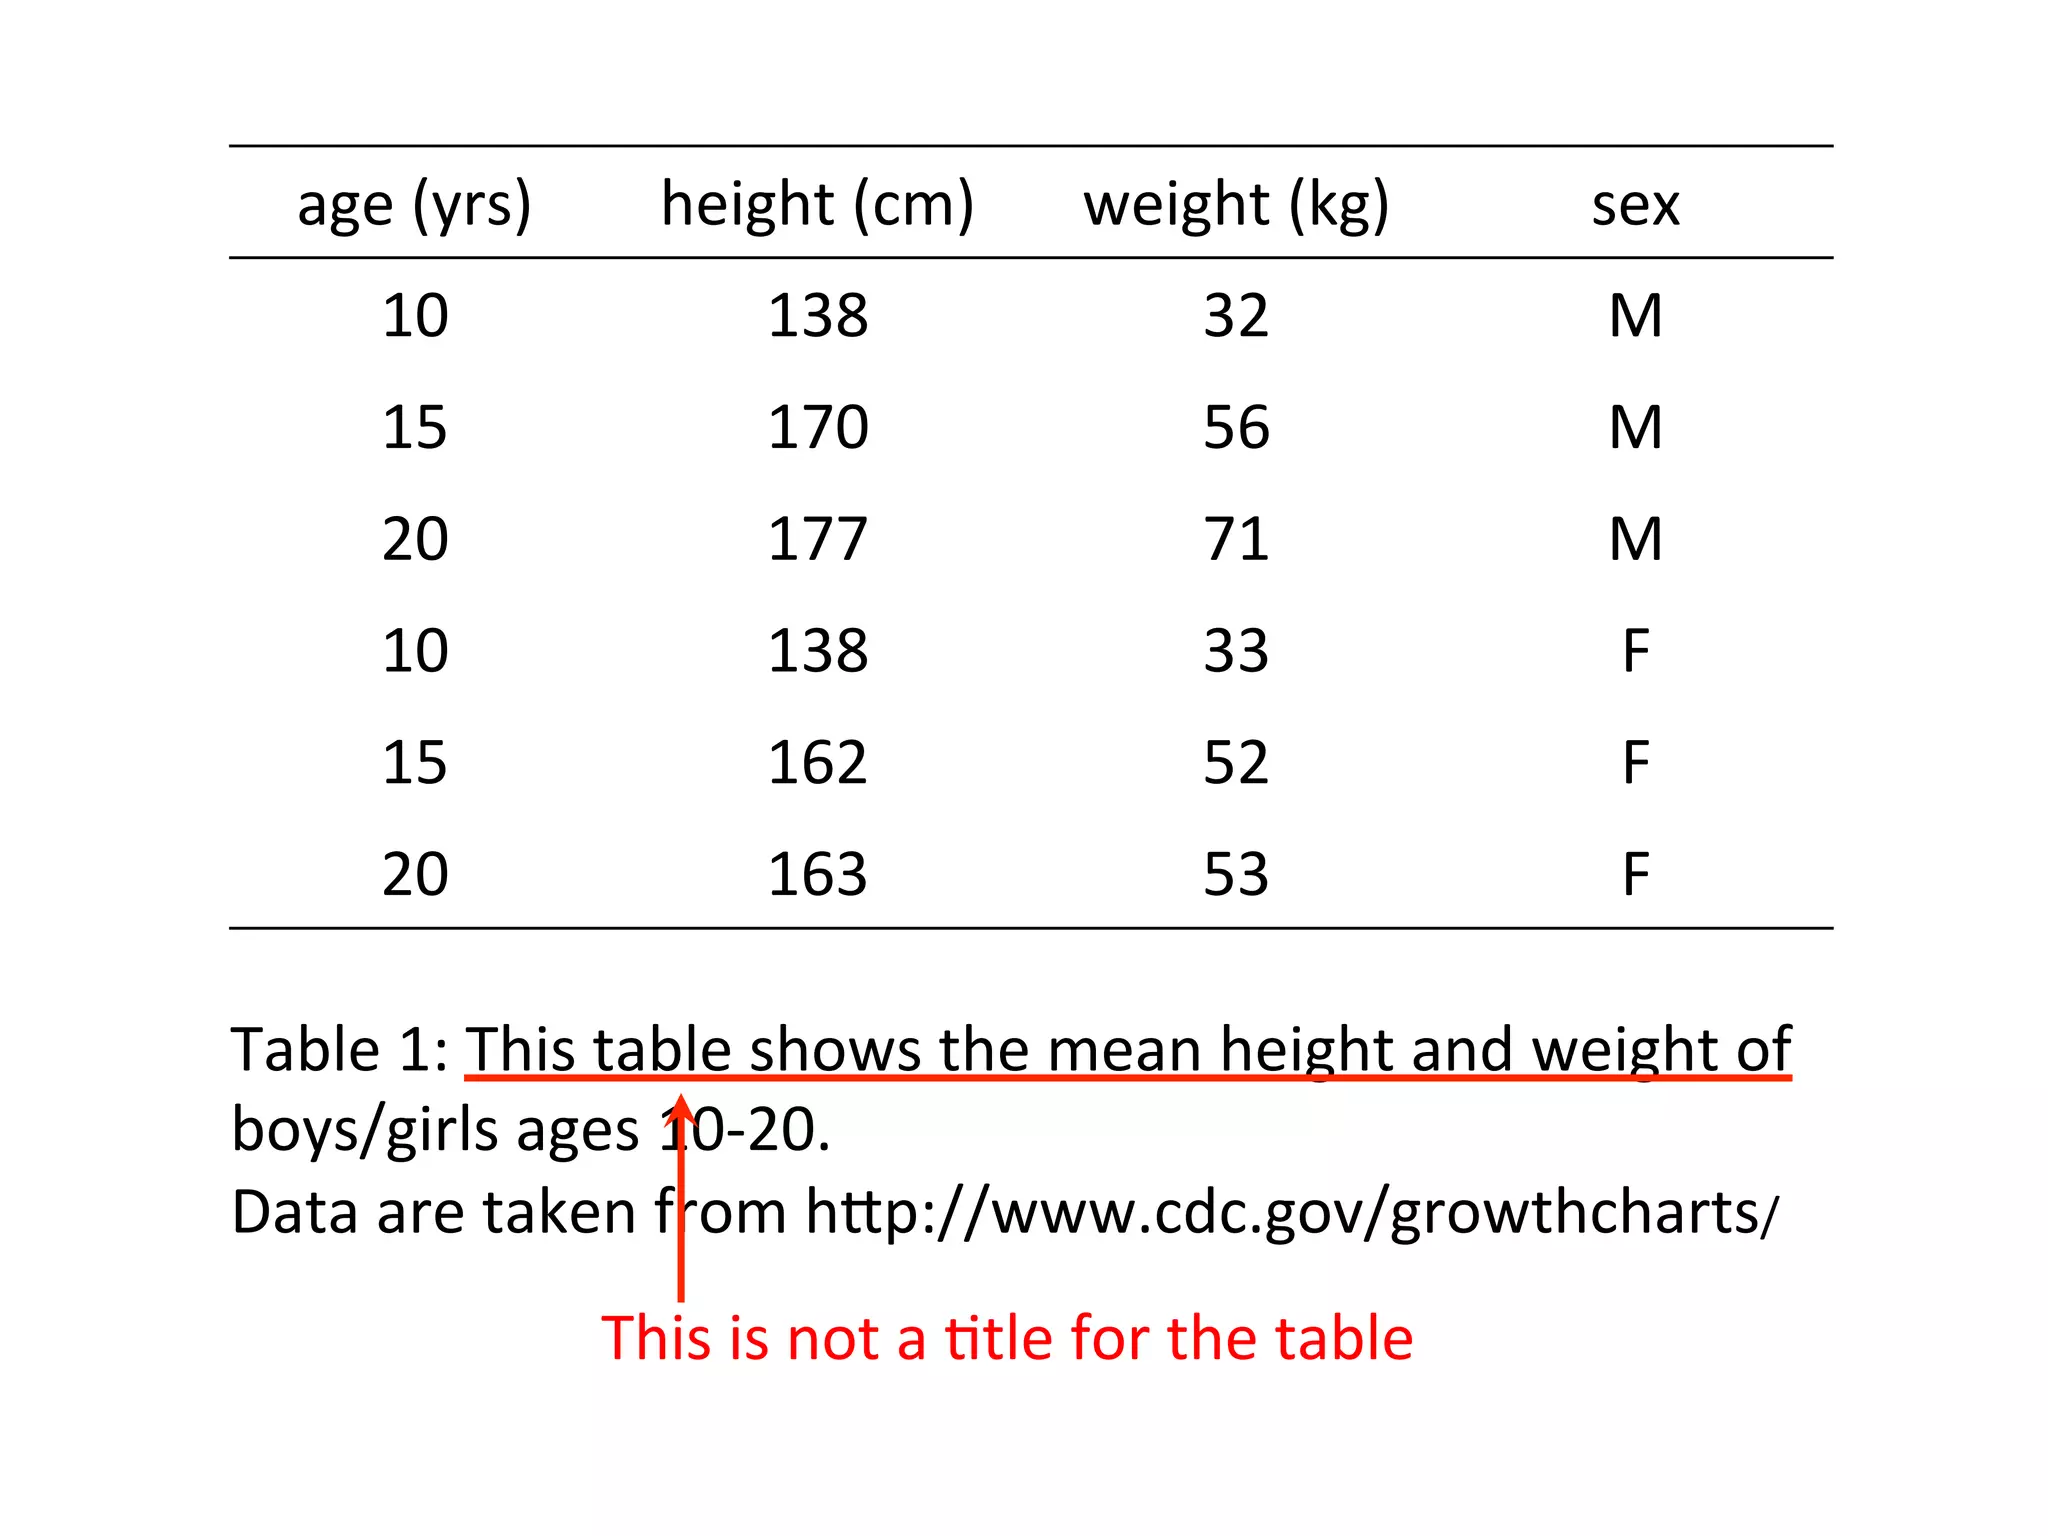
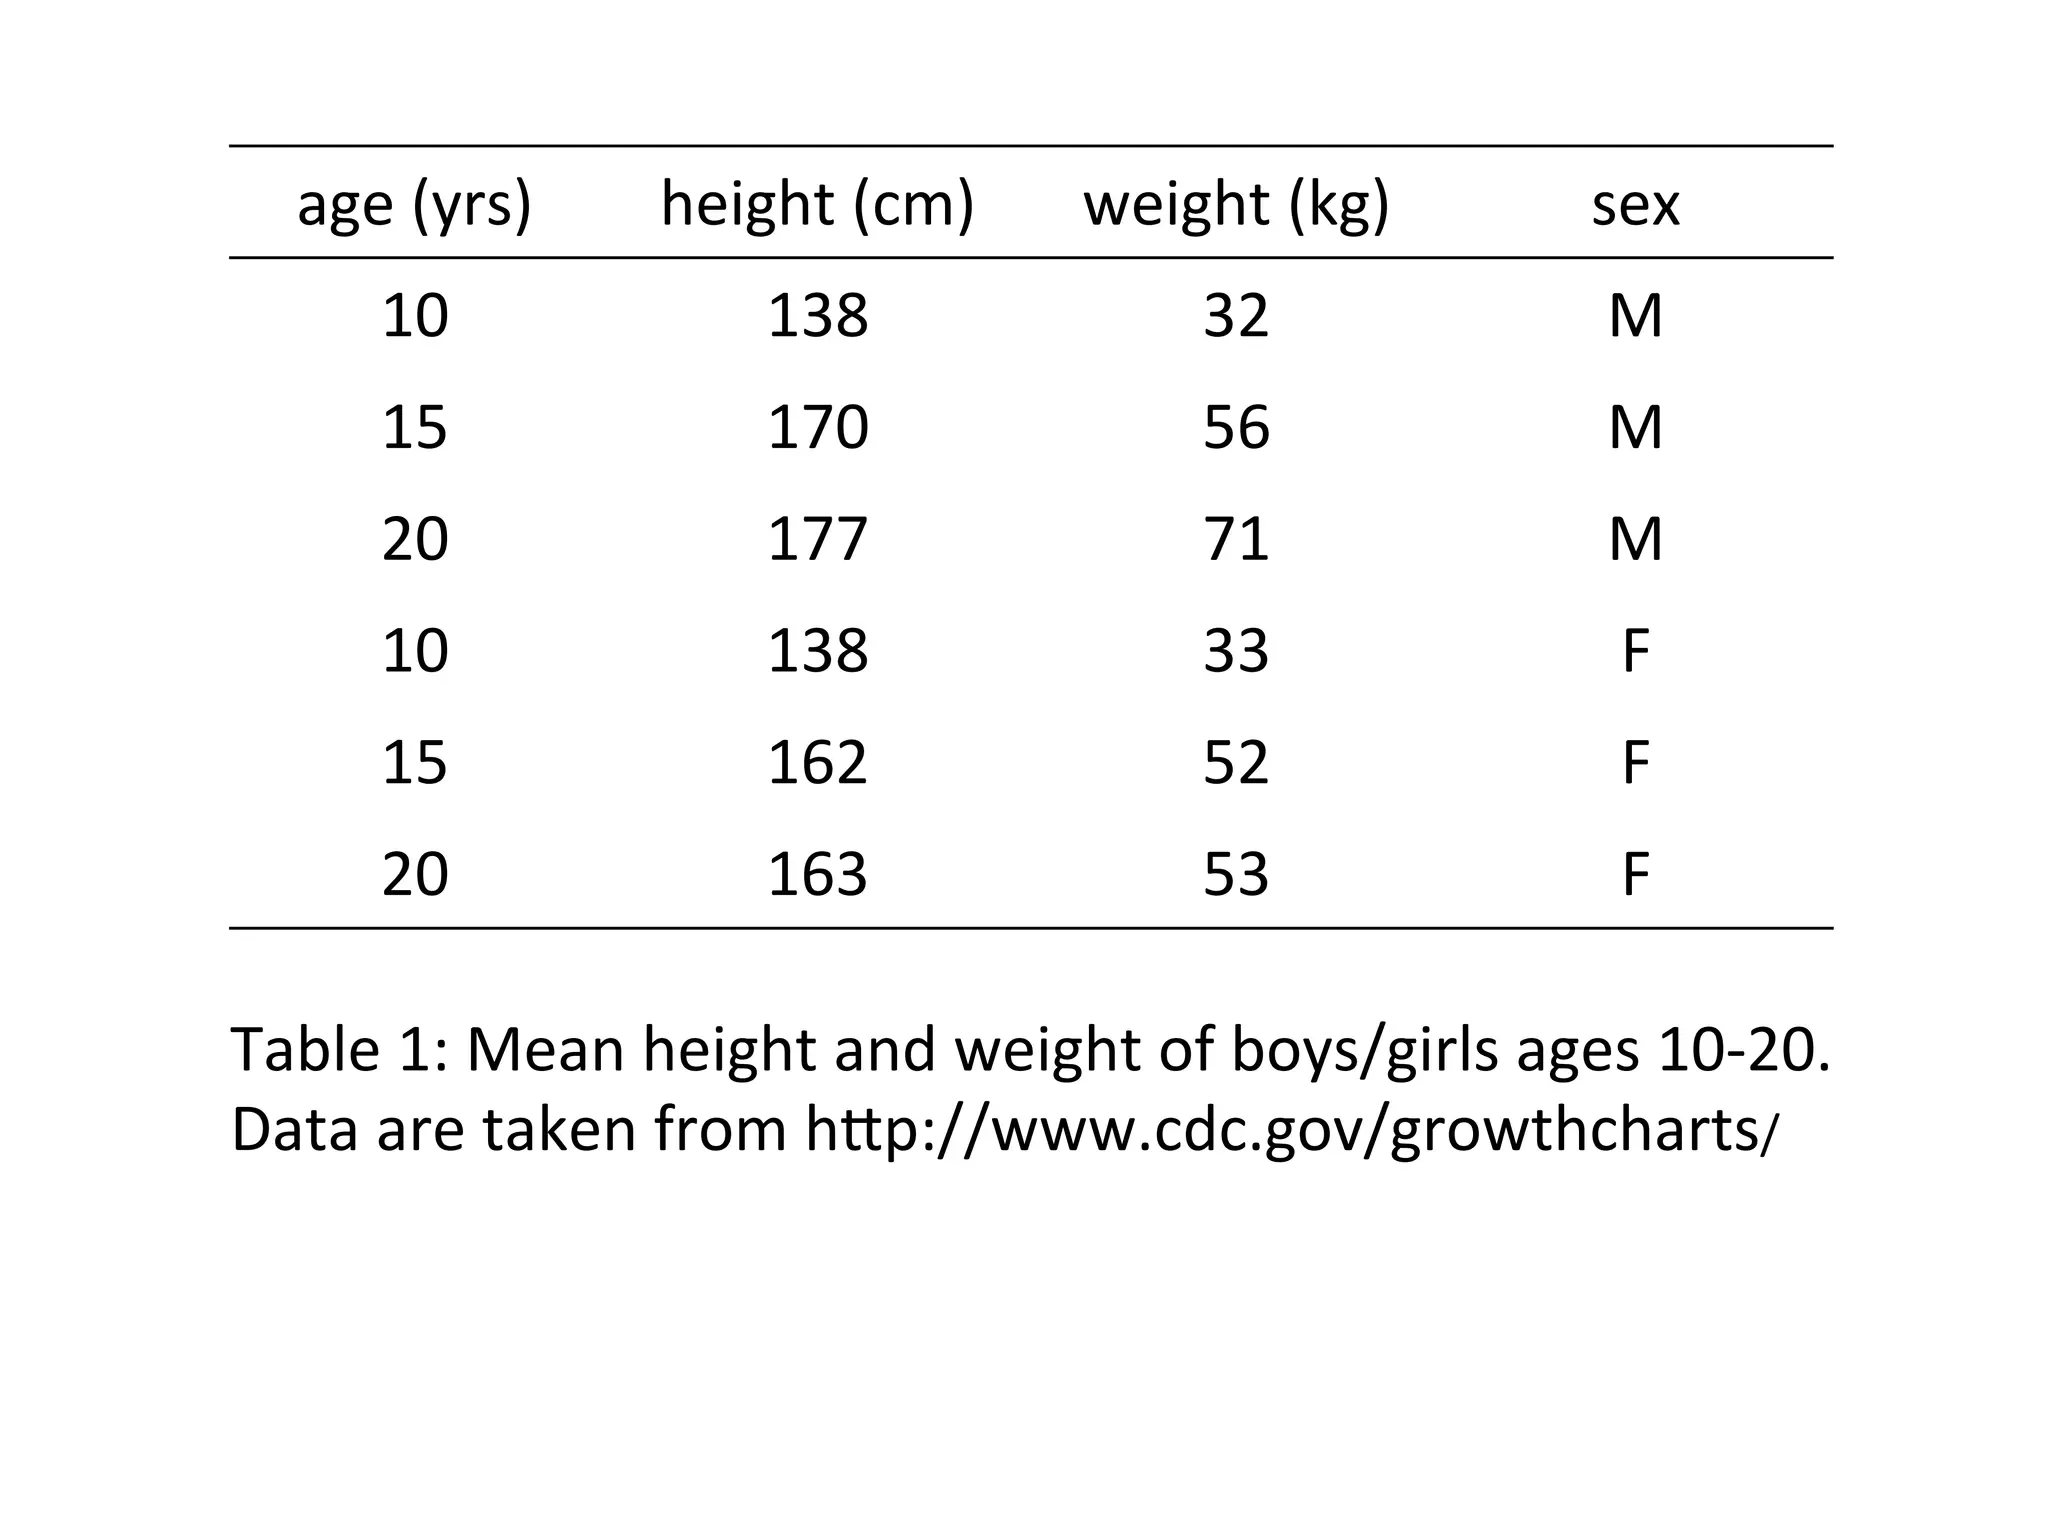
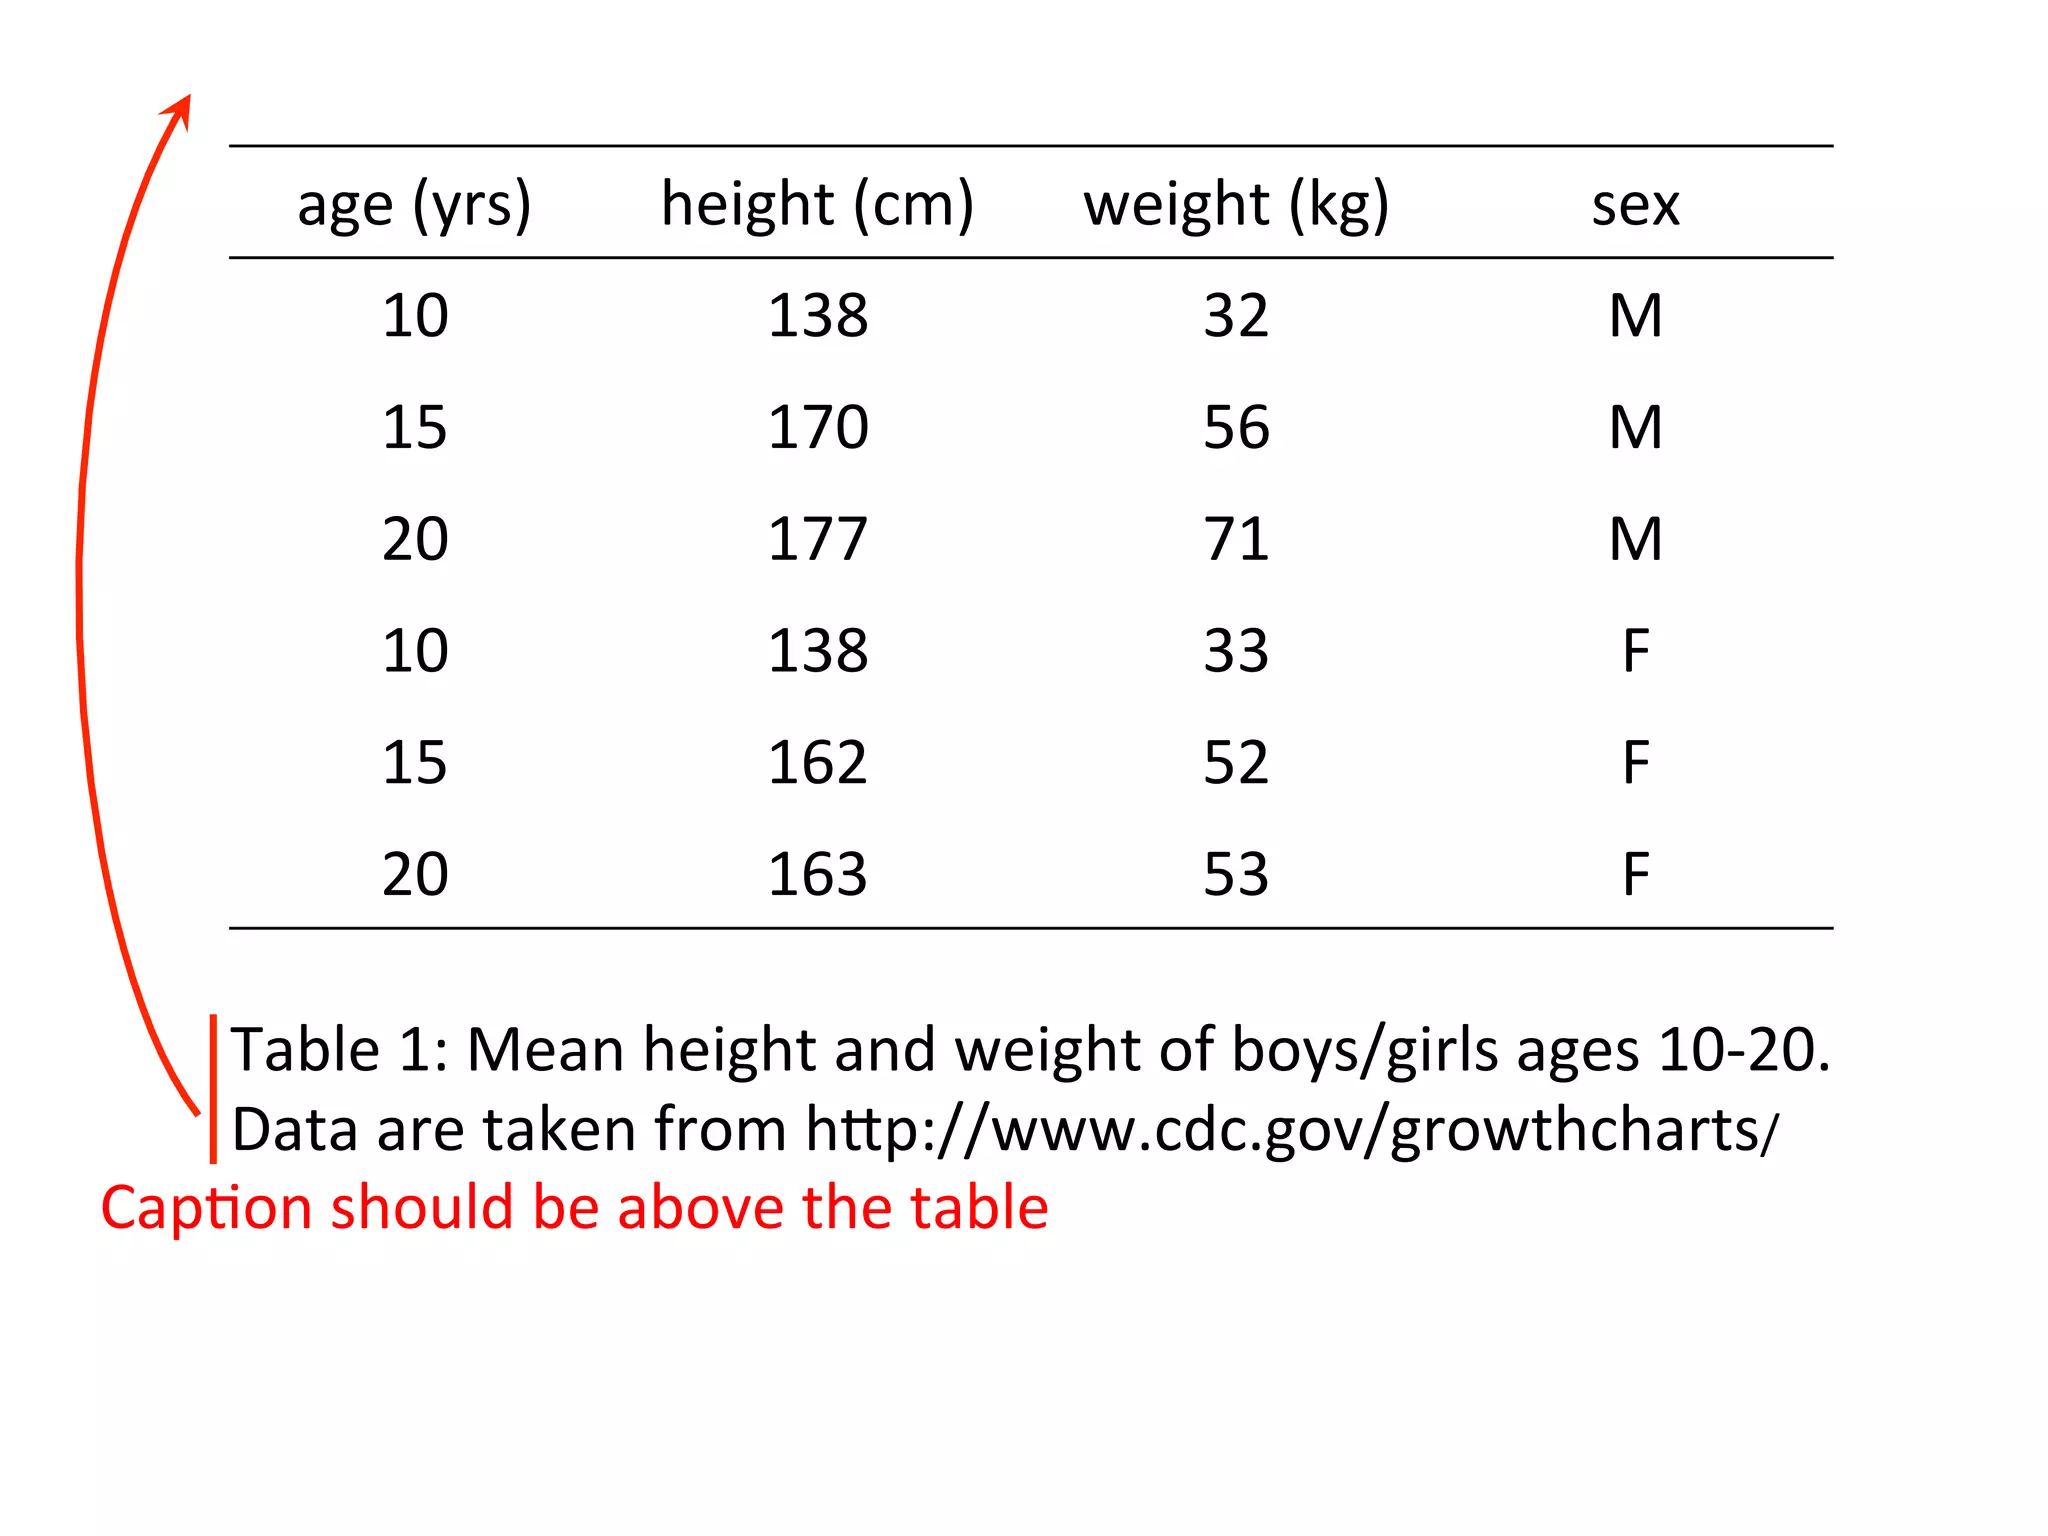

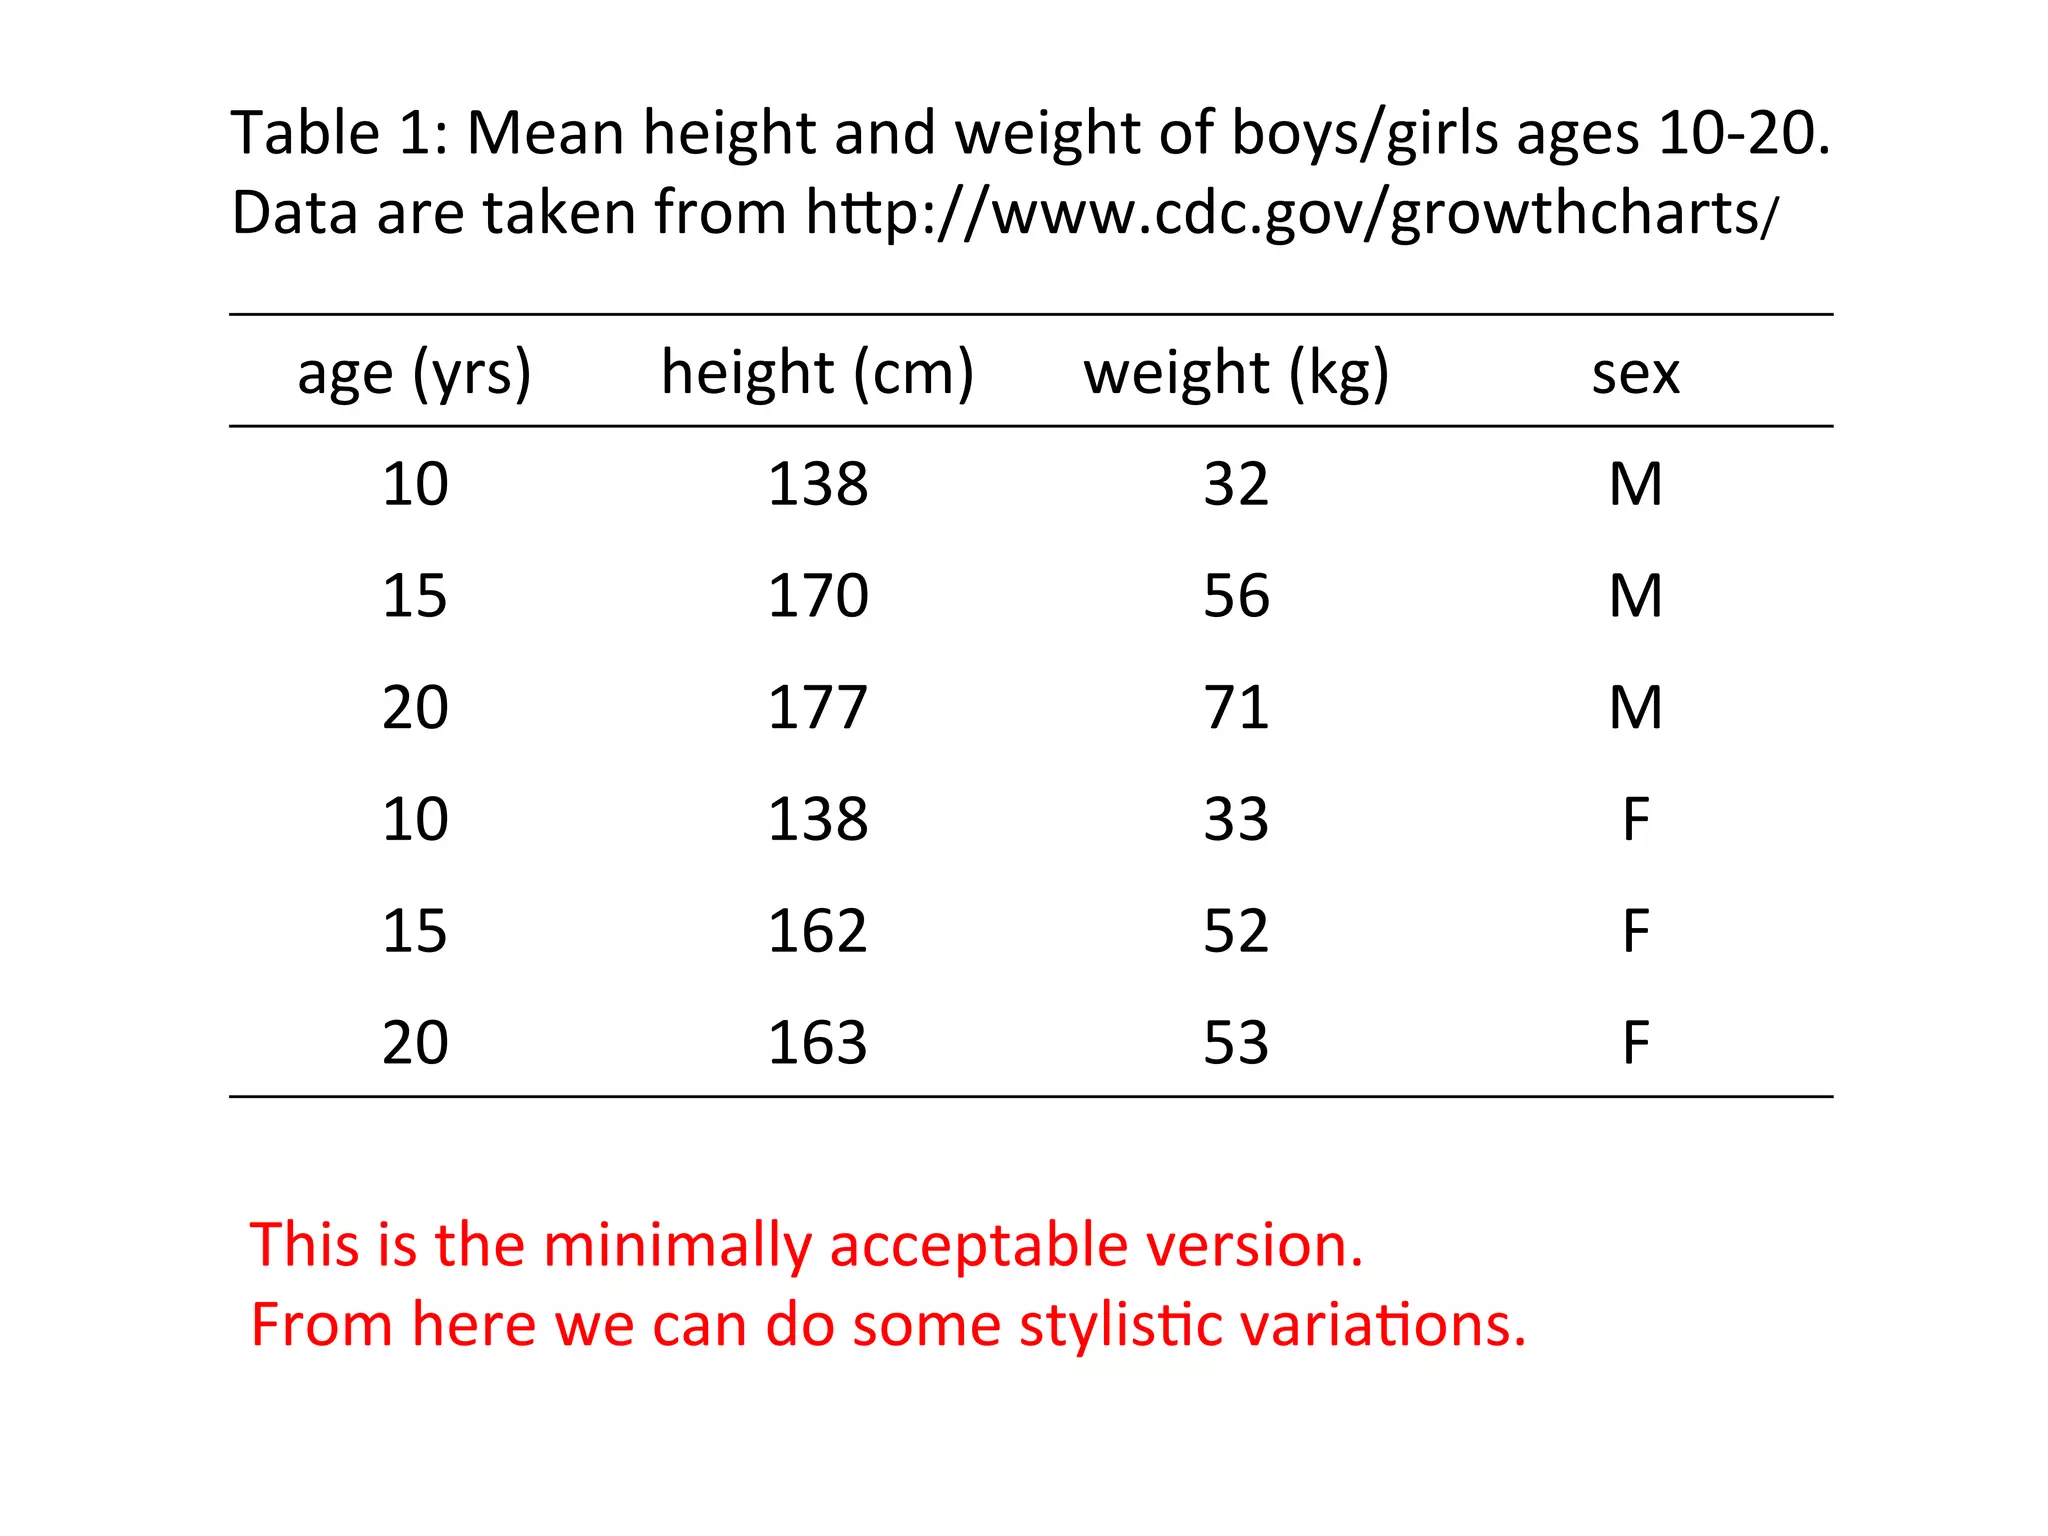
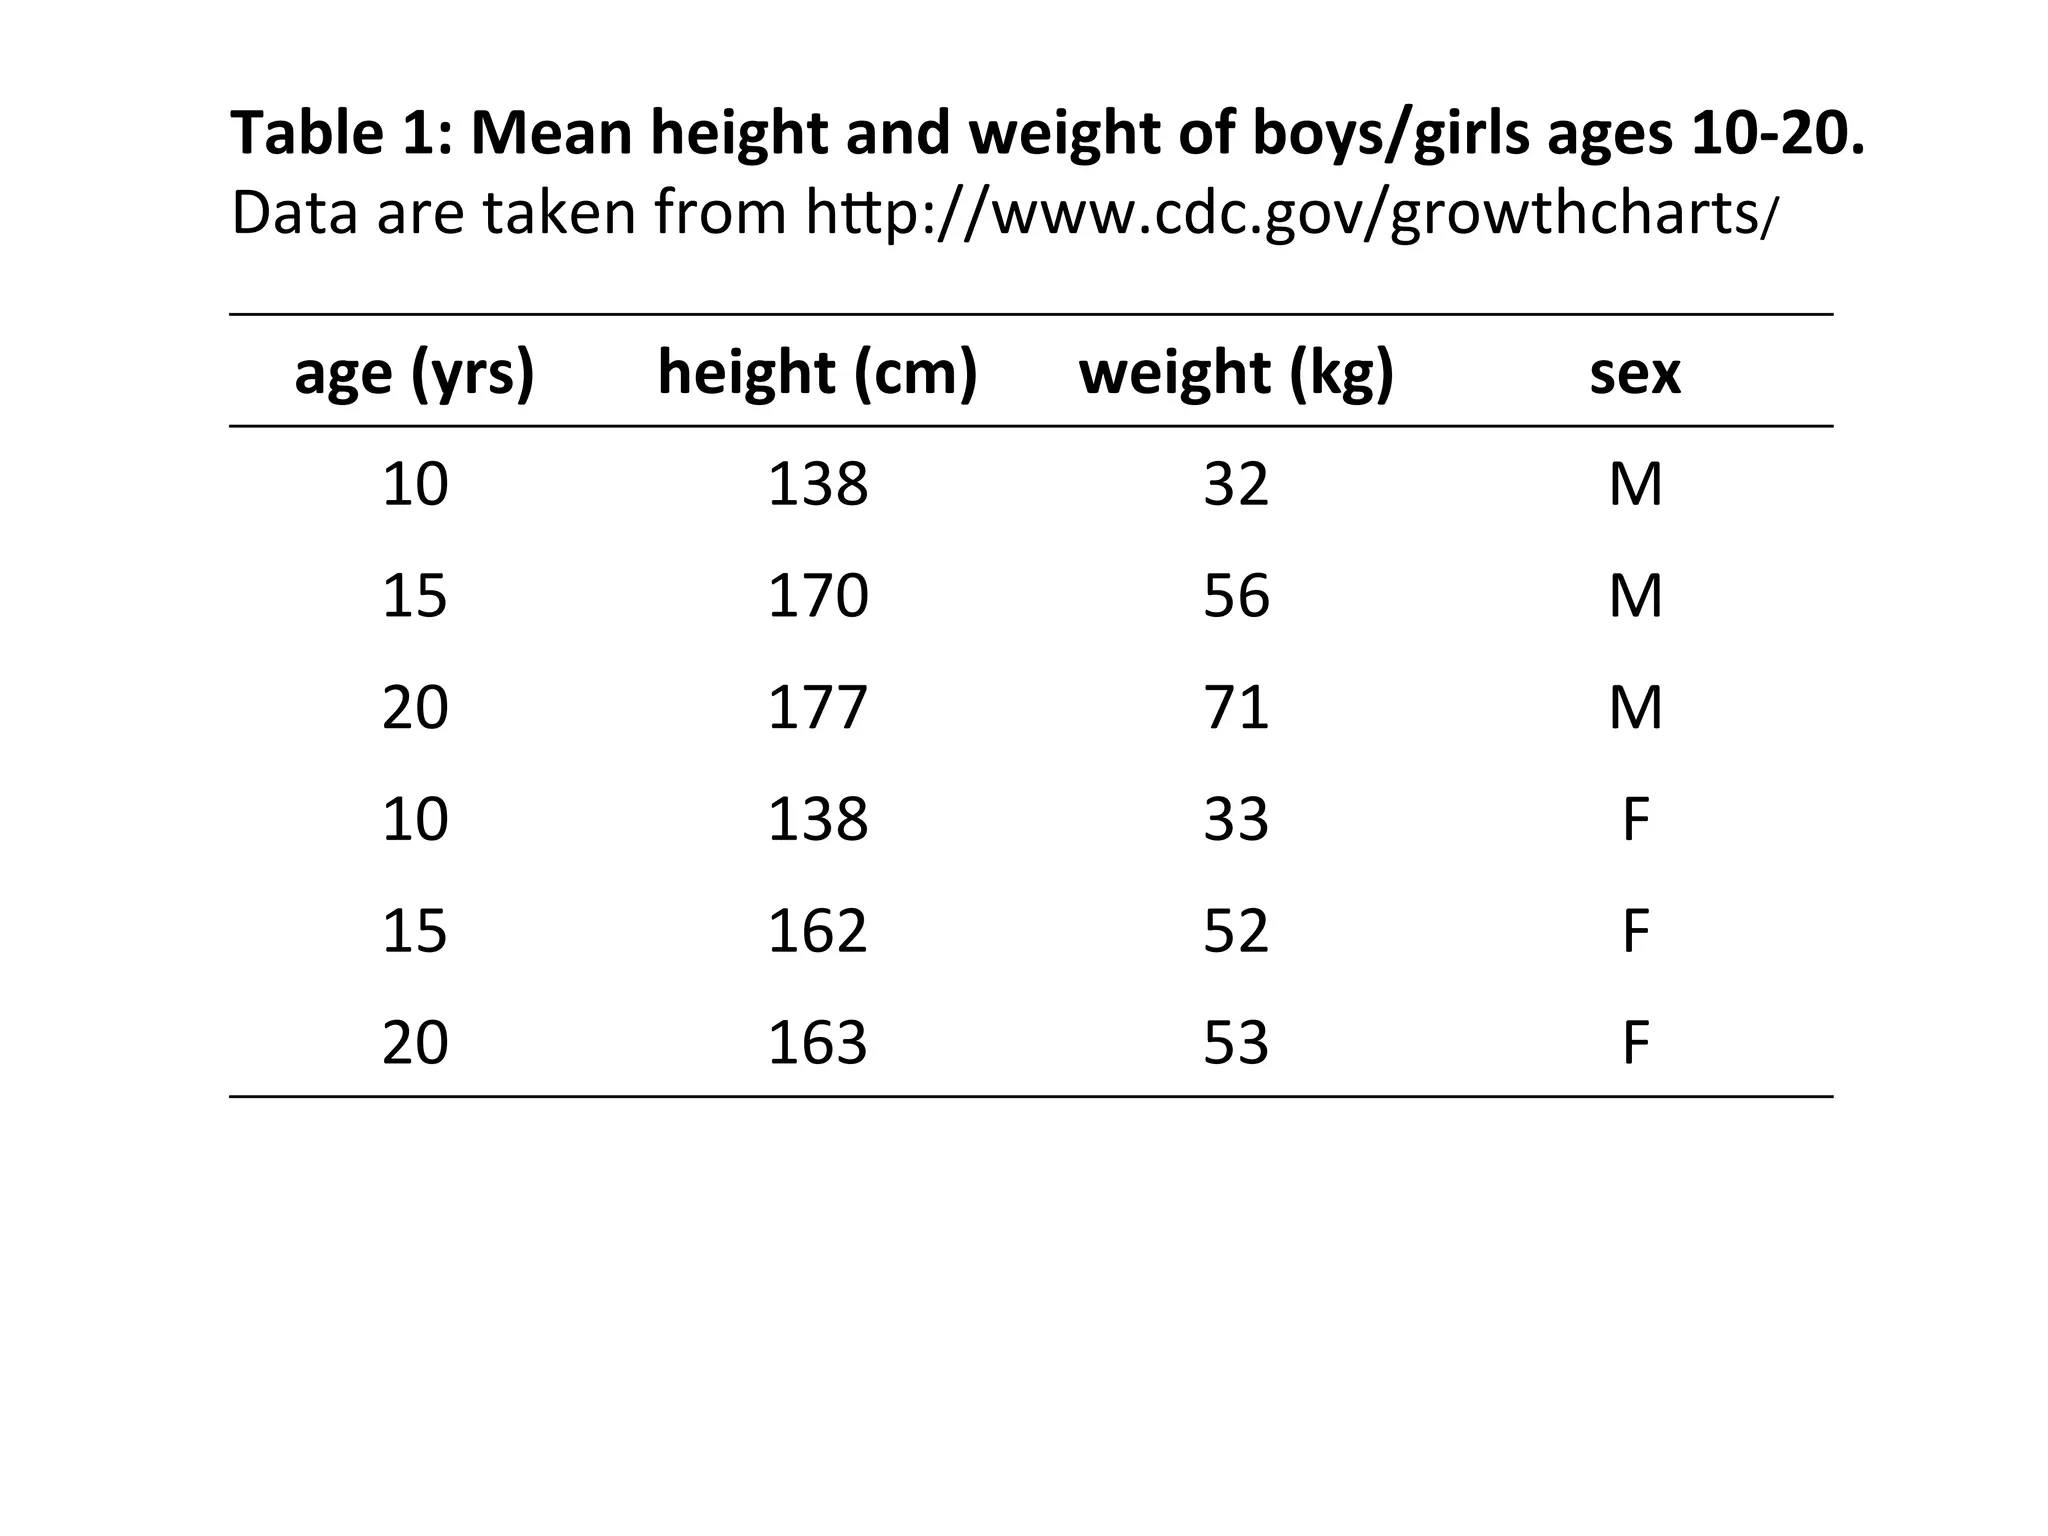
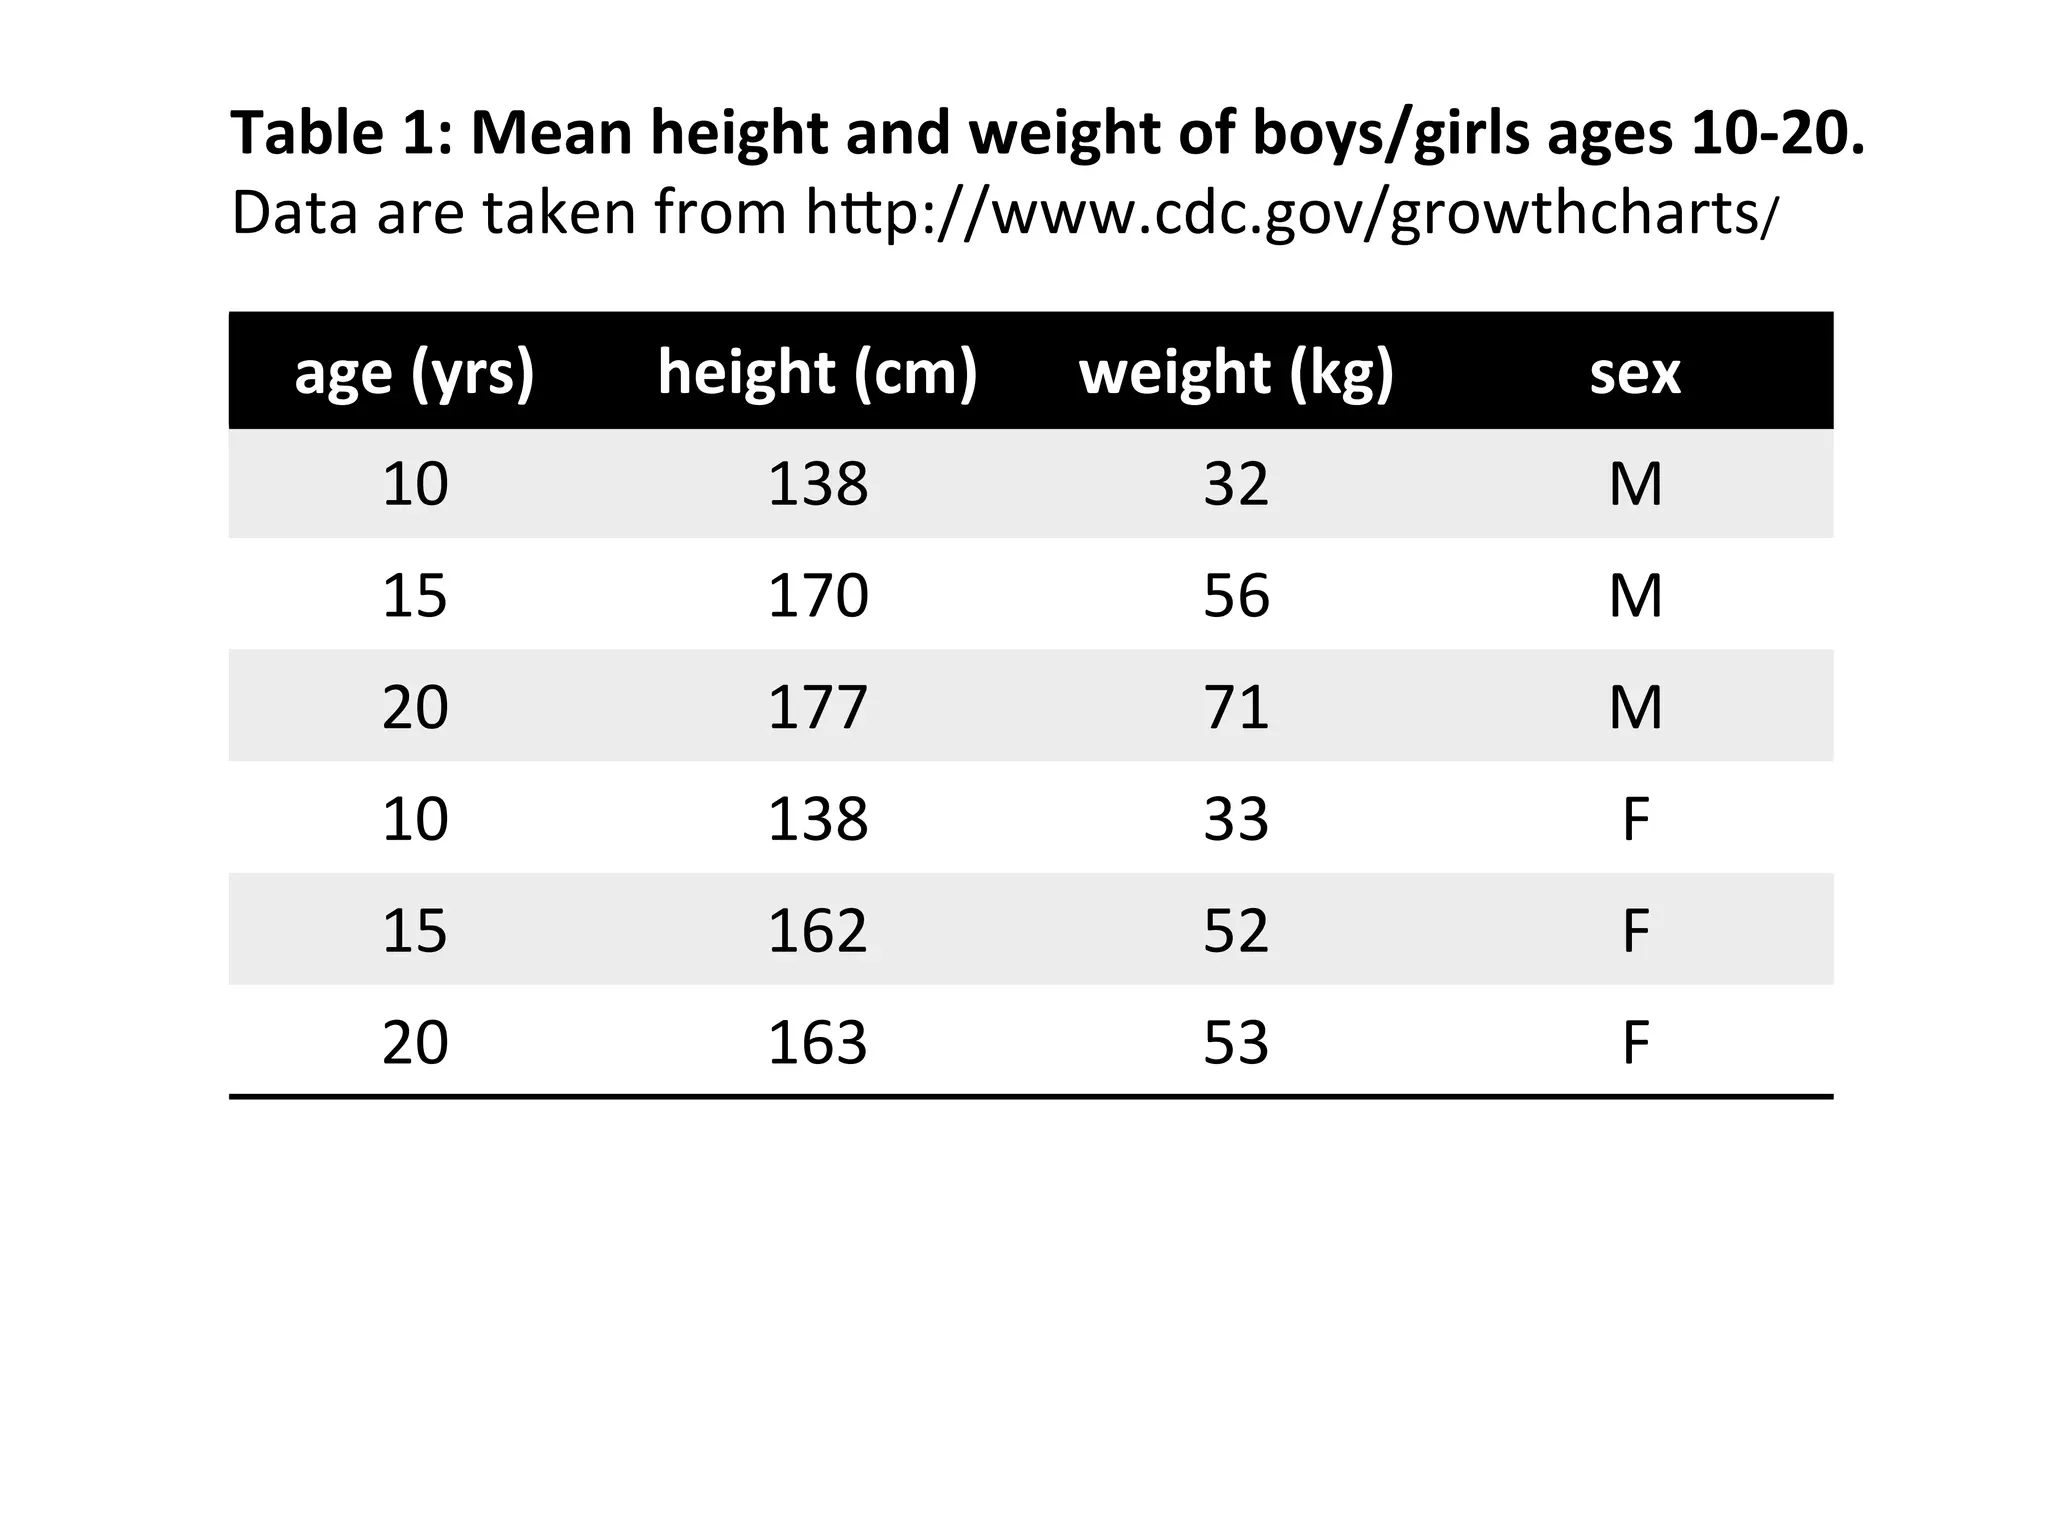
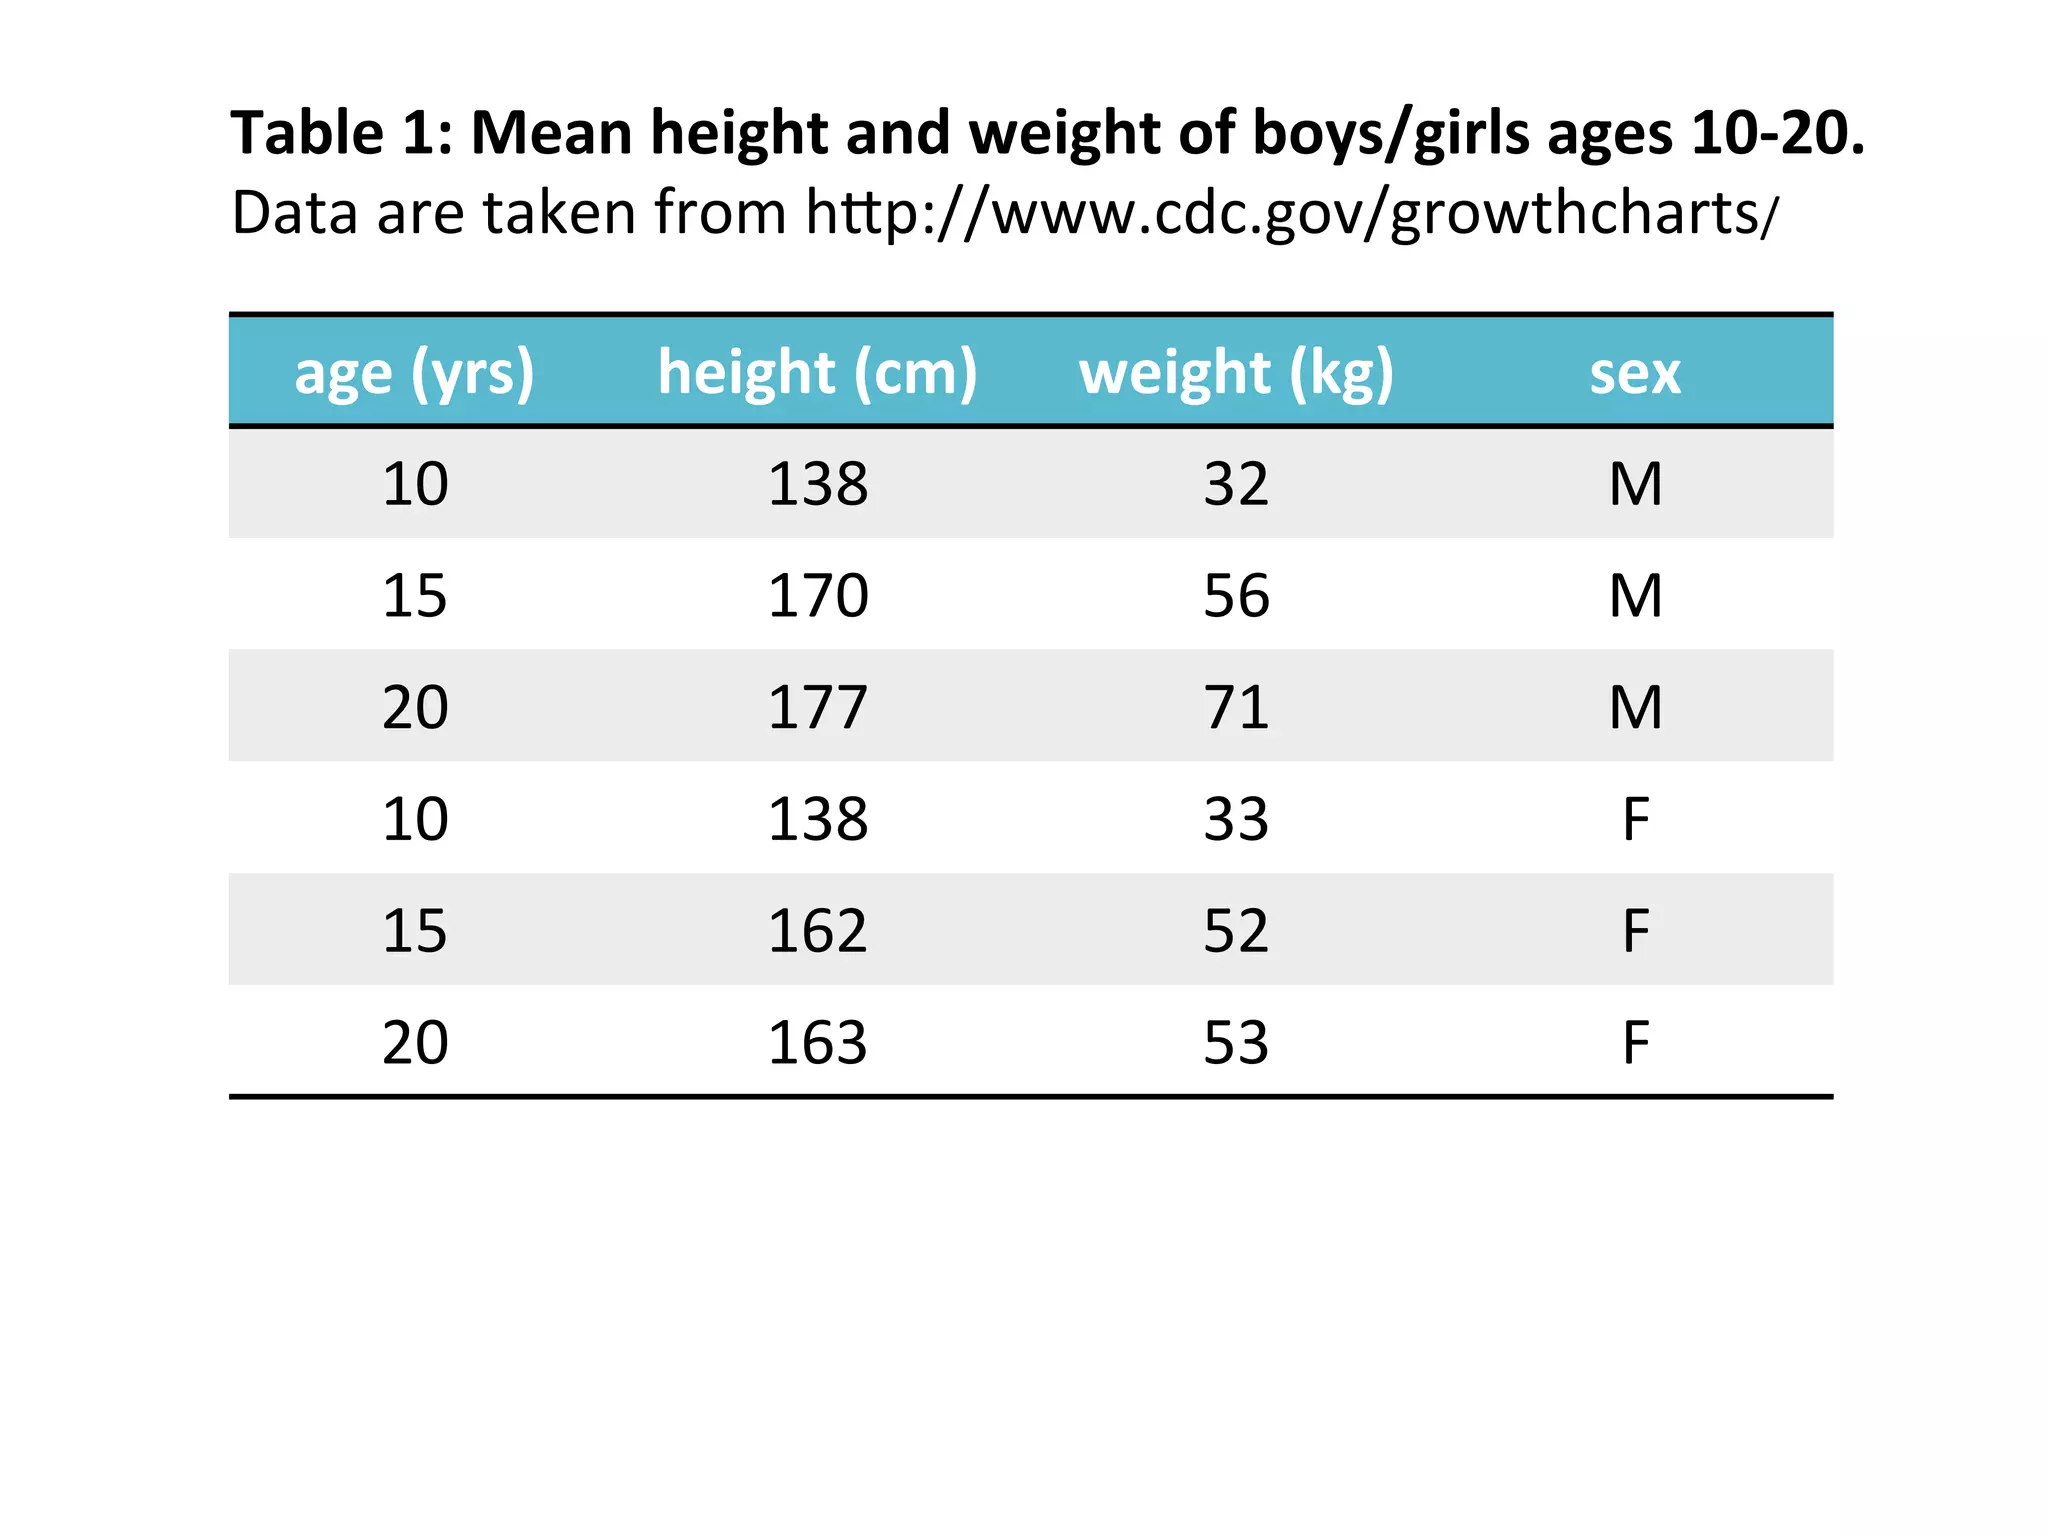
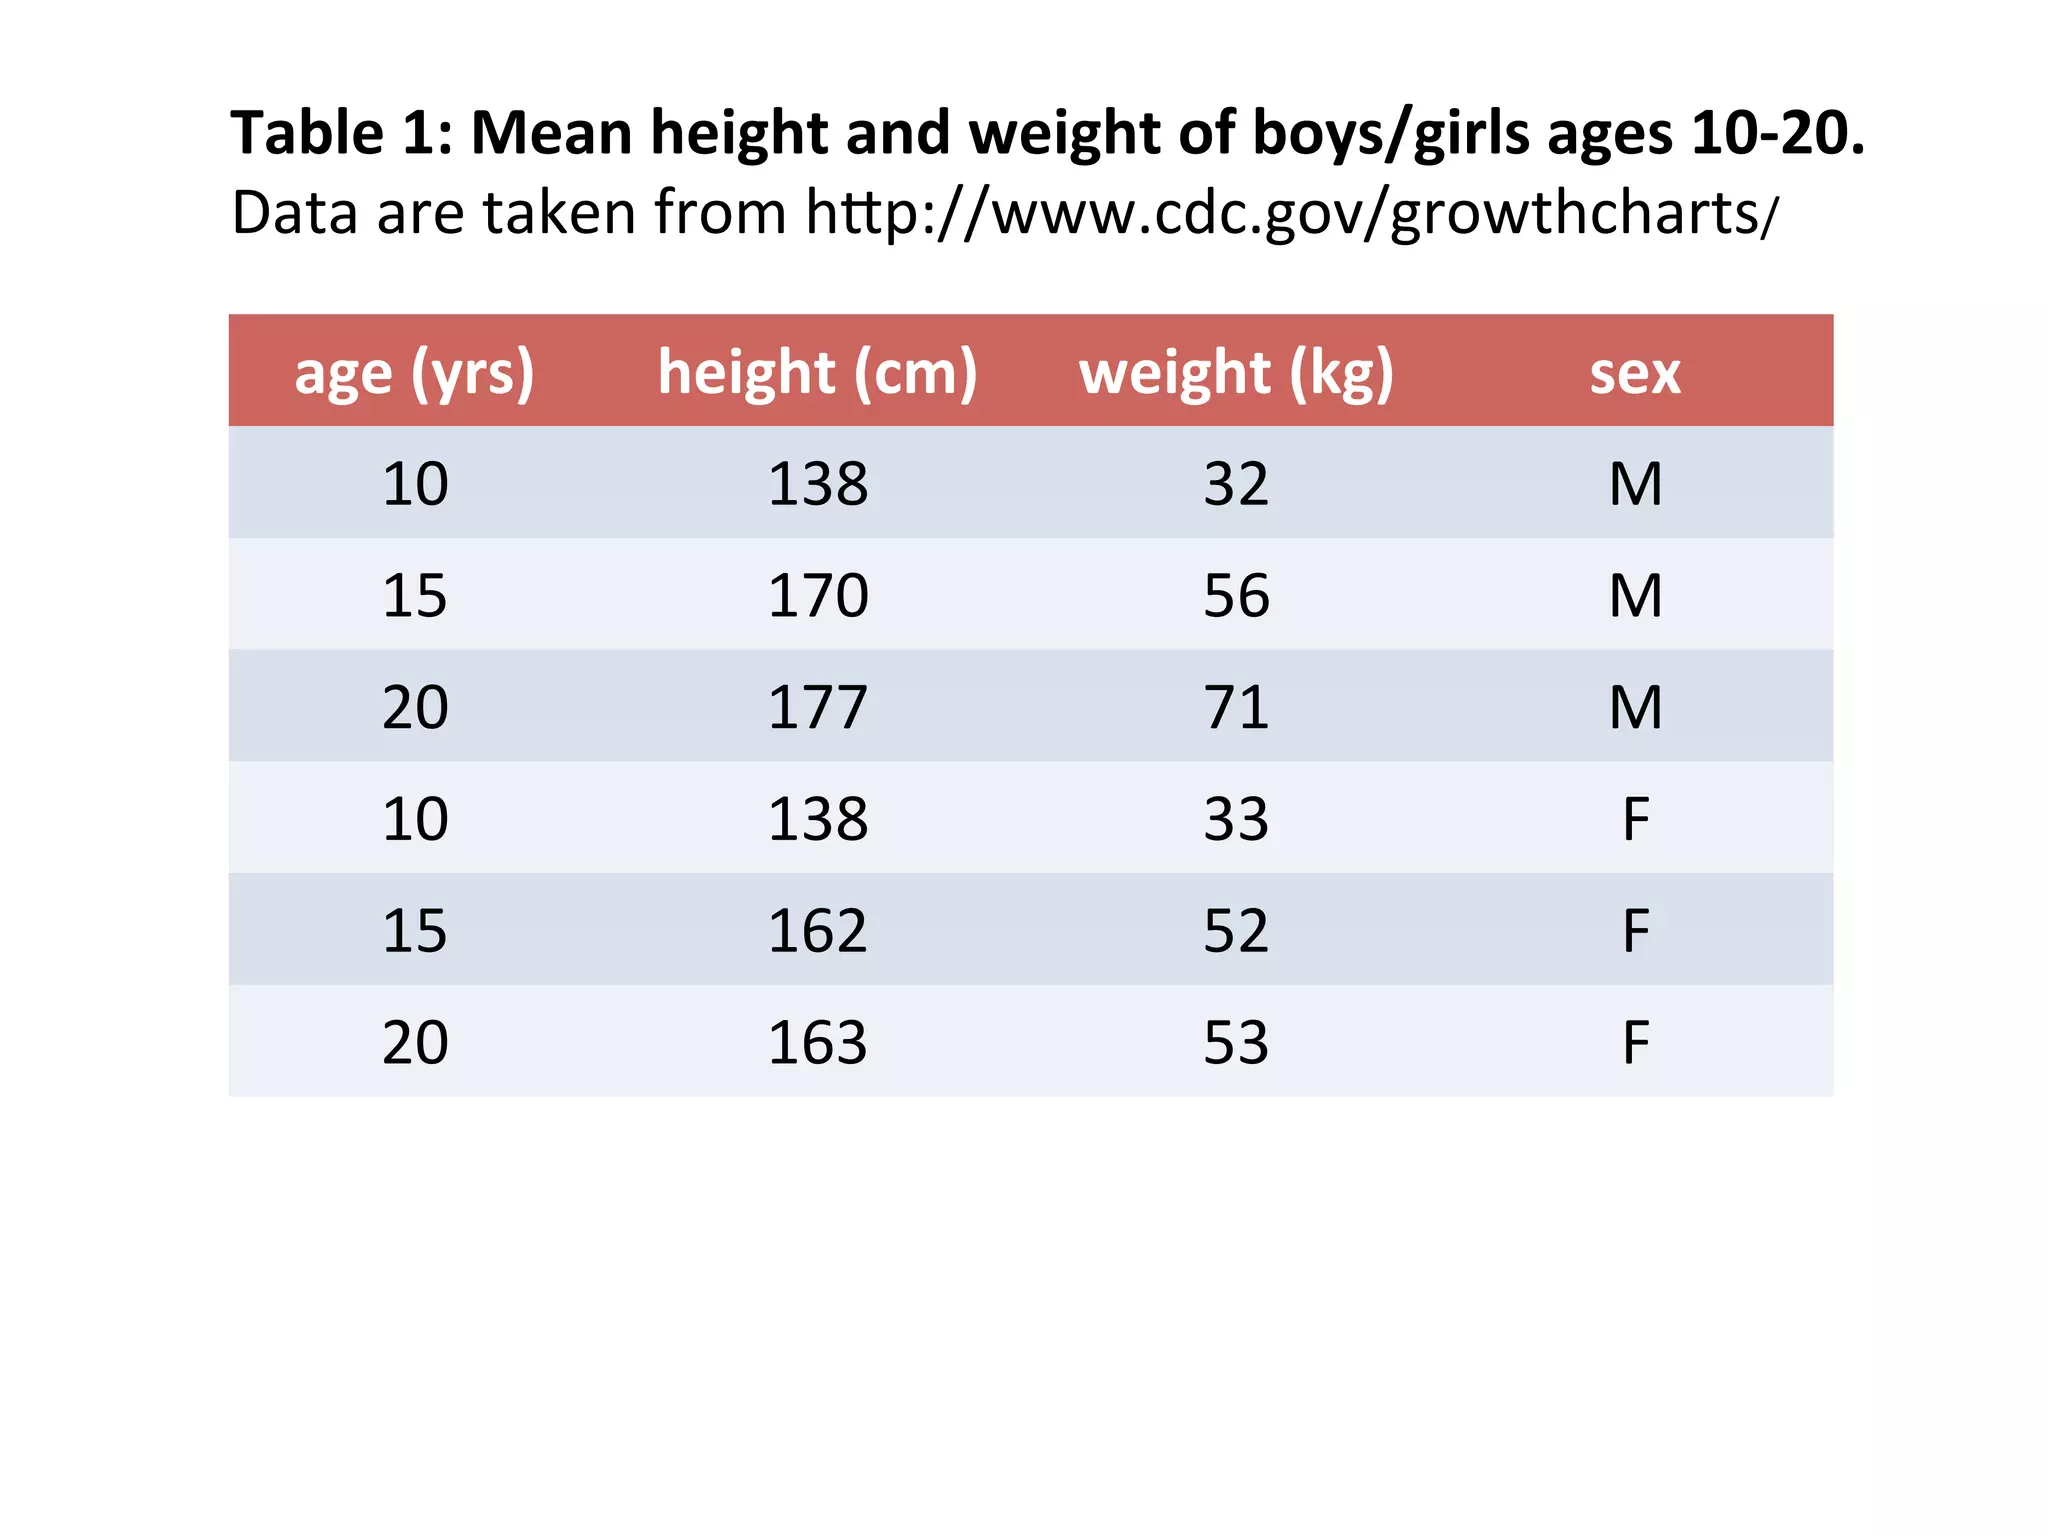
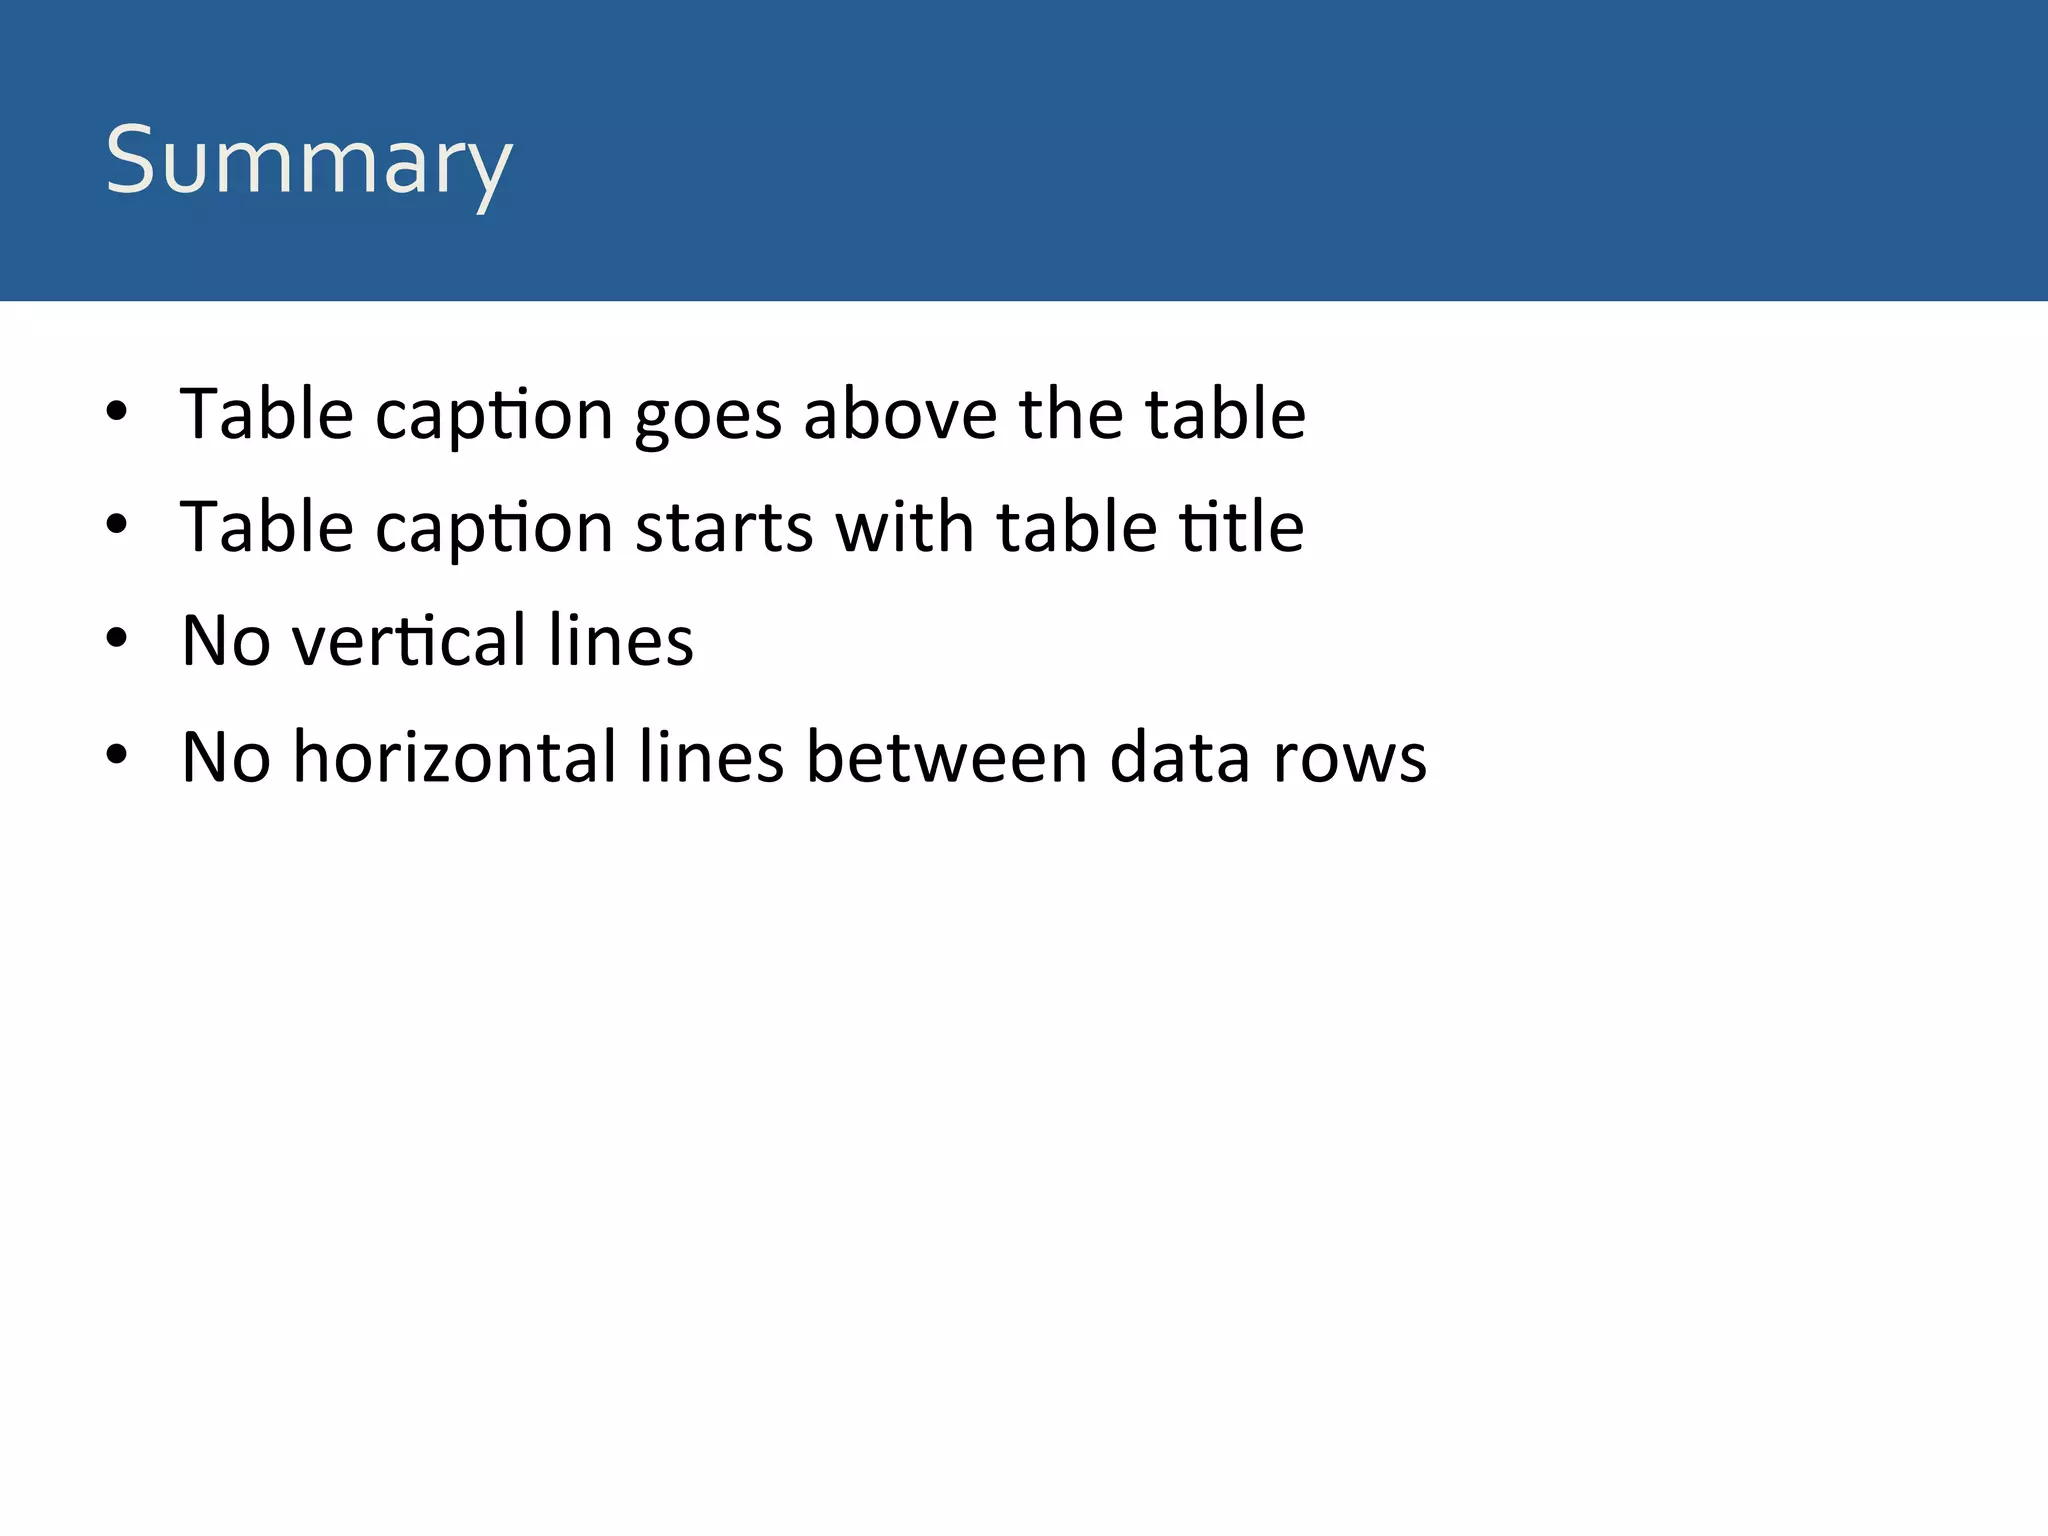

The document provides guidelines for creating effective figure captions and tables, emphasizing proper formatting and placement. Figure captions should be positioned beneath or beside figures, and start with the figure title, while table captions should be placed above the table and also begin with the table title. It highlights the importance of avoiding vertical and horizontal lines between data rows in tables.


