Recommended

Recommended
More Related Content
Similar to Myers_Poster
Similar to Myers_Poster (20)
Myers_Poster
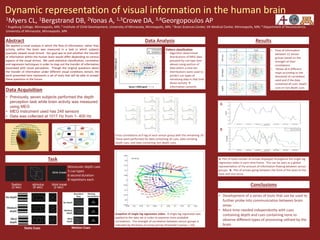
- 1. Dynamic representation of visual information in the human brain 1Myers CL, 1Bergstrand DB, 2Yonas A, 1,3Crowe DA, 3,4Georgopoulos AP 1 Augsburg College, Minneapolis, MN; 2 Institute of Child Development, University of Minnesota, Minneapolis, MN; 3 Brain Sciences Center, VA Medical Center, Minneapolis, MN; 4 Department of Neuroscience, University of Minnesota, Minneapolis, MN Data Acquisition • Previously, seven subjects performed the depth perception task while brain activity was measured using MEG • MEG instrument used has 248 sensors • Data was collected at 1017 Hz from 1- 400 Hz blink break fixation (2 sec) stimulus (6 sec) blink break (2 sec) Monocular depth cues 5 cue types 6 second duration 8 repetitions each Abstract We applied a novel analysis in which the flow of information, rather than activity, within the brain was measured in a task in which subjects passively viewed visual stimuli. Our goal was to test whether the transfer of information within the human brain would differ depending on various aspects of the visual stimuli. We used statistical classification, correlation and regression techniques in order to map out the transfer of information associated with visual perception. Though the original questions about the transfer of information under different visual conditions remain, the work presented here represents a set of tools that will be able to answer these questions in the future. Data Analysis Pattern classification • Algorithm determined distributions of MEG data grouped by cue type (see above) using portion of data within a time bin • Distributions were used to predict cue types of remaining data in that time (brain activity information content). Results Task Conclusions • Flow of information between 11 sensor groups based on the strength of their correlations • Shows all 6 different maps according to the threshold of correlation used and if the data contained all cues, depth cues or non depth cues • Development of a series of tools that can be used to further probe into communication between brain areas • More time needed independently with cues containing depth and cues containing none to observe different types of processing utilized by the brain Static Cues Motion Cues Snapshot of single lag regression video. A single lag regression was applied to the data set in order to examine more probable correlations. The strength of correlation between sensor groups is indicated by thickness of arrow (arrow threshold f-vaulue > 10). A B A. Plot of total number of arrows displayed throughout the single lag regression video in each time frame. This can be seen as a global representation of the amount of information flowing between sensor groups. B. Plot of arrows going between the front of the brain to the back and vice versa. Cross correlations at 0 lag of each sensor group with the remaining 10. These were performed for data containing all cues, data containg depth cues, and data containing non depth cues.
Editor's Notes
- Results: Figure for decoding time courses displaying dynamics Figure for MI time courses? Figure for centers of normal curves, confirming testing and training bin same = highest accuracy Figure displaying increasing widths of normal curves, indicating “slowing down” of dynamics Do we want anything about the movies? -- Yes Conclusions: Confirmed presence of dynamics in human brain Dynamics occur in absence of changing visual stimuli Dynamics “slow down” over time MEG—poor spatial res