1. THE SEA GRANT
and GOMRI
PARTNERSHIP
The mission of Sea Grant is to
enhance the practical use and
conservation of coastal, marine
and Great Lakes resources in
order to create a sustainable
economy and environment.
There are 33 university–
based Sea Grant programs
throughout the coastal U.S.
These programs are primarily
supported by the National
Oceanic and Atmospheric
Administration and the states
in which the programs are
located.
In the immediate aftermath
of the Deepwater Horizon
spill, BP committed $500
million over a 10–year period
to create the Gulf of Mexico
Research Institute, or GoMRI.
It is an independent research
program that studies the effect
of hydrocarbon releases on
the environment and public
health, as well as develops
improved spill mitigation, oil
detection, characterization
and remediation technologies.
GoMRI is led by an independent
and academic 20–member
research board.
The Sea Grant oil spill science
outreach team identifies the
best available science from
projects funded by GoMRI and
others, and only shares peer-
reviewed research results.
http://gulfseagrant.org
http://gulfresearchinitiative.org
Texas • Louisiana • Florida
Mississippi-Alabama
FISHERIES LANDINGS AND DISASTERS
IN THE GULF OF MEXICO
Christine Hale, Larissa Graham, Emily Maung–Douglass, Stephen Sempier, LaDon Swann,
and Monica Wilson
Coastal and ocean ecosystems provide benefits to people, including
clean water, protection from storms, and food. Fishery resources are an
essential part of those ecosystems and are considered to be common
property. Thus, fisheries, or all of the activities involved in catching fish
and shellfish, are managed by government for the benefit of all citizens.
To manage and conserve fisheries resources, especially in the face of oil
spill disasters, science is key.
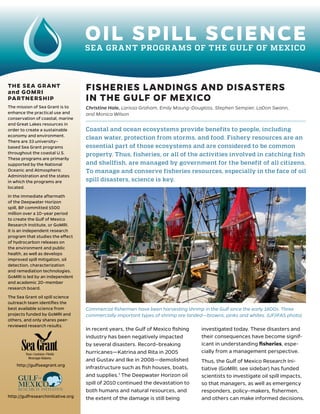
Commercial fishermen have been harvesting shrimp in the Gulf since the early 1800s. Three
commercially important types of shrimp are landed—browns, pinks and whites. (UF/IFAS photo)
In recent years, the Gulf of Mexico fishing
industry has been negatively impacted
by several disasters. Record–breaking
hurricanes—Katrina and Rita in 2005
and Gustav and Ike in 2008—demolished
infrastructure such as fish houses, boats,
and supplies.1
The Deepwater Horizon oil
spill of 2010 continued the devastation to
both humans and natural resources, and
the extent of the damage is still being
investigated today. These disasters and
their consequences have become signif-
icant in understanding fisheries, espe-
cially from a management perspective.
Thus, the Gulf of Mexico Research Ini-
tiative (GoMRI; see sidebar) has funded
scientists to investigate oil spill impacts,
so that managers, as well as emergency
responders, policy–makers, fishermen,
and others can make informed decisions.
2. This publication summarizes historical fisheries land-
ings data for several significant Gulf of Mexico species
within the context of manmade and natural disasters,
and explores why this data is important for fisheries
management. Emerging GoMRI–funded fisheries sci-
ence is also introduced. Further fisheries science related
to oil spills will be detailed in other publications within
this series.
LANDINGS
Landings are the quantities, in number or weight, of
seafood unloaded at a dock by commercial fishermen or
brought to shore by recreational fishermen, as reported
to biologists, resource managers, or seafood dealers.
Landings information can include quantity and value of
seafood products caught and sold to seafood dealers.2
Landings data are essential for interpreting harvest
trends and gauging changes in fish stocks over time. A
fish stock is a group of fish of the same species living in
the same geographic area and reproducing with each
other.3
Landings are a type of fishery–dependent data, that
is, information collected directly from the commercial
and recreational harvest. Conversely, fisheries data
collected by scientists who catch the fish themselves,
rather than depending on fishermen and seafood
dealers, is referred to as fishery–independent data.
Fishery–independent data enables scientists to study
specific factors influencing fish populations. Factors
such as growth rate of a species, predator and prey
interactions, environmental conditions, time of year,
fishing regulations, type of gear used in catching fish,
market prices and fishing effort (how much time, gear
size, boat size and horsepower, used to harvest fish)
are all some of the important considerations made in
understanding landings trends and fisheries overall.2
Both fishery–independent and fishery–dependent
methods contribute valuable information to popula-
tion assessments, but scientists rarely have enough
resources to collect vast quantities of data over large
geographic areas. Thus, scientists and resource man-
agers rely on fishery–dependent data for management
planning.2
Ultimately, it is important for managers to analyze all
aspects of fisheries, such as economics, in order to
improve the long–term environmental health of the Gulf
of Mexico, and the health of the people who depend
on the Gulf for their livelihood. The seafood industry is
economically important to Gulf of Mexico communities
and to the nation. Healthy and productive fisheries
provide jobs for both fishermen and the numerous
support industries such as seafood processing, market-
ing, and monitoring, and vessel maintenance businesses
like repair shops, marinas, and supply companies.
In 2012, the overall economic impact of the Gulf of
Mexico seafood industry, expressed in terms of dollars
generated from landings revenue, jobs, sales, income,
and value–added impacts, totaled $35 billion (Table 1).1
Total Gulf landings revenue—income from bringing
fish and shellfish to shore for sale—was $763 million in
2012.1
This puts the Gulf in third place in the nation for
landings revenue alone, out of total national landings
Number of
Jobs
Landings
Revenue Sales Income Value Added
Alabama 9,947 $46,340 $460,514 $172,314 $229,316
Louisiana 33,391 $331,165 $1,927,986 $659,974 $920,873
Mississippi 8,532 $49,295 $377,374 $149,147 $193,349
Texas 25,911 $194,044 $2,499,832 $677,391 $1,036,657
Florida 82,141 $141,671 $16,553,480 $3,092,392 $5,532,209
Gulf Total 159,922 $762,515 $21,819,186 $4,751,218 $7,912,404
TABLE 1. Gulf of Mexico seafood industry economic impacts (multiply by thousands) in 2012. Commercial fishermen landed 1.7
billion pounds of finfish and shellfish, making $763 million in landings revenue. 1
2
3. Landings
(Pounds)
Landings
(Revenue)
North Pacific 5,261,421 $1,703,726
New England 664,243 $1,191,363
Gulf of Mexico 1,652,446 $762,514
Pacific 1,068,691 $661,994
Mid–Atlantic 751,144 $488,316
South Atlantic 107,802 $170,938
Western Pacific 29,289 $91,513
U.S. Total 9,637,821 $5,099,456
TABLE 2. 2012 total landings and total landings revenue of U.S.
fisheries, by region (in thousands).1
Researchers dissect fish to look for evidence of Deepwater
Horizon oil contamination, an example of fishery-indepen-
dent data collection. (USF/C-IMAGE photo)
revenue of more than $5 billion (Table 2).1
In terms of
pounds of landings, the top 10 commercial fishing ports
in the United States, in both 2012 and 2013, included
four from the Gulf: Empire–Venice, La.; Intracoastal City,
La.; Cameron, La.; and Pascagoula–Moss Point, Miss.4
These and other Gulf of Mexico fishing ports are crucial
to a thriving seafood industry; thus, natural resource
managers utilize landings and landings revenue data to
make decisions that impact fishermen and the environ-
mental health of the Gulf of Mexico.
Fishing regulations and management actions are a
factor impacting landings and landings revenue. For
example, federal and state agencies set quotas, or
the maximum amount of fish that can be caught in
a specified time period, for a fishery.3
Annual Catch
Limits, or ACLs, are a type of quota, where fishermen
can catch a certain amount of fish in one year.3
In
addition to harvest limits, fishing areas may be closed
temporarily, as they often are after natural or manmade
disasters, out of concern for the health of the fish stock
or seafood safety. For example, as a precautionary
measure to ensure public safety during and after the
Deepwater Horizon oil spill, large areas of the Gulf
were closed to fishing from May through October
2010.5
In making management decisions such as these,
scientists and managers incorporate multiple types of
fishery–dependent and fishery independent data into
stock assessment models. These models integrate the
processes of natural death, growth, and fishery catch
that affect a fish stock over time.3
Thus, if in a given
year landings data are low, it may not be a lack of fish in
the sea, but that a management action, environmental
condition, or other factor is influencing population
numbers.
LANDINGS AND DISASTERS
Many people have questions about the impacts
disasters have had on fishery populations, and con-
sequently, fisheries as a livelihood. Landings data are
used by natural resource managers, fishermen, and
others interested in the future of fisheries, to monitor
change in populations. When managers incorporate
landings trends into stock assessment models—models
that include other potential influential factors, such
as environmental conditions or regulations—they can
determine if or how disasters impact fishery populations
over time. For example, Figure 1 provides a snapshot of
two Gulf of Mexico commercial fisheries landings from
1991 through 2013, including blue crab and the Eastern
oyster.1,6,7
The timeline also shows the occurrence of
major disasters during that time, highlighting a pos-
3
4. 0
10
20
30
40
50
60
70
1991
1992
1993
1994
1995
1996
1997
1998
1999
2000
2001
2002
2003
2004
2005
2006
2007
2008
2009
2010
2011
2012
2013
Poundslanded(millions)
Blue Crab and Eastern Oyster in the Gulf of Mexico:
Commercial Landings (millions of pounds), 1991-2013 Oyster
Hurricane
Andrew
Hurricanes
Gustav & Ike
Deepwater Horizon
oil spill
Blue crab
Hurricanes
Katrina & Rita
FIGURE 1. Recent disasters show some relationship to landings of blue crab and oysters, but the picture is incomplete.
Managers must depend on additional indicators when assessing the health of the fisheries.6
Images credit: Gulf FINFO6
4
0
1
2
3
4
5
6
7
8
9
10
1991
1992
1993
1994
1995
1996
1997
1998
1999
2000
2001
2002
2003
2004
2005
2006
2007
2008
2009
2010
2011
2012
2013
Poundslanded(millions)
Red Snapper in the Gulf of Mexico: Commercial and
Recreational Landings (millions of pounds), 1991-2013 Commercial Recreational*
Deepwater Horizon
oil spill
Hurricanes
Gustav & Ike
Hurricane
Andrew
Hurricanes
Katrina & Rita
FIGURE 2. Both commercial and recreational red snapper landings are influenced by disasters, but managers must
consider other factors influencing fish population numbers, such as management actions.6,7
Image credit: Gulf FINFO6
*Amount harvested, defined by NMFS as catch brought back to the dock in a form that can be identified by trained interviewers, plus catch used
for bait, released dead, or filleted.7
5. 0
20
40
60
80
100
120
140
160
Shrimp in the Gulf of Mexico:
Commercial Landings (millions of pounds), 1991-2013 Brown
Pink
White
Poundslanded(millions)
1991
1992
1993
1994
1995
1996
1997
1998
1999
2000
2001
2002
2003
2004
2005
2006
2007
2008
2009
2010
2011
2012
2013
Deepwater Horizon
oil spill
Hurricanes
Gustav & Ike
Hurricanes
Katrina & Rita
Hurricane
Andrew
FIGURE 3. Landings of the three main Gulf shrimp species can be affected by disasters, but fisheries managers consider
other factors known to influence shrimp stocks, like weather, when making management decisions.7
Image credit: Gulf
FINFO6
FIGURE 4. Swings in Gulf menhaden landings happen frequently. Fisheries managers consider many factors, like
changing seafood market prices, when drawing conclusions about disaster impacts.7
Image credit: Gulf FINFO6
$0
$20
$40
$60
$80
$100
$120
0
200
400
600
800
1,000
1,200
1,400
1,600
1,800
1991
1992
1993
1994
1995
1996
1997
1998
1999
2000
2001
2002
2003
2004
2005
2006
2007
2008
2009
2010
2011
2012
2013
Landings Dollars
Menhaden in the Gulf of Mexico:
Commercial Landings (millions of pounds) and
Landings Revenue (millions of dollars), 1991-2013
Poundslanded(millions)
Dollarsofrevenue(millions)
Hurricane
Andrew
Hurricanes
Katrina & Rita
Hurricanes
Gustav & Ike
Deepwater Horizon
oil spill
5
6. sible relationship between landings and disasters. In
Figure 1, reported blue crab landings had decreased in
2010, the year the Deepwater Horizon oil spill disaster
occurred. In 2011, after the oil spill, blue crab landings
were reported to increase, which suggests a potential
for recovery after the spill. However, events like oil spills
or hurricanes are only some factors to consider when
interpreting landings data.
Figure 2, for example, provides red snapper landings
data for both the commercial and recreational
sectors.1,6,7
This figure shows changes to this important
Gulf of Mexico fishery over 23 years and includes,
again, potential influential factors like storms and the
Deepwater Horizon spill. From the graph, it appears that
commercial red snapper landings rise and fall relative
to such events. Red snapper landings, however, are
also heavily impacted by annual catch limits. At first
glance, the decrease in red snapper landings illustrated
in Figure 2 would appear to be tied to the 2008
hurricanes. Yet, this is only part of the story; in 2007, a
new Individual Fishing Quota Program (“IFQ,” a type
of catch–share program that dedicates a secure share
of fish to fishermen) was implemented for red snapper,
and the annual catch limit under this program was
significantly reduced in 2008. So, the decrease in 2008
landings could be due to the annual catch limit quota,
and not necessarily the hurricane.
Another example of interpreting landings data within
the framework of disasters is in Figure 3, which
focuses on landings trends of three commercially
important shrimp species in the Gulf of Mexico: brown
(Farfantepenaeus aztecus), white (Litopenaeus
setiferus) and pink (Farfantepenaeus duorarum)
shrimp. It appears that shrimp landings drop when
disasters strike but recover quickly; however, there are
also dramatic drops and rises in landings in years when
major disasters did not occur. Understanding shrimp
life cycles, as well as environmental or climatic factors,
may shed some light on the landings trends. Shrimp
are short-lived and produce an abundance of offspring,
which are dependent on nursery areas for survival.
They are also unique as a fishery in that they can be
caught almost year round (some Gulf states briefly
close shrimping to allow for growth and spawning).6
Thus, shrimp are susceptible to environmental and
climatic changes year round, such as heavy rainfall
in late spring, or northers in winter (a strong, cold,
north wind blowing over the Gulf) (G.Graham, personal
communication, May 13, 2015). These conditions can
impact shrimp productivity, and subsequently, landings
can be impacted. Disaster impacts must be considered
alongside factors like these when interpreting landings
trends.
The fishing industry is well aware that when landings
are at risk of being impacted by disaster, then revenue
from landings is also at risk. One example is the
menhaden fishing industry, which has experienced
negative impacts over its lifetime, mostly attributed
to hurricanes.8
This fishery
is one of the oldest and
most valuable fisheries in
the United States, and a
significant component of
the overall Gulf economy.8
Menhaden are used primarily
for fish meal and oil, and
small quantities are used for
bait. In 2013, Gulf menhaden
landings were valued at
$95.3 million.4
Figure 4
depicts landings and landings
revenue for menhaden, and
how it has changed over time,
relative to some disasters.
Again, several factors must be
considered when interpreting
disaster impacts to landingsBlue crab is fished in shallow coastal waters almost exclusively by traps. Much of the meat is
sold as a fresh, ice-packed product. (Florida Sea Grant photo by Bryan Fluech)
6
7. OIL SPILL SCIENCE
OUTREACH TEAM
Christine Hale
Texas Sea Grant
chris.hale@tamu.edu
Larissa Graham
Mississippi-Alabama Sea Grant
larissa.graham@auburn.edu
Emily Maung-Douglass
Louisiana Sea Grant
edouglass@lsu.edu
Stephen Sempier
Mississippi-Alabama Sea Grant
stephen.sempier@usm.edu
LaDon Swann
Mississippi-Alabama Sea Grant
swanndl@auburn.edu
Monica Wilson
Florida Sea Grant
monicawilson447@ufl.edu
Scientists use a seine net to collect fish near a marsh, another instance of fishery-inde-
pendent data that contributes to our understanding of fisheries in the Gulf of Mexico.
(LUMCON/CWC photo)
revenue, because annual trends vary depending on
the changing state of seafood markets and the overall
global economic market. However, as shown in Figure 4,
menhaden landings and revenue dropped significantly
in 2005 during Hurricane Katrina, and fishery managers
have since attributed that drop to major loss in, and
damage to, infrastructure such as seafood processing
plants and fishing vessels.8
Conclusions like these are
made using many years of fishery–dependent and
fishery–independent data.
EMERGING SPILL SCIENCE
While landings data are significant monitoring tools,
and are baselines for evaluating changes to fishery
populations, they have limitations. As shown in the
previous diagrams, landings data can help identify when
changes occur, and identify potential relationships
between significant events and landings numbers,
but landings data alone cannot identify the exact
cause of change. To better control for biological,
ecological, and other factors involved with population
studies, scientists must conduct fishery–independent
studies to make reliable conclusions about impacts to
fisheries. In doing so, GoMRI scientists are conducting
catch studies as one step in the long-term process of
understanding oil spill impacts to fisheries. For example,
scientists compared data from trawls (fishing using
a custom-made net behind a boat) conducted before
(2006–2009) and after (2010) the Deepwater Horizon
spill.9
Catch rate is the total number or poundage of
fish captured from an area over a set period of time.
They concluded that post–spill, an immediate loss of
young, seagrass–dependent fish, such as spotted sea
trout, pipefish, and gray snapper, among others, did
not occur.9
The scientists noted that the higher catch
rates in 2010 for typically fished species, such as gray
snapper and spotted sea trout, might have resulted
from post–spill fishery closures, a management action
that occurred during the spill.9
Because fishing was not
allowed after the spill, these scientists speculated that
fish populations may have flourished, making oil spill
impacts difficult to identify in catch rate studies such
as theirs.9
If in the long term any impacts from disasters
like Deepwater Horizon are to be revealed, then it is
essential that research and the practice of monitoring
landings continue. Comprehensive ecological and
biological research, bolstered by landings data, is just
beginning to reveal the more complete story on oil spills
and fisheries—and the challenges in understanding the
complex Gulf of Mexico ecosystem as time goes on.
7
8. This work was made possible in part by a grant from BP/The Gulf of
Mexico Research Initiative, and in part by the Sea Grant programs
of Texas, Louisiana, Florida and Mississippi-Alabama. The state-
ments, findings, conclusions and recommendations do not neces-
sarily reflect the views of these organizations.
TAMU-SG-15-504 GOMSG-G-15-005 September 2015
Texas • Louisiana • Florida
Mississippi-Alabama
GLOSSARY
Annual Catch Limits
A type of quota in which fishermen are allowed to
catch a certain amount of fish in one year.
Catch rate
The total number or poundage of fish captured from an
area over a set period of time.
Effort
The amount of time, gear size, boat size, and horse-
power used to harvest fish.
Fish stock
A group of fish of the same species, living in the same
geographic area, and reproducing with each other.
Fisheries
All of the activities involved in catching finfish, shellfish
or seafood.
Fishery–dependent data
Fisheries data collected directly from the commercial
and recreational harvest.
Fishery–independent data
Fisheries data collected by scientists who catch the
fish themselves, rather than depending on fishermen
and seafood dealers.
Individual Fishing Quota Program
A type of catch–share program that dedicates a secure
share of fish to fishermen.
Landings
The quantities, in number or weight, of seafood
unloaded at a dock by commercial fishermen or
brought to shore by recreational fishermen, as
reported to biologists, resource managers, or seafood
dealers.
Landings revenue
The income from bringing fish and shellfish to shore for
sale.
Norther
A strong, cold, north wind blowing over the Gulf.
Quota
The maximum amount of fish that can be caught in a
specified time period, for a fishery.
Stock assessment models
Models that integrate the processes of natural death,
growth, and fishery catch that affect a fish stock over
time.
Trawl
A form of fishing where a net is typically pulled behind
a boat to catch multiple species of fish and sea animals.
REFERENCES
1. NOAA National Marine Fisheries Service. (February, 2014).
Fisheries Economics of the United States, 2012: Economics
and Sociocultural Status and Trends Series. NOAA Tech.
Memo, U.S. Dept. Commerce, NMFS–F/SPO–137. Retrieved
from https://www.st.nmfs.noaa.gov/st5/publication/index.
html.
2. Gunderson, J. Understanding Fisheries Management for The
Great Lakes Fisheries Management Institute. Adapted from
Understanding Fisheries Management: A Manual for Under-
standing the Federal Fisheries Management Process, Including
Analysis of the 1996 Sustainable Fisheries Act, Second Edition,
by R. K. Wallace and K. M. Fletcher. Auburn University and the
University of Mississippi, the Auburn University Marine Exten-
sion and Research Center, the Mississippi–Alabama Sea Grant
Legal Program, and the Mississippi Law Research Institute.
Retrieved August 27, 2015, from http://www.seagrant.umn.
edu/downloads/GLFishMgmt_Final.pdf.
3. National Oceanic and Atmospheric Administration. Fish Stock
Assessment 101. Retrieved August 27, 2015, from http://www.
st.nmfs.noaa.gov/Assets/stock/documents/Fish_Stock_
Assessment_101.pdf.
4. NOAA National Marine Fisheries Service. (September, 2014).
Fisheries of the United States 2013. Retrieved from https://
www.st.nmfs.noaa.gov/commercial-fisheries/fus/fus13/
index.
5. National Oceanic and Atmospheric Administration Southeast
Regional Office. (October, 2010). BP/Deepwater Horizon Oil
Spill: Federal Fishery Closure Frequently Asked Questions.
Retrieved August 27, 2015, from http://sero.nmfs.noaa.gov/
deepwater_horizon/closure_info/documents/pdfs/oil_spill_
closure_faqs_101310.pdf.
6. Gulf States Marine Fisheries Commission. (2014). Gulf FINFO.
Available at http://gulffishinfo.org/Species?SpeciesID=188.
7. National Oceanic Atmospheric Administration Office of Sci-
ence and Technology. (2015). Commercial Fisheries Statistics.
Retrieved from https://www.st.nmfs.noaa.gov/commer-
cial-fisheries/commercial-landings/annual-landings/
index.
8. Gulf States Marine Fisheries Commission. (2015). Gulf Men-
haden. Retrieved from http://menhaden.gsmfc.org/default.
shtm.
9. Fodrie, F. J. & Heck Jr., K. L. (2011). Response of coastal fishes
to the Gulf of Mexico oil disaster, PLoS ONE 6(7), e21609.
doi:10.1371/journal.pone.0021609.
SUGGESTED CITATION
Hale, C., Graham, L., Maung-Douglass, E., Sempier,
S., Swann, L., and Wilson, M. (2015). Oil Spill Science:
Fisheries Landings and Disasters in the Gulf of Mexico.
TAMU-SG-15-504.