HUFFMAN CODING ALGORITHM BASED ADAPTIVE NOISE CANCELLATION
Bajdek-Draft-Paper_submitted-2007-0727_NC07
1. Reno, Nevada
NOISE-CON 2007
2007 October 22-24
Communicating the Noise Effects of Wind Farms to
Stakeholders
Christopher J. Bajdeka
Harris Miller Miller & Hanson Inc.
77 South Bedford Street
Burlington, MA 01803
ABSTRACT
State and local agencies may lack applicable noise criteria and standards for the assessment of
noise impact from wind farms used for the production of electricity, and many decision-makers,
as well as the general public, have limited experience with the noise effects of modern wind
farms. Although largely viewed as environmentally friendly, the wind energy industry does have
its detractors. Some of the information posted on the Internet concerning the noise effects of
wind farms can be misleading. This paper explores several innovative approaches or strategies to
communicate the noise effects of wind farms to decision-makers and the general public including
audibility analyses, Virtual Soundscapes™ b
, and supplemental metrics.
a
Email address: cbajdek@hmmh.com
b
Virtual Soundscapes™ are special recordings HMMH has developed to give listeners a realistic sense of how a
planned facility or project will sound.
1. INTRODUCTION
The American Wind Energy Association anticipates that the wind energy industry is on track to
install over 3,000 megawatts (MW) of capacity nationwide in 2007.1
Many factors are
contributing to the growth of the wind energy industry including higher costs of fossil fuels for
power generation, passage of Renewable Portfolio Standards (RPS) at the state level, growing
public interest in renewable energy, and concerns about carbon emissions and global warming.
Although the wind energy industry is growing and wind farms are becoming more
prevalent in some areas of the country, the general public has limited direct experience with this
technology and therefore is susceptible to misinformation provided by detractors and opposition
groups. As a result, residents and communities may develop a negative attitude toward a wind
energy project under consideration in their locality. Developers and proponents of wind energy
facilities are then challenged to overcome such predispositions.
Managing expectations about the noise effects of a proposed wind farm from the very
outset of a project can alleviate fears for affected communities, counter misinformation floated
by detractors and opposition groups, and educate decision-makers about the noise effects of a
project. This paper provides an overview of the strategies or approaches for communicating the
noise effects of wind farms to a wide variety of stakeholders – from affected communities
(participants and non-participants alike) and decision-makers (including regulatory agencies and
localities), to developers, manufacturers, politicians, and the public. Specifically, this paper
explores the use of audibility analyses, Virtual Soundscapes™, and supplemental metrics.
2. 2. AUDIBILITY ANALYSES
Perhaps more so with wind farms than for other types of projects, the audibility of a wind farm in
a surrounding community can be included as a component of the noise assessment. There are
several reasons for conducting such an analysis. The need or desire to perform an audibility
analysis might have arisen during public outreach efforts. An audibility analysis would help
identify at what locations and at what times of day the wind farm would be heard. In some cases,
an audibility analysis is conducted to demonstrate how ambient wind noise may mask noise from
a proposed wind farm, while in other cases, these analyses can serve to quantify the prominence
of tones, if tones are present.
A. Masking
At times, noise from wind farms can be masked by other sources, such as ambient wind noise,
which consists of aero-acoustic noise generated by atmospheric turbulence and radiated aero-
acoustic noise generated by the interaction of the wind with trees, other ground vegetation, or
man-made structures.2
It has been observed that turbine sound levels and ambient wind noise are both dependent
upon wind speed, and the degree to which wind turbines are masked by ambient wind noise is
dependent upon how each varies with wind speed. In a white paper first published in 2002 and
later amended in 2004, Rogers and Manwell pointed out that “wind noise from large modern
turbines during constant speed operation tends to increase more slowly with increasing wind
speed than ambient wind generated noise.”3
While the precise wind speed at which wind turbine noise is masked by ambient wind noise
varies, there is evidence to suggest that at a wind velocity of 3.5 m/s (7.8 mph) masking of wind
turbine noise by ambient wind noise occurs at frequencies above 500 Hz, when located
downwind of a forest edge.4
Other evidence suggests that noise from wind turbines may be
masked by ambient wind noise at wind speeds above 9 m/s (20 mph).5
However, it is often
difficult to predict levels of wind-induced vegetation noise. While some current methods attempt
to determine the level of masking provided by vegetation noise, those methods assume that the
spectral shape of the turbine noise is similar to that of the ambient noise and “that the temporal
fluctuation of background noise is limited” – conditions that are often difficult to meet.4
Ideally, an audibility analysis requires background noise measurements at a number of
locations throughout the study area prior to construction of the wind farm, where one-third
octave band data are obtained for a variety of wind conditions over a regime of wind speeds that
are consistent with the operating wind speeds of the proposed wind turbine. Note that while one
particular model operates over a range of wind speeds from 4 m/s (9 mph) at cut-in to 25 m/s
(56 mph) at cut-out (as measured at hub height), acoustic data are not obtained at the cut-out
wind speed. Rather, the upper range of wind speeds for which acoustic data are gathered
corresponds to the speed at which 95-percent of the rated (electrical) power output is achieved –
roughly 13 m/s (29 mph) at hub height, in this example.
B. Tonality
In general, aero-acoustic noise from wind is broadband in nature. The predominant sources of
noise produced by a wind turbine are due to the interaction of the wind with the turbine blades
and the tower. Under certain operating conditions, however, some wind turbines may exhibit
tonal characteristics.
In describing the noise effects of wind turbines to community members, it is important to
distinguish between the audibility of tones versus the prominence of tones. For a tone that is
3. audible can be barely audible, and therefore not prominent and not likely to cause increased
annoyance. A prominent tone would be considered to be immediately apparent and a “dominant
element” of a sound. A tone that is audible may or may not be considered prominent or even
noticed, depending on the level of the tone is relative to the adjacent frequency bands.
Manufacturers document the acoustic emissions and tonality of their wind turbines
following the methods and procedures in a standard developed by the International
Electrotechnical Commission (IEC). The purpose of IEC 61400-11 is “to provide a uniform
methodology that will ensure consistency and accuracy in the measurement and analysis of
acoustical emissions by wind turbine generator systems.” Section 8.5 of the standard, “Tonality,”
provides methodology to identify the presence of audible tones.6
The manufacturer must report
“tonal audibilities” wherever the tonal criterion is exceeded. In short, the purpose of the standard
is to ensure that any audible tones that are generated by the turbine under test are disclosed by
the manufacturer.
The IEC standard does not, however, make determinations about the prominence of tones,
or whether they would be considered objectionable in a community setting. Other national and
international standards have been published whose purposes are exactly that. One such standard
was published in 1996 by the American National Standards Institute (ANSI). Annex C of the
ANSI Standard, on page 15, describes the recommended approach to evaluating “Sound with
tonal content.” The annex describes the approach to evaluating “the presence of a prominent
discrete-frequency spectral component (tone).” 7
The International Organization for
Standardization (ISO) Draft International Standard (DIS) ISO/DIS 1996-2.2 includes a method
for assessing the audibility of tones that is consistent with the ANSI standard.8
The term
prominent is used to describe the characteristic of a tone that would be apparent enough to
represent a dominant element of the sound, and be significant enough to potentially affect “long-
term community response.”
For the purposes of evaluating the tonal characteristics of wind turbines in the community,
tones should be characterized as to whether they are prominent according to the ANSI/ISO
definitions, rather than in the context of whether they are simply audible or not. The presence of
tones in the noise signature of a wind turbine may increase one’s ability to detect noise from a
wind farm, and if prominent, the tone may cause adverse community reaction and increased
annoyance.
3. VIRTUAL SOUNDSCAPES™
While there is no substitute for experiencing a wind farm first-hand, many people may not be
able to visit a wind farm because of the extensive distance required for travel. In some cases,
individuals within an affected community might find it difficult, or might lack the motivation, to
visit a wind farm even though one may be within driving distance.9
The use of Virtual Soundscapes™ is gaining popularity to help people understand how a
new sound will be heard in an existing setting. Soundscape demonstrations are developed
starting with binaural recordings of the background environment and then separately, for a newly
introduced source of noise, such as a wind farm or a single wind turbine. Then, the two
recordings are combined differently to represent what residents in different locations would hear
with the proposed facility in operation. The demonstrations are played back through high-quality
headphones to achieve realistic sound. Such demonstrations are useful to help facility designers
understand residents’ perspectives, communicate noise issues accurately and to simulate and
evaluate the benefits of noise abatement options, such as the sound insulation of homes.
It should be noted that two significant technical challenges must be overcome for Virtual
Soundscapes™ to be used for acoustic demonstrations of wind energy projects. Namely, low
4. signal-to-noise ratios must be addressed, particularly if the audio demonstration is to be
representative of a nearby residence, which could be located at relatively significant distances
from the wind farm. Furthermore, for a realistic acoustic experience, the presence (or absence) of
wind in the ear in the binaural recordings must be accounted for in an appropriate manner. The
use of Virtual Soundscapes™ for wind energy projects should be evaluated on a project-by-
project basis.
4. SUPPLEMENTAL METRICS
Recently, increased attention has been given to the use of supplemental metrics for describing
the effects of noise on people. While the current dialog has focused on aircraft noise effects, the
approach could be used for wind energy projects, and perhaps quite effectively.
Over the years, much has been written about the applicability of different noise metrics in
the describing aircraft noise effects, and various noise metrics have been proposed to
supplement, and even replace, the Day-Night Average Sound Level (DNL) as the official metric
for aircraft noise. However, in spite of such proposals, DNL is still used by the Federal Aviation
Administration (FAA). Most other federal agencies dealing with noise also have formally
adopted the DNL noise metric, and in 1992, the Federal Interagency Committee on Noise
(FICON) reaffirmed the appropriateness of DNL. While FAA still requires DNL for use on all of
its noise studies, other noise metrics are being reported and included in FAA noise studies, as a
means to lend additional information and further description of aircraft noise effects. Examples
of other noise metrics that are typically reported in FAA noise studies include the A-weighted
Maximum Noise Level (Lmax) and the Sound Exposure Level (SEL).
The reporting of supplemental noise metrics has increased in recent years because they are
considered to be more easily understood by the public than the DNL. In 2006, Eagan proposed a
novel and straightforward approach for describing aircraft noise effects, whereby the extent of
the effect could be shown graphically, rather than the metric itself.10
For example, rather than
displaying the extent of SEL contours around an airport, a potentially more meaningful display
might be the percent of population likely to be awakened over a typical night – in other words,
display the extent of the effect (awakenings) rather than the extent of the SEL noise metric,
which in practice is used to quantify the likelihood of sleep disturbance.
Supplemental metrics of particular interest for wind energy facilities include annoyance and
rattle.
A. Annoyance
A few recent news stories have told about individuals and communities who live in proximity to
wind farms in the northeast United States and in Japan, and who started to complain about noise
from wind turbines shortly after the facility began operations. The author’s own experience
demonstrates that noise complaints and adverse community reaction can occur even though a
wind farm is operating in compliance with local noise limits.11
In 2004, Pedersen and Waye published a dose-response relationship for the perception of
wind turbine noise, as represented in the following equation.12
( ) ( ) ( )324073.23210413.2321038.4%
2132
−+−∗−−∗= −−
LEQLEQLEQHA (1)
In equation (1), %HA is the percentage of people highly annoyed by noise from a wind
farm, and LEQ is the noise dose expressed in terms of the A-weighted equivalent sound pressure
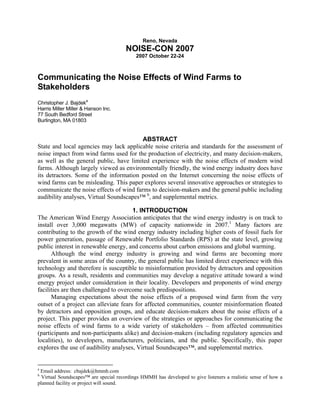
level. The graph of Figure 1 plots this dose-response relationship for wind turbines against the
5. more familiar dose-response relationships for transportation sources, which were developed by
various researchers as noted in the legend of the graph.
0
10
20
30
40
50
60
70
80
20 30 40 50 60 70 80
Noise Exposure Level in A-weighted dB
(Expressed Using DNL for Transportation
Sources and Leq for Wind Turbines)
PercentHighlyAnnoyed
Aircraft: ordinary least squares
(Miedema & Vos, 1998)
Aircraft: multilevel model (Miedema
& Vos, 1998)
Road Traffic: ordinary least squares
(Miedema & Vos, 1998)
Road Traffic: multilevel model
(Miedema & Vos, 1998)
Rail: ordinary least squares
(Miedema & Vos, 1998)
Rail: multilevel model (Miedema &
Vos, 1998)
FICON, August 1992, p. 3-6, Figure
3.1
USAF (1992) (From FICON 1992)
Wind Turbines (Pedersen and Waye,
2004)
Figure 1: Dose-response relationships for transportation sources and wind turbines
As shown in Figure 1, for a given level of noise exposure, wind turbines were found to
produce higher levels of annoyance than transportation noise sources were found to produce. The
graph of Figure 1 also suggests that the percent of people highly annoyed increases more rapidly
if exposed wind farm noise. So why does wind turbine noise appear to generate more annoyance
for a given level of exposure?
In their conclusions, Pedersen and Waye observed that the resultant levels of annoyance
were higher than were initially anticipated. The authors speculated that certain characteristics of
the wind turbine noise, described by the respondents as “lapping, swishing, and whistling,” may
have had some influence on annoyance. They also pointed out that the visual impact of the wind
turbines may have contributed to the reported levels of annoyance.
Pedersen and Waye recommend additional research into dose-response relationships for
wind turbines to further explore the relationship between the visual impact and annoyance. It
should be noted that the majority of respondents in the Pedersen and Waye study (95-percent of
the respondents) did not own or host a wind turbine. In this author’s limited experience, he has
observed that levels of annoyance may be influenced by a land-owner’s participation (or non-
participation) in the wind energy project.
Using the dose-response relationship developed by Pedersen and Waye, the next two
figures illustrate how supplemental metrics could be used to convey the noise effects of a wind
farm. Figure 2 shows the noise exposure contours for a wind farm located in the upper mid-west
of the United States. The noise contours were generated using the noise prediction model,
6. SoundPLAN®
, developed by Braunstein + Berndt GmbH. The noise contours were produced for
full operation of the wind farm, assuming hard ground, no tree attenuation, and omni-directional
sound propagation according to ISO 9613. In this case, the permit application for the wind farm
specified a limit on audible noise of 50 dBA, and also included limits for low frequency noise in
one-third octave bands, as well as definitions of pure tones and provisions for the presence of
pure tones for operation of the wind farm.
Figure 2: Noise exposure contours for a wind farm in an agricultural area with rolling terrain
Figure 3 shows the extent of people highly annoyed by wind farm noise based on the dose-
response relationship given in Equation (1). As shown in the figure, within approximately 0.8 km
(½ mile) of the wind farm, 44-percent of the population would be considered highly annoyed due
to wind farm noise. At a distance of approximately 1.62 km (1 mile) from the wind farm, the
percent of highly annoyed people is expected to drop to 4-percent. Such information could be
useful for developers and/or regulatory authorities during the siting of a wind energy facility
when deciding upon appropriate set-back distances.
7. Figure 3: Extent of people highly annoyed by wind turbine noise
The results of Figure 3 could be compared to the results of a social survey performed for
this same wind farm.13
Figure 4 shows responses to three questions from a social survey
performed in 2001. In the top chart of the figure, 44-percent of the respondents living from
800 feet to ¼ mile of the wind farm stated that the turbines are “causing a problem with noise.”
From approximately ¼ mile to ½ mile from the wind farm, the percentage of respondents
indicating a problem with noise increased to 52-percent. Similar trends are shown in the
responses to questions in the middle and bottom charts of Figure 4. If levels of annoyance were
dependent upon noise exposure alone, it would be reasonable to expect that the percentage of
people saying that there is a problem with noise would decrease with distance from the wind
farm. That is, one might expect that the percentage of people claiming a problem with noise in
the range of ¼ mile to ½ mile from the wind farm would be less than the percentage of people in
the 800 feet to ¼ mile range.
8. It should be noted that the findings of the committee with oversight of the social survey
suggested that the participation of a land-owner in the project may have had an influence in the
elicited response.9, 13
"In the past year, have you been awakened by noise
from the wind turbines?"
0%
25%
50%
75%
100%
800 feet 1/4 mi. 1/2 mi. 1 mi.
to to to to over
1/4 mi. 1/2 mi. 1 mi. 2 mi. 2 mi.
No
Yes
"Are the turbines causing a problem with noise?"
0%
25%
50%
75%
100%
800 feet 1/4 mi. 1/2 mi. 1 mi.
to to to to over
1/4 mi. 1/2 mi. 1 mi. 2 mi. 2 mi.
No
Yes
"Would you support a neighbor's hosting a wind
turbine?"
0%
25%
50%
75%
100%
800 feet 1/4 mi. 1/2 mi. 1 mi.
to to to to over
1/4 mi. 1/2 mi. 1 mi. 2 mi. 2 mi.
No
Yes
Figure 4: Social survey responses relating to wind turbine noise
Note that this author made this simple comparison to illustrate a point and recommends that
additional survey and research be performed to better understand the trade-offs between noise
exposure, visual impacts, and annoyance.
9. B. Rattle
It is generally recognized in the acoustical community that certain A-weighted noise metrics
have been shown to correlate well with levels of annoyance. However, it is also recognized that
A-weighted noise metrics underestimate the potential impact of low-frequency noise, since
people do not hear low frequency sound as well as sound at other frequencies. In such cases, a
comparison of C-weighted and A-weighted noise metrics will provide a rough estimate of the
significance of noise in the low frequencies. It has been suggested that in cases where the C-
weighted noise level generated by a source is 10 to 20 dB greater than the A-weighted noise
level, the source is considered to have low-frequency components.
One study has shown that maximum wall vibration levels correlated strongly with C-
weighted maximum outdoor sound levels.14
In that study, outdoor noise levels and wall
acceleration levels were measured at several residences in the vicinity of an airport. The
measurement results indicated that noise-induced vibrations became perceptible to the touch
when exterior C-weighted maximum levels were higher than 75 to 80 dB(C).
The potential effects of low-frequency noise can be described in terms of the potential for
“rattle.” Wind farm noise levels can be compared to criteria that relate outside sound pressure
levels in 1/3-octave bands to thresholds of perceptible vibration in residential building
structures.15
A comparison of projected wind farm noise levels to these criteria indicate whether
enough sound energy is present in the lower frequencies to excite the residential structures, and
potentially cause rattle inside the home, thereby leading to increased levels of annoyance in the
community. These frequency-dependent criteria relate outside noise thresholds to perceptible
levels of vibration separately for windows, walls, and floors, as shown in Figure 5.
10
20
30
40
50
60
70
80
90
100
110
10 16 25 40 63 100 160
1/3 Octave Band Center
Frequency (Hz)
SoundPressureLevel(dBre:20uPa)
Window s
Walls
Floors
single
turbine @
1000 feet
Figure 5: Projected spectrum for a wind turbine at a distance of 330 meters (1,000 feet) with criterion for
perceptible vibration in residential structures
ACKNOWLEDGEMENTS
The author would like to acknowledge the following Harris Miller Miller & Hanson Inc. staff
members: Christopher Menge for his support and review of the paper, Timothy Johnson for his
noise modeling efforts, and Michael Hamilton for his work in preparing the noise contour and
percent highly annoyed graphics.
10. REFERENCES
1
American Wind Energy Association. Wind Power Outlook 2007. Accessible on the internet at
http://www.awea.org/pubs/documents/Outlook_2007.pdf, July 2007.
2
Wyle Research. Measurement and Evaluation of Environmental Noise from Wind Energy Conversion Systems in
Alameda and Riverside Counties. October 1998, p. 2-6.
3
Rogers A. and J. Manwell. Wind Turbine Noise Issues – A White Paper. Renewable Energy Research Laboratory
Center for Energy Efficiency and Renewable Energy, June 2002, p. 13.
4
Bolin, K. Masking of Sound from Wind Turbines by Vegetation Noise. Proceedings of the First International
Meeting on Wind Turbine Noise: Perspectives for Control, Berlin, October 17th and 18th, 2005.
5
DeGagne, D.C. and A. Lewis. Development of Regulatory Requirements for Wind Turbines in Alberta. Journal of
the Canadian Acoustical Association, Volume 34, Number 2, June 2006, p.27.
6
IEC 61400-11:2002(E). “Wind turbine generator systems – Part 11: Acoustic noise measurement techniques.”
International Electrotechnical Commission.
7
ANSI Standard 12.9-1996 - Part 4, Annex C.
8
ISO/DIS 1996-2.2, Part 2, Annex D.
9
Energy Center of Wisconsin. A Study of Wind Energy Development in Wisconsin: A Collaborative Report. Part 1,
Section A, July 2004, p. 21.
10
Eagan, M.E. Eagan, M.E. Using Supplemental Metrics to Communicate Aircraft Noise Effects. Submitted to
Noise-Con 2006, November 10, 2006.
11
Bajdek, C. Noise Issues and the Siting of Facilities. North American Windpower, Zackin Publications, Waterbury,
CT, Volume 2, Number 3, April 2005.
12
Perdersen, E. and K.P. Waye. Perception and annoyance due to wind turbine noise – a dose-response relationship.
J. Acoust. Soc. Am. 116(6), 3460-3470 (2004).
13
Town of Lincoln. Final Report of the Wind Turbine Moratorium Study Committee. Lincoln Township, WI, Tab 8,
2002.
14
Miller, N.P., E.M. Reindel, D.A. Senzig, and R.D. Horonjeff. Low-frequency Noise from Aircraft Start of Takeoff,
Proceedings Internoise 98.
15
Hubbard, H.H. Noise Induced House Vibrations and Human Perception. Noise Control Engineering Journal,
Volume 19, No. 2, 1982, pp. 49-55.