8377087607, Door Step Call Girls In Kalkaji (Locanto) 24/7 Available
IEEE_Paper_PID2966731 (1).pdf
1. Abstract - In this paper we are describin
for sound detection and analysis
programming language - LabVIEW. Th
cost effective and easy to scale up for
correlation with crispiness of food pro
strength of solid objects with acoustic p
the material is subjected to the force it
sound before it breaks, so by the sound
find the ultimate stress of the material
point is the point at which the material
or a stress strain relationship becomes
kind of study will benefit to find out
various brittle materials when subjec
stress.
Keywords – breaking strength analy
sound detection, stress –strain relation,
I. INTRODUCTION
There are many methods already introduc
analysis of a material. But the breakdown
use of microphone sensor is better method t
stress point of the material. The sound signa
microphone and with the use of the L
generate the waveform of the sound on the
Acquire sound module is available on th
module takes the sound signal from the m
and its output is the graph indicator. Wi
amplitude and level measurement module
can find the positive peak of the sound sign
has a specific value of ultimate stress point
the positive peak is higher than the pre
ultimate stress point(converted into the e
peak value) led will glow on the LabV
indicate the ultimate stress point of the mate
LabVIEW represents a resourceful tool for
of sound analysis software including sound
and sound statistics. Particularly, the inc
flexible numerical processing of different ac
can be considered. The graphical user progr
allows programming without special expe
uses terminology, icons and theories familia
engineers.
Microphone sensor overview : A micropho
to electric transducer or sensor that con
electric signal. Microphone sensors input
output is the voltage. Sound recording and r
microphone is an electrical or mechanical i
S
Low cost Mic
Detection and A
ng useful concept
using graphical
his system is very
establishment of
oducts, breaking
parameter. When
t will generate a
d analysis we can
l. Ultimate stress
is going to break
nonlinear. Such
behavior of the
cted to ultimate
ysis, LabVIEW,
N
ed for breakdown
analysis with the
to find the ultimate
al is acquire by the
LabVIEW we can
LabVIEW screen.
he LabVIEW, this
microphone sensor
ith the use of the
on LabVIEW we
nal. Every material
t so if the value of
edefined value of
quivalent positive
VIEW screen and
erial.
r the development
d signal processing
reasing need for
coustic parameters
ramming language
erience because it
ar to scientists and
one is an acoustic
nverts sound into
is sound and the
reproduction using
inscription and re-
creation of sound waves, such a
effects. The two main types of so
are analog reading and digital re
recording is achieved by a small m
can detect changes in atmospheric
as a graphic representation of the s
such as LabVIEW screen. In
waveform graph tool is available to
microphone.
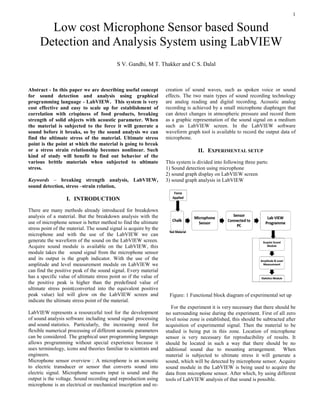
II. EXPERIMENT
This system is divided into followin
1) Sound detection using micropho
2) sound graph display on LabVIEW
3) sound graph analysis in LabVIEW
Figure: 1 Functional block diagra
For the experiment it is very nec
no surrounding noise during the ex
level noise zone is established, this
acquisition of experimental signal
studied is being put in this zone
sensor is very necessary for rep
should be located in such a way
additional sound due to mounti
material is subjected to ultimate
sound, which will be detected by m
sound module in the LabVIEW is
data from microphone sensor. Afte
tools of LabVIEW analysis of that s
S V. Gandhi, M T. Thakker and C S. Dalal
crophone Sensor based S
Analysis System using La
1
as spoken voice or sound
ound recording technology
ecording. Acoustic analog
microphone diaphragm that
pressure and record them
sound signal on a medium
the LabVIEW software
o record the output data of
TAL SETUP
ng three parts:
ne
W screen
W
am of experimental set up
cessary that there should be
xperiment. First of all zero
s should be subtracted after
l. Then the material to be
. Location of microphone
producibility of results. It
y that there should be no
ing arrangement. When
stress it will generate a
microphone sensor. Acquire
being used to acquire the
r which, by using different
sound is possible.
Sound
abVIEW
2. 2
Following system tools of LabVIEW are being utilized in
the present study:
1) Acquire Sound Module:
In acquire sound module, the data is being acquired from a
microphone sensor. This Express VI automatically configures
an input task, acquires data and clears the task after every
acquisition completes. It also specifies the sample rate in
hertz, Sets the number of seconds for which user wants to
acquire sound for analysis, Lists the sound devices you have
connected, Specifies the number of channels. 1 is Mono, and
2 is Stereo, Describes error conditions of system that occur
before this node runs.
2) Amplitude and Level Measurements Module
By using Amplitude and Level Measurements Module,
measurement of the positive peak in signals as well as
negative peak in signals can be effectively calculated.
Measures the mean level of one complete period of a periodic
input signal, Calculates the root mean square value of one
complete period of a periodic input signal, Peak to peak—
Measures the most positive peak to the most negative peak in
Signals.
3) Statistics analysis Module
Statistics Module of LabVIEW is used for sound analysis.
After acquired the sound data, it will provide the information
of arithmetic mean (mean or average of values of the signals).
It also gives information of minimum and maximum point
from the set of values of the signals. Returns the value of the
sum of all the values in Signals, Returns the skewness of the
values in Signals. Skewness is a measure of symmetry and
corresponds to the third-order moment about the mean
III. RESULTS
Case Study-1
Here, we have taken case study of black board Gypsum based
chalk. There are two types of chalks available in market one
is dust less which is having higher breaking strength and
other is normal Gypsum based chalk which is easy to break.
We had fixed chalk at base surface then applied vertical
force, at breaking level it is generating sound pattern as
shown in Fig. 2. From that we are detecting peak value as
shown in Fig. 3. We had carried out experiment three times
and results are shown in table 1. For repeatability of
experiment it is very necessary that force applied at same
point at every experiment.
When the Chalk (Test Material) is subjected to ultimate
stress, it will generate a sound, which will be captured by the
microphone sensor. Acquire sound module of the LabVIEW
software collects the sound data and transfers in to waveform
graphs and waveform charts.
Following figures provides overall information about the
system setup on LabVIEW software:
Figure: 2 Waveform Chart at the time of breaking
Waveform Chart is used to display data typically
acquired at constant rate, when the material is subjected to
ultimate stress. This will generate a sound, using the micro
phone sensor we can detect a sound and wave form chart will
take readings & generate the data simultaneously.
Figure: 3 Positive Peak at Ultimate Stress Level
Positive Peak returns a measurement of the most positive
peak in the signals. It will use to measure the maximum peak
of the sound generated by material when it is subjected to
ultimate stress conditions. Every material has a specific value
of a positive peak. The maximum range of positive peak is 1.
So, if the material crosses the predefined limit; it will
generate the ultimate stress point.
Table: 1 Positive Peak voltage values at the time of breaking.
Material Sr. No.
Reading (Value of a
Positive Peak)
Chalk
1 0.01870
2 0.01896
3 0.02001
Average 0.01922
Table-1 Observation Table
Similar studies can also be carried out for different materials.
Figure: 4 Real time sound acquisition
3. Sound Graph displays one or more plots o
measurements. The waveform graph plots o
functions, as in y= f(x), with points evenly
the x-axis, such as acquired time varying
sound graph displays plots containing any
Above figure displays sound graph of a m
subjected to ultimate stress.
Case Study-2
Breaking sound analysis in noisy environ
task. The data is being acquired from a mic
noisy environment. Noise consisting of s
shaped pulses and lasting for a Microse
hundred milliseconds. The cumulative eff
noise generated can affect the system
presence of noise the breaking sound anal
fig. 5 sound graph represents breaking a
material in Zero noise level zone, and
becomes very easy. And this graph shows
of material when subjected to ultimate stres
Figure: 5 Sound Graph in Zero Noise
Noise signal consider as a random signal.
show the graph of acoustic signal in
environment types 1 and types 2. Breaking
noisy environment. Noise consisting of s
shaped pulses and its captures by microphon
Figure: 6 Sound Graph captured
Noise Environment of Type
In this graph it is difficult to differentiate
generated by material when subjected to fo
of noise. So by Appling proper filtration t
of unwanted noise is possible and breakin
becomes easy.
of evenly sampled
only single-valued
y distributed along
g waveforms. The
number of points.
material when it is
nment is difficult
crophone sensor in
sudden irregularly
econds to several
fect of all random
m performance.in
lysis is difficult.in
analysis of brittle
d sound analysis
the positive peak
s.
Level Zone
Fig. 6 and Fig. 7
n different noise
g sound analysis in
sudden irregularly
ne.
d with
-1
the positive peak
orce and the effect
technique removal
ng sound analysis
Figure: 7 Sound Graph captured w
type -2
Figure: 8 LabVIEW Block Di
3
with noise Environment of
iagram of the System
4. 4
IV. CONCLUSION
In built 3.3 mm jack of sound card is very common system in
PC or Laptop. As the performance to cost ratios for PCs
continues to grow, there will be a great need for PC based
acquisition/analysis systems. These systems can be an
inexpensive Replacement for the costly stand-alone, signal
specific, systems currently in use. Here we have shown cost
effective method for data acquisition system which is very
easy to implement as well as with LabVIEW software it
provides high end signal analysis features. The experience
necessary to program this type of system. Here, we have
shown very basic case study using cost effective microphone
we may use high definition microphone or AED( Acoustic
envelop detector) and make this system very sensitive. In
future scale up this concept will provide better correlation
between intensity of sound with breaking strength. These
developments show cost effective method of sound data
acquisition system. As the speed and reliability of the PC
increases, there will be more and more of such systems
available.
FUTURE SCOPE OF WORK
At present this system was designed only for acoustic
detection using virtual instrument LabVIEW software. This
system can be extended for establishment of correlation
between crispness of food products like biscuits, wafers with
force applied. In such system we can place sample object
between forces applied and Load cell. Load cell output is
connected with microcontroller, Max232 which gives output
serially to computer and then LabVIEW will be used to
acquire force data real time. Microphone system will also
attach in the system which measure real time sound data in
LabVIEW. Hence, such system will provide simultaneously
two data: 1. Sound Data 2. Force data, which gives
mathematical correlation between breaking force and sound.
V. REFERENCES
[1] Bao Mi, Thomas E. Michaels and Jennifer E. Michaels,
“In-situ ultrasonic monitoring of crack growth under
static and dynamic loading conditions”, Society of
Photo-Optical Instrumentation Engineers, Vol. 5767.
[2] F.A. Ravenscroft, K. Newton and C.B. Scruby,
“Diffraction of ultrasound by cracks: comparison of
experiment with theory”, Ultrasonics, 1991.
[3] P.A. Doyle, “Depth measurement for cracks in corners
using ultrasonic Rayleigh waves”, Journal of
Nondestructive Evaluation, 1986.
[4] N Rajic, S.C. Galea, and W.K. Chiu, “Autonomous
detection of crack initiation using surface-mounted
piezotranducers”, Smart Materials and Structures, 2002.
[5] P. Fromme, M.B. Sayir, “Detection of cracks at rivet
holes using guided waves”, Ultrasonics, 2002.
[6] J.D. Achenbach, “Modeling for quantitative non-
destructive evaluation”, Ultrasonic, 2002.
[7] Z. Chang, A. Mal, “Scattering of Lamb waves from a
rivet hole with edge cracks”, Mechanics of Materials,
1999.
[8] Jianshechen, Cathrinekarlsson and Malcolm povey
“acoustic envelope detector for crispness assessment of
biscuits” journal of Texture studies April-2005