1. Swabs v Biopsies
Group average
CB-003-673-A
CB-005-634-A
CB-009-760-A
CB-007-171-A
CB-006-056-A
CB-006-686-A
CB-008-226-A
CB-008-226-A
CB-004-376-A
CB-007-171-A
CB-009-698-A
CB-003-463-A
CB-006-541-A
CB-003-463-A
CB-003-673-A
CB-005-634-A
CB-006-686-A
CB-006-056-A
CB-009-698-A
CB-006-541-A
CB-004-376-A
CB-009-760-A
Samples
10080604020
Similarity
Standardise Samples by Total
Transform: Square root
Resemblance: S17 Bray Curtis similarity
Sample Type
Swab
TissueSwab
Cluster
Biopsy
Cluster
Comparison of microbiota in rectal mucosal biopsies and rectal swabs
Charles Okechukwu1, Amber McCoy2, Felix Araujo-Perez2, Kevin Smith2, Kim Jeremiah2, Gary Asher2, Temitope Keku 2
1. Department of Pharmaceutical Sciences ,University of North Carolina Central University,Durham,NC, USA
2.University of North Carolina at Chapel Hill, Chapel Hill, NC, USA
1. American Cancer Society: Cancer facts & figures 2010.
2. Joe Lertola, Colon Cancer diagram, March 13,2000.
3. Xiang Jun Shen et al, Gut microbes, May/June 2010.
RESULTS
• Compare the microbial signature of rectal biopsies with that of
rectal swabs from the same patient.
RESULTS (cont.)
REFERENCES
ABSTRACT
Colorectal cancer (CRC) is the third most common cancer in the
world. The gold standard for detecting CRC is colonoscopy which
is invasive. Identification of non-invasive markers to stratify risk
would be a major advance. Current research implicates the gut
microbiome in CRC development. In this study, we examined
similarities between bacteria profiles found in human rectal
mucosal biopsies and rectal swabs of the same patients. The
bacterial 16s ribosomal gene Terminal Restriction Fragment
Length Polymorphism (TRFLP) was used to identify bacteria in
the samples. Primer 6 analysis of these profiles demonstrated
statistical differences between the bacterial profiles of biopsies
versus swabs.
METHODS AND MATERIALS
Figure 2. Experimental design
HYPOTHESIS
Comparison of microbial profiles between mucosal biopsies and
rectal swabs from the same patient will show significant similarities.
SUMMARY & CONCLUSIONS
• Results demonstrate that the bacterial communities present in rectal swabs are significantly different
than those found in rectal biopsies.
• Bacterial profiles for swab samples show more diversity than biopsy samples.
• Future studies will evaluate the relationship of bacteria present in swab and biopsy samples with
adenomas.
•In 2010, about 142,570 new cases and 51,370 colorectal
cancer-related deaths were expected1. Pathogenesis begins
with the formation of polyps in the mucosal lining of the
gastrointestinal tract which progresses to intermediate
adenoma stages before terminating in carcinoma. (Figure 1).
• Risk factors include both genetic predisposition and
environmental exposures such as diet, intestinal inflammation,
and specific intestinal bacteria.
• Previous research shows that intestinal bacterial such as
members of Proteobacteria are more prevalent in patients with
colorectal adenomas3.
• Colorectal Cancer deaths are declining because of early
detection and treatment, including regularly scheduled
colonoscopies. Although colonoscopy is invasive and requires
complete bowel cleansing, in addition to the risk of perforation
and bleeding, it has been successful in the early detection of
adenomas, CRC precursors.
• Our research focuses on evaluating the microbiota in
mucosal biopsies in relation to colorectal adenomas. However,
if we could identify non-invasive markers to group people into
risk categories, it would represent a major advance.
SPECIFIC AIM
Acknowledgements: Funding support from the PARTNERS Program and NIH R01 CA136887
INTRODUCTION
Figure 4. Diversity Measures
**There is an increase in species richness , evenness and diversity in swabs compared to
biopsies
Figure 1. Colorectal Anatomy Adapted from Joe Lertola 2
**Individuals seem to cluster based on type of sample (ANOSIM p=0.001)
Figure 3. Cluster analysis of TRFLP profiles of swab and biopsy samples.
0
0.5
1
1.5
2
2.5
3
3.5
Evenness Shannon Diversity
0
10
20
30
40
50
60
Richness
Swab
Biopsy
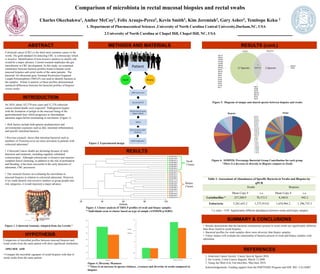
Figure 5. Diagram of unique and shared species between biopsies and swabs.
* p value < 0.05: Significantly different abundances between swabs and biopsy samples.
Table 1: Assessment of Abundances of Specific Bacteria in Swabs and Biopsies by
qPCR
Swabs Biopsies
Mean Copy # s.e. Mean Copy # s.e.
Lactobacillus * 257,280.9 70,372.5 8,340.0 942.2
Eubacteria 5,261,643.2 1,375,914.0 1,654,966.2 1,396,735.3
Figure 6. SIMPER: Percentage Bacterial Group Contribution for each group
*There is a decrease in diversity in Biopsies compare to Swabs