Estimating the proportion of deaths that are unexpected
excelspreadsheet Sheet1
1. Number
of
Procedures 620
Number
of
incidents 30
Percentage
of
incidents
that
occurred 5%
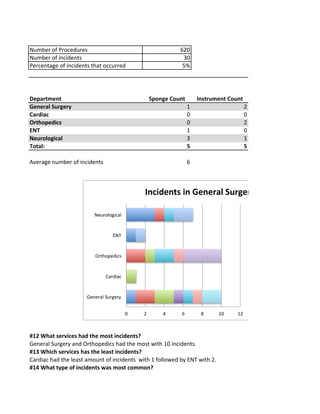
Department Sponge
Count Instrument
Count
General
Surgery 1 2
Cardiac 0 0
Orthopedics 0 2
ENT 1 0
Neurological 3 1
Total: 5 5
Average
number
of
incidents
6
Incidents
in
General
Surgery
0
2
4
6
8
10
12
Neurological
ENT
Orthopedics
Cardiac
General
Surgery
#12
What
services
had
the
most
incidents?
#13
Which
services
has
the
least
incidents?
#14
What
type
of
incidents
was
most
common?
General
Surgery
and
Orthopedics
had
the
most
with
10
incidents.
Cardiac
had
the
least
amount
of
incidents
with
1
followed
by
ENT
with
2.
2. Sponge
Counts
and
Instrument
Counts
were
the
most
common
with
five
incidents
each.
Carolyn
Paduano,
RN,
BSN
NU
509