General and Orthopedic surgery had the most reported incidents, with 10 and 7 incidents respectively. Cardiology had the fewest with only 1 incident reported. Sponge counts and instrument counts were the most common types of incidents, being reported in General, Ortho, Neuro, ENT and evenings/nights. Follow ups were also frequently reported across all services and shifts. In total there were 60 incidents reported for the month.
The pivot table is a powerful tool that can be used to quickly analyze and report departmental, branch, or corporate production activities.
Since the pivot table can be used as standard template, the source data can be replaced daily or monthly. To obtain an updated report you will press the refresh button on your keyboard.
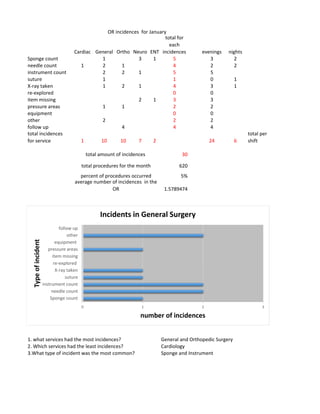
1. Cardiac General Ortho Neuro ENT
total for
each
incidences evenings nights
Sponge count 1 3 1 5 3 2
needle count 1 2 1 4 2 2
instrument count 2 2 1 5 5
suture 1 1 0 1
X-ray taken 1 2 1 4 3 1
re-explored 0 0
item missing 2 1 3 3
pressure areas 1 1 2 2
equipment 0 0
other 2 2 2
follow up 4 4 4
total incidences
for service 1 10 10 7 2 24 6
total per
shift
30
620
5%
1.5789474
1. what services had the most incidences? General and Orthopedic Surgery
2. Which services had the least incidences? Cardiology
3.What type of incident was the most common? Sponge and Instrument
total amount of incidences
total procedures for the month
percent of procedures occurred
average number of incidences in the
OR
OR incidences for January
0 1 2 3
Sponge count
needle count
instrument count
suture
X-ray taken
re-explored
item missing
pressure areas
equipment
other
follow up
number of incidences
Typeofincident
Incidents in General Surgery