1. Date: 03.05.2016
~ 1 ~
Brembo Spa
Italy | Autos & Parts
INCREASE
Target Price: Current Price: Carlo Contino
€57.30 €46.91 carlo.contino01@icatt.it
(22.14% Upside) +33 626472872
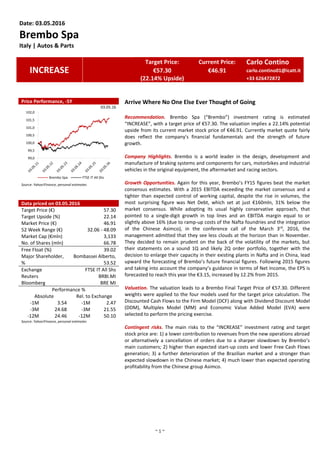
Price Performance, -5Y
03.05.16
Source: Yahoo!Finance, personal estimates
Data priced on 03.05.2016
Target Price (€) 57.30
Target Upside (%) 22.14
Market Price (€) 46.91
52 Week Range (€) 32.06 - 48.09
Market Cap (€mln) 3,133
No. of Shares (mln) 66.78
Free Float (%) 39.02
Major Shareholder,
%
Bombassei Alberto,
53.52
Exchange FTSE IT All Shs
Reuters
Bloomberg
BRBI.MI
BRE MI
Performance %
Absolute Rel. to Exchange
-1M 3.54 -1M 2.47
-3M 24.68 -3M 21.55
-12M 24.46 -12M 50.10
Source: Yahoo!Finance, personal estimates
Arrive Where No One Else Ever Thought of Going
Recommendation. Brembo Spa (“Brembo”) investment rating is estimated
“INCREASE”, with a target price of €57.30. The valuation implies a 22.14% potential
upside from its current market stock price of €46.91. Currently market quote fairly
does reflect the company's financial fundamentals and the strength of future
growth.
Company Highlights. Brembo is a world leader in the design, development and
manufacture of braking systems and components for cars, motorbikes and industrial
vehicles in the original equipment, the aftermarket and racing sectors.
Growth Opportunities. Again for this year, Brembo’s FY15 figures beat the market
consensus estimates. With a 2015 EBITDA exceeding the market consensus and a
tighter than expected control of working capital, despite the rise in volumes, the
most surprising figure was Net Debt, which set at just €160mln, 31% below the
market consensus. While adopting its usual highly conservative approach, that
pointed to a single-digit growth in top lines and an EBITDA margin equal to or
slightly above 16% (due to ramp-up costs of the Nafta foundries and the integration
of the Chinese Asimco), in the conference call of the March 3rd
, 2016, the
management admitted that they see less clouds at the horizon than in November.
They decided to remain prudent on the back of the volatility of the markets, but
their statements on a sound 1Q and likely 2Q order portfolio, together with the
decision to enlarge their capacity in their existing plants in Nafta and in China, lead
upward the forecasting of Brembo’s future financial figures. Following 2015 figures
and taking into account the company’s guidance in terms of Net Income, the EPS is
forecasted to reach this year the €3.15, increased by 12.2% from 2015.
Valuation. The valuation leads to a Brembo Final Target Price of €57.30. Different
weights were applied to the four models used for the target price calculation. The
Discounted Cash Flows to the Firm Model (DCF) along with Dividend Discount Model
(DDM), Multiples Model (MM) and Economic Value Added Model (EVA) were
selected to perform the pricing exercise.
Contingent risks. The main risks to the “INCREASE” investment rating and target
stock price are: 1) a lower contribution to revenues from the new operations abroad
or alternatively a cancellation of orders due to a sharper slowdown by Brembo’s
main customers; 2) higher than expected start-up costs and lower Free Cash Flows
generation; 3) a further deterioration of the Brazilian market and a stronger than
expected slowdown in the Chinese market; 4) much lower than expected operating
profitability from the Chinese group Asimco.
99,0
99,5
100,0
100,5
101,0
101,5
102,0
Brembo Spa FTSE IT All Shs
2. ~ 2 ~
CONTENTS
I. Business Description
a. World leader in the high-performance braking systems
II. Company Milestones
a. From a small mechanical workshop to a global leader
III. Industry Overview
a. Growing with the automotive market
b. Future drivers
c. Porter’s Five Forces analysis
d. Macroeconomic outlook
IV. Brembo Strategy
a. Core products for highly specialized players
b. SWOT analysis
c. Corporate governance
V. Financial Ratios analysis
a. Brembo in numbers: -5Y Financial Statements evolution
i. Balance Sheet
ii. Income Statement
iii. Statement of Cash Flows
VI. Valuation
a. Models, main assumptions and Brembo Final Target Price
i. Discounted Cash Flow to the Firm model (DCF)
ii. Dividend Discount Model (DDM)
iii. Multiples Model (MM)
iv. Economic Value Added model (EVA)
v. Brembo Final Target Price
VII. Investment Intangibles
a. Internal dealings analysis
VIII. Investment Risks
a. Brembo Risk Management framework
i. External
ii. Strategic
iii. Operating
iv. Financial
3. ~ 3 ~
Business
Description
A modern company
with international
vision
Business segmentation
and Geography
footprint
I. Business Description
a. World leader in the high-performance braking systems
Brembo is the world leader in the production of high-performance braking systems for passengers
cars (PC) (74.5% of 2015 Revenues), commercial vehicles (CV) (10.0% of 2015 Revenues), motorbikes
(9.4% of 2015 Revenues) and racing (6.0% of 2015 Revenues). The company operates in 15 Countries
and 3 Regions through its production and business sites, and employs over 7,800 people worldwide.
Over its 50-years history, its strong commitment to Research & Development (R&D) (spending 6.6%
of Revenues spent in the last 3 years) has enabled the company to establish its technological
leadership, becoming the sole supplier of important brands like Ferrari, Porsche, Maserati and
Lamborghini, as well as the leading operator in racing (today equipping important F1 teams like
Mercedes, Ferrari and Red Bull, and top MotoGP pilots including Jorge Lorenzo).
Brembo operates in both the Original Equipment (OE) market and the aftermarket. Brembo’s range of
products for the PC application and the CV application includes brake discs, brake calipers, the side-
wheel module and increasingly often the complete braking system, including integrated engineering
services. All this wide menu of products backs the development of new models produced by vehicle
manufacturers. Manufacturers of motorbikes are also offered brake discs, brake calipers, brake
master cylinders, light-alloy wheels and complete braking systems. In the aftermarket, Brembo offers
in particular brake discs, in addition to pads, drums, brake shoes, drum-brake kits and hydraulic
components: a vast and safe range of products allows the company to meet the needs of nearly all
European vehicles. Brembo also is a specialist in the design and manufacture of clutch systems for
racing vehicles and the passive safety segment (seats, seat belts and accessories).
Within the market of Autos & Parts, Brembo’s business activities are well diversified, both in the OE
market and the aftermarket. Looking at business segmentation, PC accounts for the lion’s share, with
75% of Revenues last year. As for geographies, Germany is still so far the single biggest market for the
company thanks to its 23% of Revenues in 2015; Europe is the biggest Region, making up 57% of the
total.
Exhibit 1: FY15 Revenues Breakdown by Business Unit and Geography
Source: Company data, personal estimates
PC
75%
CV
10%
Motorbike
9%
Racing
6%
Others
0.1%
Nafta
29%
Germany
23%
RoEU
22%
Italy
12%
Asia
10%
South
America
3%
RotW
1%
4. ~ 4 ~
Company
Milestones
1961 – 1980
1980 – 1990
1990 – 2000
2000 – 2010
Focusing on the last 5 years (graphs below), the Net Sales’ model by business unit (BU) and by
Geography has remained stable in almost every part of it. The two main drivers of the Revenues were
PC and Nafta, thanks to their robust CAGR of 18% and 26%, respectively, over 2011-2015, versus 13%
for the whole Group.
Exhibit 2: FY15 Revenues Breakdown by BU
Source: Company data, personal estimates
Exhibit 3: FY15 Revenues Breakdown by Geography
Source: Company data, personal estimates
II. Company Milestones
a. From a small mechanical workshop to a global leader
Brembo was found in 1961 as a small mechanics garage run by the current president’s father Emilio
Bombassei. Its first customers were since the beginning important names of the automotive market
(for instance, Alfa Romeo). In 1964, Brembo became the first Italian manufacturer of brake discs for
the aftermarket, and in 1972 it began to supply the European motorcycle sector. In 1975, its high
technological standards were rewarded when it added the Ferrari Formula 1 car to its client list.
In 1980, as part of its move into specialist niche markets, Brembo introduced the innovative
aluminum brake caliper, later adopted by clients such as Porsche, Mercedes, Lancia and BMW. A few
years later, Brembo began to manufacture brake discs for industrial vehicles, supplying Iveco, Renault
Industrial Vehicles and Mercedes. In 1983, the US multinational Kelsey-Hayes acquired a share in
Brembo, while leaving its strategic control in the hands of the Italian management and shareholders.
At the end of 1992, Brembo’s strategic ambitions began to diverge from those of its parent company
Kelsey-Hayes. Brembo’s management led Alberto Bombassei, son of the founder Emilio and co-
founder of the company, reacquired 100% of the shares in the company in March 1993. In 1995, with
a total of 1,115 employees and an annual turnover of ITL 331bn (circa €171mln), Brembo was listed
on the Milan Stock Exchange.
Brembo expanded its international presence further with the arrival of the new millennium. It took
12%
14%
16%
18%
20%
0
250
500
750
1.000
1.250
1.500
1.750
2011 2012 2013 2014 2015
PC CV Motorbike
Racing Others PC growth
EUR mln
10%
15%
20%
25%
30%
35%
40%
0
175
350
525
700
2011 2012 2013 2014 2015
Nafta Germany RoEU
Italy Asia South America
EUR mln
5. ~ 5 ~
2010 – Present
Present – Future
Eastern Europe
China
Nafta
over companies in Brazil and UK, as well as in Italy. Furthermore, the company signed joint venture
agreements that took over the company’s manufacturing network to South Africa (2000), China (2001
and 2005) and India (2005).
In 2001, Brembo established a 27%-owned joint venture, Nanjing Yuejin Automobile Brake System
(NYABS), with the NAC Group, the Chinese automotive company that took over MG Rover. At the
beginning of February 2008, Brembo increased its stake in the joint venture to 70% by acquiring 42%
from NAC.
In 2003, Brembo and Daimler Chrysler AG established a joint venture for the manufacture of ceramic
brake discs located near Brembo’s head quarter in Stezzano (Bergamo). In January 2005, Brembo
began to manufacture the brakes for the Harley-Davidson 2006 VRSCR-Streetrod platform, followed a
new platform in 2007, making it the brake supplier for 50% of Harley-Davidson’s output.
In September 2007, Brembo announced a joint venture with Italian company Sabelt for the further
development of Sabelt’s child and premium seats and Brembo’s braking systems for car and
motorcycle tuning businesses. In November, it bought Hayes-Lemmerz’s brake division in the US, to
gain a presence in the world largest market and increase its US dollar cost base. In the meantime,
Brembo inaugurated the new R&D center in the Kilometro Rosso Technology and Science Park, which
employs over 500 engineers, designers and technicians working on R&D.
2009 was another landmark year, when Brembo inaugurated its new plant in India for the production
of braking systems for motorcycles and scooters, and launched the new brand Bybre (an abbreviation
of “By Brembo”) dedicated to braking systems for scooters and small-mid engine size motorcycles (up
to 250 cc) for the BRIC markets (Brazil, Russia, India and China) and other countries in South East Asia
(ASEAN).
After investing in Poland in 2006 opening its third foundry in Dabrowa Gornicza to optimize the
production cycle of the disc manufacturing plant, Brembo's activities in Eastern Europe were further
consolidated in 2010 with an investment of over €35mln in the Czech Republic for a new automobile
braking system plant. This move brought the company for the first time into the luxury and premium
segment, working with clients such as Land Rover, BMW, GM and Audi.
2015 has seen more investments aiming at increasing the production capacity of the plants of
Dabrowa Gorinicza (Poland) and Ostrava-Hrabova’ (Czech Republic), dedicated to casting and
machining of brake discs for PC and CV, and the merger, processing and assembly of brake calipers
and other aluminum components, respectively. At the same time, continues the investment package
of €34mln for the construction of a new plant in Niepolomice (Poland), dedicated to the processing of
steel bells to be mounted on light discs.
In China, where Brembo is already strongly present with production plants and well-known brand, the
company acquired the majority stake (66%) of Asimco Meilian Braking System Co. Ltd., Chinese
company owning a foundry and a facility for machining cast iron brake discs and providing the auto
makers in the Region, mainly represented by joint ventures between Chinese companies and the
major European and US players. The operation to acquire Asimco was finalized the September 25th
,
2015, and its effects on the Brembo financial statement are forecasted to show up in 2Q16.
In 2014, North America was confirmed as a target market in the process of internationalization being
undertaken by the company. Brembo inaugurated its plant in Michigan to produce brake systems for
its main automotive customers in the North American market.
Immediately afterwards, Brembo announced the start of the construction of a cast iron foundry in
Michigan, in an area adjacent to the new plant in Homer, commencing the process in the US of
vertical integration of production capacity. The foundry, together with the technical departments and
the warehouse, will cover an area of 30,000 square meters and overall will provide 250 new jobs at
the offices in Homer and Plymouth.
Finally, work was begun in 2015 on the construction of a foundry and a new plant for the production
of aluminum calipers in Escobedo, Nuevo Leon, near Monterrey in Mexico. The plant began
production this year and will be fully operational by the end of 2018. Production at the new site will
be dedicated to the main European, Asian and US OE Manufacturers (OEMs) already present or about
to establish manufacturing facilities in Mexico, as well as to those buyers of Brembo products in the
United States.
6. ~ 6 ~
Industry Overview
PC and CV markets
Exhibit 4: Revenues Forecasted by BU and Geography
BU
(€mln)
2015A 2016E 2017E 2018E 2019E 2020E
CAGR
'16-'20 (%)
PC 1,546.2 1,691.3 1,826.6 1,963.6 2,101.0 2,237.6
7.2% of total 74.6% 75.1% 75.6% 76.0% 76.5% 77.0%
% change 18.8% 9.4% 8.0% 7.5% 7.0% 6.5%
CV 207.0 223.6 237.0 248.9 261.3 271.8
5.0% of total 10.0% 9.9% 9.8% 9.6% 9.5% 9.4%
% change 10.4% 8.0% 6.0% 5.0% 5.0% 4.0%
Motorbike 193.9 207.4 216.8 227.6 239.0 248.6
4.6% of total 9.4% 9.2% 9.0% 8.8% 8.7% 8.6%
% change 11.6% 7.0% 4.5% 5.0% 5.0% 4.0%
Racing 124.9 128.0 131.9 134.5 137.2 140.0
2.2% of total 6.0% 5.7% 5.5% 5.2% 5.0% 4.8%
% change -4.7% 2.5% 3.0% 2.0% 2.0% 2.0%
Others 1.2 2.9 5.1 10.0 7.2 7.0
24.6% of total 0.1% 0.1% 0.2% 0.4% 0.3% 0.2%
% change -86.7% 139.1% 75.9% 96.1% -28.0% -2.8%
Total Net Sales 2,073.2 2,253.3 2,417.4 2,584.6 2,745.7 2,904.9
6.6
% change 15.0% 8.7% 7.3% 6.9% 6.2% 5.8%
Geography
(€mln)
2015A 2016E 2017E 2018E 2019E 2020E
CAGR
'16-'20 (%)
Nafta 601.8 662.0 701.7 764.9 826.0 883.8
7.5% of total 29.0% 29.4% 29.0% 29.6% 30.1% 30.4%
% change 30.0% 10.0% 6.0% 9.0% 8.0% 7.0%
Germany 481.4 517.5 548.6 578.8 610.6 644.2
5.6% of total 23.2% 23.0% 22.7% 22.4% 22.2% 22.2%
% change 11.2% 7.5% 6.0% 5.5% 5.5% 5.5%
RoEU 452.2 481.5 502.9 527.5 554.5 582.9
4.9% of total 21.8% 21.4% 20.8% 20.4% 20.2% 20.1%
% change 11.0% 6.5% 4.4% 4.9% 5.1% 5.1%
Italy 247.7 250.1 260.1 270.5 278.6 287.0
3.5% of total 11.9% 11.1% 10.8% 10.5% 10.1% 9.9%
% change 2.3% 1.0% 4.0% 4.0% 3.0% 3.0%
Asia 214.1 284.3 350.0 392.6 427.4 458.1
12.7% of total 10.3% 12.6% 14.5% 15.2% 15.6% 15.8%
% change 28.2% 32.8% 23.1% 12.2% 8.9% 7.2%
South America 62.5 43.7 39.4 35.4 33.7 33.7
-6.3% of total 3.0% 1.9% 1.6% 1.4% 1.2% 1.2%
% change -21.0% -30.0% -10.0% -10.0% -5.0% 0.0%
RotW 13.6 14.0 14.5 14.9 15.3 15.8
3.0% of total 0.7% 0.6% 0.6% 0.6% 0.6% 0.5%
% change 14.9% 3.0% 3.0% 3.0% 3.0% 3.0%
Total Net Sales 2,073.2 2,253.3 2,417.4 2,584.6 2,745.7 2,904.9
6.6
% change 15.0% 8.7% 7.3% 6.9% 6.2% 5.8%
Source: Company data, personal estimates
III. Industry Overview
a. Growing with the automotive market
The automotive industry is known to be sensitive to business cycle. Sales are typically mainly
dependent on financing. For this reason, the Country/Region economic conditions are key drivers for
this market: when they are favourable, people can count on more money to spend to buy cars, while
companies are more likely to purchase new vehicles for their business, giving momentum to the
industry; when a slowdown in the economic output appears, it reduces consumer and business
confidence and the levels of vehicle consumption goes down.
Other important drivers for the automotive market are technological innovation and regulation: the
former, because the emissions and recycling legislation could create painful increase in
manufacturing costs; the latter, because it helps companies in adding value to their vehicles and then
in offsetting the squeeze on costs and profit margins.
Worldwide registrations of PCs and light CVs grew by 3.3% to 82.4mln units. Driving this outcome
were once again the two mainstays largest automobile markets: US and China. For instance,
registration figures in China increased only last year by 8.9% to 20.5mln units. Although this number
points to a weaker performance than the previous year, the Chinese market nevertheless increased
the gap between itself and the US market, which grew in the same period by 5.7% to 17.5mln units.
Refocusing on Europe, automobile markets picked up where they had left off the previous year,
growing by 9.2% (14.2mln units) in 2015. Excluding registrations in Germany, the European market
fared slightly better with a 10.3% increase to 11.0mln units. The German automobile market grew by
5.6% to 3.2mln units, accounting for nearly a quarter of all new registrations in Europe (22.6%).
France (1.9mln units; +6.8%) and Italy (1.6mln units; +15.5%) both saw robust growth, which also
7. ~ 7 ~
Motorcycle market
Racing market
Mobility culture
contributed to the recovery. Europe’s growth was further sustained by a repeated dynamic
performance in Spain (1.0mln units; +20.9%). Registrations in the United Kingdom were 6.3% higher
at 2.6mln units. Japan’s automobile market contracted in 2015, with new registrations falling and
totalling only 4.9mln units (-9.8%).
In 2015, automobile markets in major emerging economies continued to suffer from recession. The
Russian market shrank by more than one-third (1.5mln units; -36.0%) and the Brazilian market by a
good quarter (2.5mln units; -25.7%).
In this landscape, Brembo’s Revenues from automobile markets stood at €1,753.2mln, 75% of
Brembo Total Revenues, increasing by 17.7% from FY14.
Exhibit 5: New Passenger Cars Registration Growth vs Brembo’s Sales Growth
Source: OICA database, Company data, personal estimates
Focusing specifically on the PC segment, the graph above shows the very stable trend of the company
during years of recovery for the industry and turmoil in the capital markets. All this factor combined
strengthen the strong and mature positioning in the automotive market of Brembo’s first BU per
Revenues (€1,546.2 in FY15, 75% of the total, CAGR ’11-‘15 of 17.6%).
Europe, US and Japan were in 2015 the three most important market for Brembo in this market. The
world’s motorcycle markets in the 500 cc plus class grew by 4.7%. Motorcycle registrations in Europe
were up by 8.5%, mainly due to a sharp recovery in southern Europe. Italy recorded double-digit
growth, with registrations increasing by 11.3%. Germany’s motorcycle market reported a 4.5%
increase, while France finished at a similar level to the previous year (+0.3%).
In the US, registration of motorcycles, scooter and All-Terrain Vehicles (ATV) increased from 2014 by
2.2%. Japan market fell in 2015 by 10.6% but, considering only the two-wheels vehicles with more
than 50cc, the gap is narrowed to 4.8%.
Brembo’s Revenues in this market accounted for €193.9mln, 9.4% of Brembo Total Revenues,
increasing by 11.6% from FY14.
Brembo maintained (and it is maintaining also nowadays) undisputed supremacy for years in this
market. It operates through three leading brands: 1) Brembo Racing, braking systems for race cars
and motorbikes; 2) AP Racing, braking systems and clutches for race cars; 3) Marchesini, magnesium
and aluminium wheels for race motorbikes.
Brembo’s Revenues from racing market stood at €124.9mln, 6.0% of Brembo Total Revenues,
decreasing from 2014 by 4.7%. This negative change has to be attributed mainly to the quitting from
the consolidation perimeter of Sabelt Spa and Belt & Buckle Sro (June 12th
, 2015). If nothing changed,
instead of having a drop, Brembo would have accounted an increasing in value by 10.8%.
b. Future drivers
A clear trend arising in the market is about concerns over vehicle quality after several high-profile
product recalls (for instance, Volkswagen and Dieselgate case), with more and more customers now
seeking vehicles with longer lifespans. OEMs have to maintain a careful balance between product
quality and cost optimization. The intense cost pressures on suppliers in recent years, combined with
the increased use of platform strategies, have raised the risk of quality problems. Markets of all levels
-10%
-5%
0%
5%
10%
15%
20%
2011 2012 2013 2014 2015
Brembo Europe Nafta Asia All countries
8. ~ 8 ~
Technological fit
Porter’s Five Forces
analysis
First category
Second category
of maturity are seeing growing demand for state-of the-art technology in vehicles. The relatively low
priority assigned to connectivity does not resonate with the growing consumer expectation of
ubiquitous access to mobile online services.
Although fuel cells electrical vehicles have moved ahead of battery electric systems to become the
number two priority for investments, the day when most of the population will drive fully electric cars
is still on the distant horizon. It is expected that less than one in 20 vehicles produced are forecast to
be equipped with electrified powertrains, the majority of which will be only slightly electrified full or
partial hybrids. However, the future shift on this segment has to be taken in serious account by car
makers: China aspires to leapfrog rivals to become the premier market for e-mobility. Vehicle and
battery cell production is still in its early stages, with a need for Chinese firms to improve capabilities
in design and development of core e-vehicle components. Current electric models from domestic
OEMs have not proven particularly popularity among consumers. Regardless of these humble
beginnings, China has by far the world’s largest R&D budget, indicating a patient, mid-to-long-term
perspective. Growing pressures from air pollution, rising fuel costs, strict emission standards, and
rapid urbanization should ensure that the huge potential for electric cars is eventually realized,
although this will require further innovation and disruption across the automotive eco-system.
c. Porter’s Five Forces analysis
Porter’s 5 Forces model could give a more accurate idea of the environ in which Brembo operates,
outlining the different powers and threats that could affect this market.
The milestones of this landscape are essentially three: 1) the role played by new entrants versus the
already playing firms; 2) the power of firms supplying Brembo with their products versus the ones
that buy from Brembo the final product; 3) finally, the central point of all the forces acting in the
market is the level of the Competitive Rivalry.
Starting from the beginning, the access to this market is narrowed by many factors which the most
severs are huge barriers to entry, meaning:
need of having a very well-known brand to get a chance to step up among competitors;
high R&D costs to produce increasingly high-performance and eco-compatible brake systems
using technology innovations and increased value-added content (for instance, electronics or
advanced materials);
long-term oriented supplier alliance and business relationship;
Asian companies globalization;
Government stringent policy (for instance, environmental policies).
In such a landscape, there is a Low probability of entry into the market of new participants.
On the other hand, there is a Low/Medium probability the threats for the companies acting in the
market of seeing its own products replaced with products of the other outstanding firms. This aspect
is mitigated by the very nature of the contracts (generally of long-term). Focusing on the products
offered, it is possible to notice that some of them are actually mainstream, meaning that these are
produced also by the company competitors. This could lead to the situation where, once the supply
contract is expired, the customer choose to sign the new supply contract with another company (one
of the competitors). Although this apparently could be seen as a dangerous threat, it is mostly
mitigated by the reasoning that, through the switching operation, the customer would have to start
everything from the beginning (for instance, adapting the new brake systems to his/her company’s
car models), leading to painful consequences for his/her company.
The second category is represented by suppliers’ and buyers’ power. The power of suppliers has a
Medium force: the market under analysis is very keen to the deliver of the highest quality possible.
Because of this common behavior, the companies typically are dependent on strategic suppliers
(Brembo has only two main supplier companies) and, together with the volatility of raw materials
(the two faces of the supply chain risk), could jeopardize the companies’ production process and
ability to fill orders from clients in a timely manner by suddenly suspending supply arrangements.
Aligned with the precedent analysis, the power of the buyers of the companies’ products has a
Medium force too. It is essentially due to the customers high expectations (willing to buy the best
product on the market) and to the easing for them to have access to information that enable them to
have a more clear idea of the characteristics that the product needs to have to be perceived as
9. ~ 9 ~
Third category
Macroeconomic
outlook
“excellent”.
The place in which all the forces strike one against the other is the Competitive Rivalry field: it is
remarkable, with a Medium/High power due to the fact that the market is well-establish and, by
quitting the market, this would lead to devastating consequences for the companies taking this
decision. Being dynamic, globalized and cost-efficient are the standards, the key aspects of these
players that use the launch of new technology as the key point of their development strategy.
Exhibit 6: Brembo’s Market Porter’s Five Forces Analysis
Source: Company data, personal estimates
d. Macroeconomic outlook
In order to contextualise the performance of the company and to try to forecast possible future
scenarios which Brembo would have to deal with, it occurs to describe the nowadays macroeconomic
landscape.
The World Output1
in 2015 is estimated to increase by 3.1%, a sensible contraction from the 3.4%
registered in the 2014. This was mainly (but not only) driven by a sensible slowdown of the emerging
economies (from the 4.6% of the 2014 to a 4% in 2015). In facts, for the fifth year in a row, it has been
registered a slowdown of the growth rate for them, while it has been registered a little-by-little
recovering of the advanced economies.
With regard to the three main areas Brembo is operating in, the Eurozone registered a significant
0.7% of growth in the GDP, augmenting at 1.5% the prevision of growth for 2015. This result was due
mainly to a decrease in oil price and an increasing easing in get financed. The US registered a GDP
increase of 2.5%. Although the previsions for the following years are of only a 0.1% more than 2015
(up to 2.6% for both 2016 and 2017), the US have an economic stability, real estate and labour
market reputed strong. Last but not least, Chinese economy registered a 6.8% growth (the lowest
since 2009) mainly due to financial sector turmoil.
1 World Economic Outlook Update, International Monetary Fund, January 2016.
0
1
2
3
4
5
Competitive Rivalry
Threat of New Entrants
Suppliers' PowerThreat of Substitutes
Buyers' Power
Power intensity
10. ~ 10 ~
Brembo Strategy
Globalization
Differentiation
Exhibit 7: GDP Growth Rates’ Projections
Source: International Monetary Fund, personal estimates
IV. Brembo Strategy
a. Core products for highly specialized players
The strategy carried on by this niche-player in the brake market is twofold: globalization and product
differentiation are the key strengths for this company.
The globalization is quite a serious argument at Brembo. The company wants continue its
international expansion to establish a presence in the countries where the company’s main clients
have production plants. This big schema is designed with the clear idea of trying to resolve an
important exigence for each company: efficiency maximisation. By becoming a global player with the
capacity of supply its client more rapidly and more efficiently with its products, Brembo is little-by-
little gaining importance in the worldwide scenario. To give more robust basis to its ambitions, in
2015, Brembo’s investment management policies were further developed along the lines followed in
the past several years, aiming to strengthen its presence in Italy and, above all, internationally. The
most significant investments were concentrated in North America (40%), Italy (27%), Poland (15%),
China (9%) and the Czech Republic (6%). Brembo’s Total Investments undertaken in 2015 at all BUs
amounted to €160mln.
Exhibit 8: Globalization – Industrial Sites
Source: Company website
But the globalisation strategy would turn in nonsense without a serious commitment to quality and
technology advancement, the key pillars for Brembo: they are in the market from more than 50 years
and one things that it is well-known is that you cannot grow in this market without shaping the
history of your industry by yourself. It is for this reason that the company is investing each year an
average of 5% of its Total Revenues (FY15 R&D costs: €103.7mln), to develop the most advanced cast-
iron discs, technological alternatives for the manufacture of ceramic discs carbon for motorbike
0%
2%
4%
6%
8%
2014 2015 2016 2017
China World Output United States Euro Area
11. ~ 11 ~
segment and new carbon material for F1 and GT applications. Moreover, the company has in its
pipeline another ambitious goal: being a supplier for aeronautical parts. In the words of the company
management, this could arrive before the end of the 2016.
Exhibit 9: -5Y Investments
Source: Company data, personal estimates
Exhibit 10: Differentiation – Brembo Products
Source: Company website (From the left: calliper, disc, module, carbon-ceramic disc, aluminium part)
-80%
-40%
0%
40%
80%
120%
-115
-58
0
58
115
173
2011 2012 2013 2014 2015
Total investments Growth %
EUR mln
12. ~ 12 ~
SWOT analysis
Corporate governance
b. SWOT analysis
The SWOT analysis has been performed to map Brembo’s business from all the angles: internal and
external resources and threats, exploring new initiatives and identifying possible areas for change.
Strengths
• Global player with highly-diversified
product portfolio
• Specialization in top-to-end segments
means stable resilience and growth
• Brand-technological excellence
• Skilled workforce
Weaknesses
• Only two suppliers for the raw
materials
• Great exposure to Emerging
markets
• Failing in technological
advancement would lead
automatically to losses in market
share
• Lack of business consolidation
Opportunities
• Potential for market share acquisition
thanks to new-era carbon-ceramic discs
and mechatronic system
• Branching in selected promising
Emerging markets (low-cost production
and increased exposure to local OEMs)
• Further vertical integration
• Growth through new acquisitions
• Leadership among competitors allows
to experiment new solutions and find
new partners
Attack Strategies
• Invest more in R&D to find new market
solutions for the imminent shift of the market
to full mechatronic product-equipped
vehicles
• Expand the business in China as it aspires to
leapfrog rivals to become the premier market
for e-mobility by 2020
• Establish a “Plan B” strategy in case of
excess volatility in raw material prices and
dependence on strategic suppliers
Reinforce Strategies
• Invest more only in that Emerging
Economies that have certain future
positive outlook (for instance, only in
China and India)
• Assure a constant technological
improvement also by acquiring tech
companies
• Consolidate the business especially in
US, Mexico and China thanks to vertical
integration
Threats
• Lower than expected contribution to
Revenues from new operations abroad
• Cancellation of orders due to a
stronger than expected slowdown in
Brembo’s main customers’ business
• Higher than expected start-up costs
• Lower cash flow generation and a lack
of control of working capital
• Downturn of key markets (for
instance, China)
• Rising cost of raw materials
• Fierce competition in the “brake by
wire” field
• Uncertain global economy and
general economic instability
• More-strict-than expected
Environmental legislations
• High pressure on auto part prices,
driven by weak auto demand
• Difficulties in the integration of
Asimco
Develop Strategies
• Build more stable relationships with
customers by increasing the supply
contractual length
• Put more effort to predict the future
legislations on environmental policies and
shape the business in accordance to them
• Remain mainly concentrated on the
automotive market
• Focus on a sound integration of Asimco
Avoid Strategies
• “Wait and see” approach
• Increase the number of core suppliers
• Invest more-than-necessary in Fallen
Angels’ economies
• Widespread the business without
consolidating it anywhere
Source: Company data, personal estimates
c. Corporate governance
In a modern industrial scenario, Corporate Governance is seen as one of the most fundamental part
of it. It is the result of a shift in sensibilities among lawmakers regarding the relationship between
ethics and business; this concept encompasses everything that governs the activities of a business to
ensure the attainment of its corporate goals.
Brembo has adopted a traditional form of administration and control. Accordingly, the company’s
management is attributed to the Board of Directors, the supervisory functions to the Board of
Statutory Auditors, and the statutory and accounting audit of the company’s accounts to the
Independent Auditors appointed by the General Shareholders’ Meeting.
The Board of Directors is composed by 11 members, all Italians. Four of them are executive members,
including founder Emilio Bombassei’s son and co-founder Alberto, granddaughter Cristina (Executive
Director in charge of the Brembo Internal Control & Risk Management System), grandson-in-law
Matteo Tiraboschi (Executive Deputy Chairman) and Andrea Abbati Marescotti (CEO and General
13. ~ 13 ~
Structure of Share
Capital
Manager). Finally, Six of the members are non-executive and independent while the last one is a non-
executive Director.
The Board was approved on April 24th
, 2014, and will be in office until the shareholders’ meeting
approving the Financial Statement on December 31th
, 2016.
Experience and number of members with an appropriate mix among the classes of Directors (see
graph below on the right) seems to be appropriate, although the lack of non-Italian members is rather
unusual given the international profile of the company.
Exhibit 11: Composition of the Board of Directors and Board Committees as of 31.12.2015
Source: Company data, personal estimates
Brembo’s subscribed and fully paid-up share capital amounts to €34,727,914 and is divided into
66,784,450 ordinary shares of a nominal value of €0.52, each bearing voting rights. The majority stake
owned by the Chairman Alberto Bombassei (through the family Holding Nuova Fourb Srl) outlines the
serious commitment of the founding family to lead the Company to higher level of quality in the
foreseeing years.
Exhibit 12: Significant Shareholding as of 31.12.2015
Declarant Direct Shareholder No. of Shares
Share Capital with
Voting Rights (%)
Bombassei Alberto Nuova Fourb Srl 35,744,753 53.52
Brembo Spa Brembo Spa 1,747,000 2.62
Goodman & Co. Inv. Counsel LTD
Dynamic Global Value Fund 1,391,090 2.08
Dynamic Global Value Class 267,000 0.40
Subtotal 1,658,090 2.48
Gamco Investors
Gabelli Funds LLC 1,225,000 1.83
Gamco Asset Management Inc. 340,000 0.51
Gamco Investors Inc. 10,000 0.02
Subtotal 1,575,000 2.36
Source: Company data, Consob notices, personal estimates
0%
20%
40%
60%
80%
Previous
term of
office 2011-
2013
Current
term of
office 2014-
2016
FTSE-MIB*
% of executive Directors
% of non-executive Directors
% of Independent Directors
* Notes and Studies by ASSONIME 10/2015 and/or
Final Report 2015 - “Osservatorio sull’Eccellenza dei
Sistemi di Governo in Italia” (The European House
Ambrosetti)
53,52%39,02%
2,62%
2,48%
2,36%
Nuova Fourb Srl
Market
Own shares
Goodman & Co.
Inv. Counsel LTD
Gamco Investors
14. ~ 14 ~
Remuneration policy The remuneration policy is annually defined by the Board of Directors. It consists of a fixed
component and a variable component that shall be adequately balanced as a function of the issuer's
strategic objectives and risk-management policy, also considering the issuer's business segment and
the characteristics of the business activity conducted in actual practice. It is developed with the aim
of enhancing Brembo’s market competitiveness and potential for staff retention. It is addressed to
Executive Directors, Directors holding special offices and Key Management Personnel.
Typically, the remuneration package is as follow:
the fixed component (RAL2
and emoluments) usually does not exceed 55% of on-target
Annual Total Direct Compensation (excluding the benefits component);
the short-term variable component (annual MBO) generally specifies, on targets being
achieved, an amount equal to one-half of RAL. The maximum payable incentive, upon the
exceeding of targets, may not in any case exceed 75% of RAL;
the medium/long-term variable component (LTIP) specifies, on targets being achieved, an
annualized value equal to two-third of RAL. The maximum payable incentive, upon the
exceeding of targets, may not in any case exceed 100% RAL;
In addition to the provisions of the National Collective Labor Contract for industrial
executives, the benefits package also includes medical insurance and supplementary pension
schemes.
The LTIP component is granted to the manager only if the Tri-Annual Plan objectives are met. The Tri-
Annual Plan targets are set to monitor the efficiency in the company management. If partially met
(for instance, two out of three), the manager is still entitled to the payment of the bonus in
proportion to the objective(s) achieved (in the previous example, the manager will receive two-third
of the LTIP). Here are reported the three performance targets:
Economic Value Added (EVA), used to measure the growth in value during the three-year
period (nowadays: 2016-2018);
Operating Cash Flows, as compared to the three-year period target (nowadays: 2016-2018);
the ratio between Net Debt and EBITDA, compared to the targets set for the individual years
(nowadays: 2016, 2017 and 2018).
The targets are not disclosed in the Remuneration Report published by Brembo. However, it is
possible to imply how the management has been efficient in the past Tri-Annual Plan (2013-2015)
and in the future Tri-Annual Plan (2016-2018) thanks to actual and forecasted values:
The EVA model indicates in its three different growth-scenarios an increase of the company
value. This first indicator signals a good management of the company;
Tri-Annual Assessment
(2013-2015) scenario
Price
(€)
3yy
Change
(%)
Share Value with g = 0 33.88 na
Share Value with g = 2.5% 45.16 na
Share Value with g = 5% 76.58 na
Average Share Value 51.87 na
Tri-Annual Assessment
(2016-2018) scenario
Price
(€)
3yy
Change
(%)
Share Value with g = 0 41.49 22
Share Value with g = 2.5% 51.70 14
Share Value with g = 5% 80.14 5
Average Share Value 57.77 11
Source: Company data, personal estimates
2
Gross Annual Salary
15. ~ 15 ~
Buy-back and sales
program
Operating Cash Flows performed well in the past three years; but the forecasted up-and-
down in their growth in the second Tri-Annual Assessment suggests a contraction from the
nearly 80% level of the last one. This result is due mainly to the fact that the financial figures
“Others/Uses of funds” (meaning provisions and similar) and “change in Net Working
Capital” are forecasted as negative due to the ramp-up costs in US, Mexico and China. The
forecasted values would apparently lead the management to miss the second performance
target;
Tri-Annual Assessment
(2013-2015) scenario
2013A 2014A 2015A
3yy
Change
(%)
Operating Cash Flows (€mln) 162 256 290 79
Growth (%) 37 58 13 -
Tri-Annual Assessment
(2016-2018) scenario
2016E 2017E 2018E
3yy
Change
(%)
Operating Cash Flows (€mln) 202 288 305 51
Growth (%) -30 43 7 -
Source: Company data, personal estimates
Last but not least, the ratio between Net Debt and EBITDA has experienced (and it is
expected to experience) great volatility in its value, mainly due to the amount of Net Debt
that increase/decrease over the years. Despite the great volatility of the indicator’s value, it
seems stable in its tri-annual pace. It can be interpreted as a positive news: it means that the
Net Debt is going to absorb less and less EBITDA over the years. This is a sign of good
management.
Last Tri-Annual Assessment (2013-2015)
(€mln)
2013A 2014A 2015A
3yy
Change
(%)
Net Debt 320 270 161 -50
EBITDA 212 280 360 70
Net Debt/EBITDA 151 97 45 -70
Growth (%) -19 -36 -54 -
Next Tri-Annual Assessment (2016-2018)
(€mln)
2016E 2017E 2018E
3yy
Change
(%)
Net Debt 214 149 -66 -131
EBITDA 372 405 437 17
Net Debt/EBITDA 58 37 15 -74
Growth (%) 29 -36 -59 -
Source: Company data, Net Debt consensus, personal estimates
Although the Operating Cash Flows target is forecasted to be less than the last tri-annual plan, overall
the three sound-management performance indicators are judged satisfying and sign of good
management of the company.
Brembo has a buy-back and sales program approved each year by the General Shareholders’ Annual
Meeting held on April. It is aimed to: support the liquidity of the company’s stock, so as to foster the
regular conduct of trading beyond normal fluctuations related to market performance; giving effect
to any share-based incentive plans for the Directors, employees and collaborators of the company
and/or its subsidiaries; finally, pursuing any swap transactions with equity investments as part of
industrial projects.
At the present, Brembo owns 1,747,000 shares (2.62% of Share Capital) with the possibility to hold at
most 3,347,000 (5.01% of Share Capital).
16. ~ 16 ~
Financial Ratios
analysis
Balance Sheet
V. Financial Ratios analysis
a. Brembo in numbers: -5Y Financial Statements evolution
In this section is proposed a clear focus on the key Brembo last 5 years key financial figures.
i. Balance Sheet
The Balance Sheet has been quite stable in its growing pace in the last 5 years. These were years of
great investments: rump-up costs in 2011 for the new plant in Poland; construction costs in 2014 of
the aluminum foundry and an aluminum caliper manufacturing plant in Mexico; today, costs for a
new plant in Poland and the acquisition of the majority share of the capital of the Chinese Asimco.
Although the slowdown in 2015 (mainly due to a spike in 4Q14 in “Cash and Cash equivalents” thanks
to an extraordinary cash inflow of €50mln, as explained by the management in a conference call),
having a look at the Balance Sheet evolution (exhibit below) we can have a proof that not only
Brembo reached to go through the 2011 financial crisis and its spillovers in the real economy, but also
how the company kept in the last five years a constant growth pace.
The non-current Assets side continued to increase through the years in response to the ambitious
internationalization program that the company is putting in place. This involved significant
investments in production plants, machinery and equipment, particularly in North America, Poland,
China, the Czech Republic, as well as in Italy. This financial figure alone represents the 75% of the
non-current Assets, increasing with a 5-year CAGR of 10%. In the current Assets side, the constant
expansion of Inventories, Trade receivables and Cash and cash equivalent helped the entire Assets
side to harmoniously increase. Those financial figures alone represent 95% of the current Assets,
increasing with a 5-year CAGR of 10%.
The cornerstone of the Liability side is the composition of the debt: 61% long-term debt against 31%
short term debt (well supported by 1-year credit lines of €434mln) is a sign of wise debt management
to hedge the company against unexpected liquidity shortage. Furthermore, the strategy of the
company to increase its leverage level is a good sign of cost maximization due to the nowadays low
cost of debt.
Finally, the Equity side was the mirror of the health of Brembo’s business: it increased continuously
due to the steep growth of profits with a 5-year CAGR of 20%, well supported by increasing retained
earnings in the same period with a 5-year CAGR of 23%.
Exhibit 13: -5Y Balance Sheet Evolution
Source: Company data, personal estimates
-30%
-20%
-10%
0%
10%
20%
30%
-2.000
-1.500
-1.000
-500
0
500
1.000
1.500
2.000
2011 2012 2013 2014 2015
Non-Current Assets Current Assets Non-Current Liabilities
Current Liabilities Shareholders' Equity* Total Assets Growth
Total Liabilities Growth Shareholders' Equity* Growth
EUR mln
*Shareholders' Equity is reported in negative sign below the x-assis to reflect its position in the Balance Sheet together with the
Liability side
17. ~ 17 ~
By computing Assets and Liabilities as percentage of Total Sales (exhibit below) is possible to spot an
interesting feature: the company succeeded in generating strong revenues at a pace (5-year CAGR of
13%) which is faster than the one kept by Assets (5-year CAGR of 9%) and Liabilities (5-year CAGR of
3%).
Exhibit 14: Revenues’ Growth Rate vs Total Assets’ and Liabilities’ Growth Rates
Source: Company data, personal estimates
Here are disentangled in their components the most important financial figures and their growth
rates (yearly and average):
Enterprise Value (calculated as the summation of Market Capitalization, Net Debt, Minorities
Value and Associates) increased of 185% from FY11, reaching €2,673mln in FY15 with a 5-
year CAGR of 30% and a 5-year average Enterprise Value of €1,779mln.
Source: Company data, personal estimates
Net Debt decreased of 49% from FY11, reaching €161mln in FY15 with a 5-year CAGR of -15%
and a 5-year average Net Debt of €277mln.
Source: Company data, personal estimates
-20%
0%
20%
40%
0
500
1.000
1.500
2.000
2.500
2011 2012 2013 2014 2015
Sales of goods and services Total assets
Total liabilities Total assets growth
Total liabilities growth Revenues growth
EUR mln
-60%
-30%
0%
30%
60%
90%
120%
-1.250
-625
0
625
1.250
1.875
2.500
2011 2012 2013 2014 2015
Enterprise value Avg Enterprise Value Growth
EUR mln
-60%
-40%
-20%
0%
20%
40%
60%
80%
100%
-210
-140
-70
0
70
140
210
280
350
2011 2012 2013 2014 2015
Net Debt M/LT fin. debt ST fin. debt
Avg Net Debt Growth
EUR mln
18. ~ 18 ~
Net Debt to Equity ratio decreased of 76% from FY11, reaching 24% in FY15 with a 5-year
CAGR of -30% and a 5-year average Net Debt to Equity of 66%. This ratio represents the level
of risk associated with the company’s funding source (liquidity funding risk). Brembo
managed to decrease this ratio from the very high risk level of 2011 (97%) to the more
attracting 2015 figure standing at low level of risk (24%).
Source: Company data, personal estimates
Return On Equity (ROE, here presented as presented in its Dupont analysis’ formula)
increased of 103% from FY11, reaching 27% in FY15 with a 5-year CAGR of 19% and a 5-year
average ROE of 21%. In the graph below it is possible to see tat Brembo has generated
constantly increasing and above-the-average profits with the money the Shareholders have
invested in.
Source: Company data, personal estimates
Return On Invested Capital (ROIC) increased of 161% from FY11, reaching 30% in FY15 with a
5-year CAGR of 27% and a 5-year average ROIC of 18%. In Section VI. Valuation, among the
DCF assumptions, is exposed the calculation of the WACC (6.7%). By comparing this value
with the 2015 ROIC (30%) it emerges that, because the former is well greater than the latter,
value has been created: the company wisely allocated its capital under control to profitable
investments.
Source: Company data, personal estimates
-120%
-80%
-40%
0%
40%
80%
120%
-700
-525
-350
-175
0
175
350
525
700
2011 2012 2013 2014 2015
Shareholders Equity Net Debt
Net Debt to Equity Growth
Avg Net Debt to Equity
EUR mln
0%
15%
30%
45%
60%
0
600
1.200
1.800
2.400
2011 2012 2013 2014 2015
Sales of goods and services Assets
Shareholders Equity Net operating income
ROE Growth
Avg ROE
EUR mln
0%
10%
20%
30%
40%
0
250
500
750
1.000
2011 2012 2013 2014 2015
Net Invested capital Net operating income
ROIC Growth
Avg ROIC
EUR mln
19. ~ 19 ~
Income Statement
Going in deeper details in analyzing the achieved level of ROIC, the table below reports the
Net Invested Capital (NIC) disentangled in its components (a graphical representation is
provided in the graph just below). An important driver for the NIC is represented by the
Fixed Capital (89% of NIC in 2015). More precisely, the item “Property, plant and equipment”
is the key driver of NIC, representing the 67% of NIC in 2015. Furthermore, on the graph just
below, it is possible to see how the NIC growth rate is mostly influenced by the growth rate
of this item. Next step is to understand how the NIC behavior may influence the ROIC: the
slowing down of the NIC (denominator in the ROIC), in combination with the speed-up of the
Net Operating Income (NOI) (numerator in the ROIC), leads to a substantial increase in the
level of the profitability of the invested capital: NIC 5-year CAGR stood at 7% while NOI 5-
year CAGR stood at 36%.
Summing up, the NIC slower pace (in contrast with the NOI faster one) led the ROIC to
increase from the level of 11% in 2011 to the 29% of the 2015 (an increase of 161%). This
denotes an optimal management of both the Fixed Capital and the Working Capital, being
able to create substantial NOI for shareholders.
Exhibit 15: Net Invested Capital – Components and Trends
Financial item (€mln) 2010 2011 2012 2013 2014 2015
Property, plant and equipment 323 407 475 503 540 590
+ Intangible assets 104 103 103 100 99 99
+ Net financial assets 23 21 21 22 29 37
+ Other receivables and non-current liabilities 19 20 41 49 47 60
= Fixed capital (a) 469 550 640 675 716 785
Inventories 182 225 207 209 231 248
+ Trade receivables 201 208 202 252 287 311
+ Other receivables and current assets 37 37 44 43 39 36
- Current liabilities 280 338 336 383 408 471
- Provisions / deferred taxes 16 14 16 19 25 31
= Net working capital (b) 124 118 101 102 124 93
= Net Invested Capital (c) = (a)+(b) 592 668 741 777 840 879
ii. Income Statement
The Income Statement became stronger from year to year, outlining the good policies adopted by the
management to face critical years of rebuilding after the 2011 global financial crisis and its spillovers
in the real economy. It is relevant to notice how the ratio D&A to Sales decreases over the years: it
measures the non-cash expenditures in relation to the Total Revenues. The low level of this ratio for
Brembo signals an increasing efficiency of the management in optimizing the generation of Revenues
nevertheless the increase of D&A.
Furthermore, having a closer look to the Income Statement evolution (Exhibit below), the harmonic
growth in the Sales was mirrored also by two important ratios, signaling the profitability level of the
company: Operating Margin (EBIT/Sales) and Net Income Margin (Net Income/Sales). To better
underline how good has been the performance of Brembo in the last 5 years, it is possible to have a
closer look to growth rates: Sales in the last 5 years grew slower (5-year CAGR of 13%) than Operating
margin (5-year CAGR of 20%) and Net Income Margin (5-year CAGR of 27%).
0%
5%
10%
15%
20%
25%
30%
0
250
500
750
1.000
2011 2012 2013 2014 2015
Intangible assets, Net financial assets, Other receivables and non-current liabilities
Property, plant and equipment
Net working capital
NIC growth yoy
Property, plant and equipment growth yoy
EUR mln
20. ~ 20 ~
Finally, the numerous investments in Poland and Czech Republic had a very positive effect on the tax
rate paid by the Company in the years, especially in 2012 where it reached the lowest level of the
period (6.1%). On the other end, to give a broader picture of the fiscal situation, due to the fact that
the business is going very well in countries known for their high tax rate (for instance, in Italy), the
tax rate for Brembo is increasing year to year.
Exhibit 16: -5Y Income Statement Evolution
Source: Company data, personal estimates
Exhibit 17: Taxes as portion of Equity and EBIT
Source: Company data, personal estimates
Here are disentangled in their components the most important financial figures and their growth
rates (yearly and average):
Sales of goods and services increased of 65.3% from FY11, reaching €2,073mln in FY15 with a
5-year CAGR of 13% and a 5-year average Sales of goods and services of €1,617mln.
Source: Company data, personal estimates
0%
3%
6%
9%
12%
15%
0
600
1.200
1.800
2.400
2011 2012 2013 2014 2015
Sales of goods and services Operating Profit
Net Income Operating Margin
Net Margin
EUR mln
0%
5%
10%
15%
20%
25%
0
200
400
600
800
2011 2012 2013 2014 2015
Equity EBIT Taxes % of Equity % of EBIT
EUR mln
0%
4%
8%
12%
16%
0
600
1.200
1.800
2.400
2011 2012 2013 2014 2015
Sales of goods and services Avg Sales of goods and services Growth
EUR mln
21. ~ 21 ~
Statement of Cash
Flows
D&A to Sales ratio decreased of 12.9% from FY11, reaching 5.2% in FY15 with a 5-year CAGR
of -3% and a 5-year average D&A to Sales of 5.7%.
Source: Company data, personal estimates
Operating margin increased of 107.3% from FY11, reaching 12% in FY15 with a 5-year CAGR
of 20% and a 5-year average Operating margin of 8%.
Source: Company data, personal estimates
Net Income margin increased of 159.3% from FY11, reaching 9% in FY15 with a 5-year CAGR
of 27% and a 5-year average Net Income margin of 6%.
Source: Company data, personal estimates
iii. Statement of Cash Flows
Finally, the very good performance and commitment to invest in chasing high quality standards are
well reflected in Brembo’s Statement of Cash Flows. It presents strong figures for the last 5 years. The
Cash Flows from/(for) Operating Activities represents how much cash comes from sales of the
company's goods and services, less the amount of cash needed to make and sell those goods and
services. It increased of 158% from 2011, reaching €312mln in 2015 with a 5-year CAGR of 27% and a
5-year average value of €192mln. This result was reached thanks to the company ability of
-13%
-7%
0%
7%
13%
-2.400
-1.600
-800
0
800
1.600
2.400
2011 2012 2013 2014 2015
Sales of goods and services D&A
D&A to Sales Growth
Avg D&A to Sales
EUR mln
0%
10%
20%
30%
0
600
1.200
1.800
2.400
2011 2012 2013 2014 2015
Sales of goods and services Net operating income
Operating margin Growth
Avg Operating margin
EUR mln
0%
20%
40%
60%
80%
100%
0
600
1.200
1.800
2.400
2011 2012 2013 2014 2015
Sales of goods and services Net income
Net income margin Growth
Avg Net Income margin
EUR mln
22. ~ 22 ~
Valuation
Discounted Cash
Flow to the Firm
model (DCF)
constraining the financial figure of D&A at an increase growth rate of only 44% from 2011 (reaching
€109mln in 2015), although suffering paid taxes increased with a 5-year CAGR of 42% in the same
time frame (reaching €61mln in 2015).
Cash Flows from/(for) Investing Activities decreased of 12% from 2011, reaching (negative) €144mln
in 2015 with a 5-year CAGR of -3% and a 5-year average value of (negative) €139mln. This was due to
high investments in Property, Plant and Equipment that reached €137mln in 2015 (decreased of 6%
from 2011). This financial figure had its peak in 2011 and then decreased steadily over time until
2014. But, in 2015, Brembo pushed forward more projects to better support its investment schema
abroad, marking a sound +26% of increase from 2014.
Finally, Cash Flows from/(for) Financing Activities: it decrease of 652% from 2011, reaching (negative)
€156mln in 2015 with a 5-year average value of (negative) €38mln. It is the sign of the Brembo
philosophy to have the less debt possible. In facts, in 2015 the company payed back €233mln of long-
term loans, doubling, in doing so, the amount payed in 2014.
Exhibit 18: -5Y Statement of Cash Flows Evolution
Source: Company data, personal estimates
VI. Valuation
a. Models, main assumptions and Brembo Final Target Price
Four methodologies have been used for the valuation of the Brembo Final Target Price. To reach it,
different weights were applied at the single Target Price of each model, finally obtaining the
estimation of the Brembo Final Target Price.
i. Discounted Cash Flow to the Firm model (DCF)
The Discounted Cash Flow to Firm model (DCF) weights 60% of the Brembo Final Target Price. It has
been structured in two parts in order to better take into account the future foreseeable Revenues:
while in the first step (2016-2020) each year was analyzed in detail, calculating the financial figures
line-by-line, in the second step (2021-2023) the DCF components were assumed constant in a
percentage of Revenues lower than 2020 to support the main assumption of stable 5.5% of Free Cash
Flows growth up to 2023.
Furthermore, the model has been articulated in three different scenarios in chasing the most
accurate estimation:
Base Case scenario, accounting for 75% of the final DCF target price because it better reflects
the management guidelines and the most foreseeable evolution of each financial figure
which leads to the target price estimation;
Worst Case scenario, accounting for 15%;
Best Case scenario, accounting for the remaining 10% (the decision of weighting more this
scenario is to remain in the conservative side).
-200
-100
0
100
200
300
400
Net cash flows from/(for) operating activities Net cash flows from/(for) investing activities
Net cash flows from/(for) financing activities Total cash flows
EUR mln
23. ~ 23 ~
DCF main assumptions Below are exposed and described the main assumption at the root of the pricing exercise with the
DCF model.
Figure Component Best Case Base Case Worst Case
Sales of
goods
and
services
Europe Growth rate around 8%.
As set forth by management
guidelines, Growth rate around
5%.
Growth rate between 2-3%.
North
America
Constant Growth rate of 15%.
As set forth by management
guidelines, 10% in FY16. Then, a
convergence to 7% in FY20 is
forecasted.
Constant Growth rate of 3%.
China
Thanks to the successful integration
of Asimco, in 5 years Brembo will
gain both significant exposure to all
the luxury carmakers in China and
an additional significant market
share.
As set forth by management
guidelines, Brembo will grow
consistently thanks also to new
acquisitions.
Brembo fails to integrate
Asimco and, jointly, the
Chinese market shrinks
considerably.
Latam Recovery in just two years.
Recovery for Brembo is
forecasted in 2020: IMF
estimates for both Brazil and
Argentina a 0% growth in FY17.
Constant Growth rate of -30%.
EBITDA
Margin
First Phase:
Base Case +1%.
Second Phase:
Base Case +1.5%.
It is forecasted a slower First
Phase (2016-2018) to better and
fully assimilate Asimco; then,
thanks to Brembo's overall ability
of strong volumes production
and vertical integration, a
stabilization is expected in the
Second Phase (2019-2020).
First Phase:
Base Case -1%.
Second Phase:
Base Case -1.5%.
D&A Base Case +5%.
In percentage of EBITDA, D&A
reduces little by little through
the years.
Base Case -5%.
Capex As in Base Case.
As set forth by the management
guidelines, for the 2016 are
expected €200mln of capital
expenditure. A decreasing capital
expenditure through the years is
forecasted.
As in Base Case.
Weighted
Average
Cost of
Capital
Risk Free rate
(rf) (%)
2.50
30-years US Treasury Bond Yield To
Maturity.
3.00
Beta (β) As in Base Case.
2-years Bloomberg Regression
Brembo vs Exchange
As in Base Case.
Equity Risk
Premium rate
(ERP) (%)
5.00
Damodaran implied Equity Risk
Premium on May 1st, 2016.
7.00
CAPM Cost of
Equity (re)
Capital Asset Pricing Model
re = rf + β*(ERP)
Capital Asset Pricing Model
re = rf + β*(ERP)
Capital Asset Pricing Model
re = rf + β*(ERP)
Growth Rate
(%)
2.25 2.00 1.00
Effective Tax
rate
As in Base Case.
Average of estimated Effective Tax
rates 2016-2020.
As in Base Case.
Cost of Debt
(%)
2.00 Management guidelines. 5.00
Capital
Structure
(D/E) (%)
As in Base Case. 23.37 As in Base Case.
WACC
Final Value
(%)
6.37 6.70 8.82
Source: Company data, Bloomberg, Damodaran website, personal estimates
25. ~ 25 ~
Sensitivity analysis
DCF Target Price
Exhibit 21: Best Case Scenario
Financial Figure (€mln) 2016E 2017E 2018E 2019E 2020E 2021E 2022E 2023E
Sales 2,329.60 2,610.48 2,908.78 3,232.06 3,595.26 3,954.78 4,350.26 4,785.29
% growth 12% 12% 11% 11% 11% 10% 10% 10%
EBITDA 384.38 437.26 491.58 565.61 629.17 672.31 739.54 813.50
% of sales 17% 17% 17% 18% 18% 17% 17% 17%
EBIT 256.26 313.26 349.05 420.17 467.38 395.48 435.03 478.53
% of sales 11% 12% 12% 13% 13% 10% 10% 10%
Effective Tax rate 25% 25% 27% 27% 27% 27% 27% 27%
NOPLAT
= EBIT*(1- Effective Tax Rate)
192.19 234.94 254.81 306.72 341.19 288.70 317.57 349.33
- Change in NWC -7.10 -10.97 -10.90 -10.67 4.77 4.77 4.77 4.77
- Capital expenditure 200.00 175.00 170.00 160.00 170.00 180.00 180.00 190.00
+ D&A 114.92 118.45 121.48 126.30 130.72 128.59 134.49 119.42
= Free Cash Flows (FCFs) 114.21 189.36 217.19 283.69 297.14 232.52 267.29 273.98
% of sales 4.9% 7.3% 7.5% 8.8% 8.3% 5.9% 6.1% 5.7%
Discount time 0 1 2 3 4 5 6 7
Discounted FCFs 114.21 177.47 190.76 233.51 229.22 168.10 181.10 173.96
Cumulative present value of FCFs 1,468.32
+ Present value of term. value 4,605.58
Enterprise value 6,073.91
+ Net debt (-) / cash (+) 160.70
- Minority Interests 5.70
Value of Equity 5,907.51
/ No. of shares (mln) 66.78
DCF target price (€) 88.46
Actual Price (€) 46.91
Upside / (Downside) 89%
Source: Company data, personal estimates
A sensitivity analysis has been performed in order to predict the impact the actual outcome of a
particular variable will have if it differs from what was previously assumed. By creating a given set of
scenarios, it is possible to determine how changes in variables will impact the target variable.
The analysis was made based on the DCF Base Case scenario by changing the two most important and
impacting variables for a company: long-term Growth rate and the WACC.
Growth
WACC
1.0% 1.5% 2.0% 2.5% 3.0%
6.25% €60.99 €65.88 €71.93 €79.59 €89.61
6.50% €58.13 €62.51 €67.86 €74.54 €83.14
6.75% €55.52 €59.45 €64.21 €70.09 €77.53
7.00% €53.13 €56.67 €60.93 €66.13 €72.63
7.25% €50.93 €54.14 €57.96 €62.59 €68.30
Source: Company data, personal estimates
Finally, by applying to each scenario its respective weight, the DCF Target Price is obtained.
Scenario
Weight
(%)
Target
Price (€)
Base Case 75% 64.86
Worst Case 15% 37.66
Best Case 10% 88.46
DCF Target Price (€) 63.14
Source: Company data, personal estimates
26. ~ 26 ~
continuing
value
Dividend Discount
Model (DDM)
DDM Target Price
Multiples Model (MM)
ii. Dividend Discount Model (DDM)
The Dividend Discount Model (DDM) weights 15% of the Brembo Final Target Price. Once estimated
the Dividends (product of EPS Forecasts and the company Payout Ratio) and the Expected Price
Brembo 2015 stock price plus Dividend 2016E gives the Brembo stock price 2016E, and so on and so
forth), their present values were calculated taking into account a 7.8% of Required Return on Equity
and a 2% Expected Growth rate. Finally, by adding the sum of the present value of the Dividends to
the present value of the 2020E Price, the DDM Target Price of €61.35 was obtained.
The DDM Target Price is €61.35.
Financial Figure 2016E 2017E 2018E 2019E 2020E
EPS Forecast (€) 2.81 3.15 3.31 3.43 3.50
* Payout Ratio (%) 28.51 28.51 28.51 28.51 28.51
= Dividend (€) 0.80 0.90 0.94 0.98 17.21
+ Brembo stock price 46.91 47.71 48.61 49.55 50.53
= Expected Price (€) 47.71 48.61 49.55 50.53 67.74
PV of Dividends (€) 0.74 0.77 0.75 0.72 11.82
PV of Expected Price (€) 44.26 41.83 39.55 37.42 46.53
Required Return on Equity (%) 7.80
Expected Growth rate (%) 2.00
Sum of PV of Dividends (€) 14.82
+ PV of 2020E Price (€) 46.53
DDM Target Price (€) 61.35
Source: Company data, personal estimates
iii. Multiples Model (MM)
Weighting 15% of the Brembo Final Target Price, the Multiples Model (MM) has been structured in
order to analyze how Brembo is performing in comparison with its main market peers. The relative
small weighting factor assigned to this model responds to the very nature of Brembo’s peers: these
are companies not having their core business in the brake market but rather in other sectors (for
instance, Sogefi Spa develops and produces filtration systems and flexible suspension components,
while Michelin and Continental AG are tire manufacturers).
The Premium (Discount) to be applied to Brembo is the percentage difference between the Total
Automotive Suppliers indicator and Brembo’s financial ratios. The former is the weighted average of
the Average by Regional Automotive Suppliers Market. The weights assigned to each single Region
were set as to mirror the percentage of Brembo Revenues in the respective Region. In greater details:
Europe, accounting for 60%;
Nafta, accounting for 30%;
Asia, accounting for 10%.
The MM is articulated in three financial ratios:
Enterprise Value/EBITDA;
Enterprise Value/EBIT;
Price/Earnings.
27. ~ 27 ~
Multiples analysis Hereafter is presented the table with the values for each Peer of the three financial indicators.
Sector Peers (x)
EV/EBITDA EV/EBIT P/E
2016E 2017E 2016E 2017E 2016E 2017E
Brembo 8.4 7.6 12.2 10.7 16.2 14.2
Top European Peers
- Sogefi 4.1 na 6.3 na 7.6 6.3
- Valeo SA 5.6 na 8.6 na 12.9 11.6
- Continental AG 6.3 na 8.2 na 12.2 11.3
- Piaggio 6.4 na 14.3 na 23.0 14.2
- Michelin 4.4 na 6.3 na 11.1 10.1
Average by Regional Automotive Suppliers Market
- Europe 6.0 5.4 9.5 8.2 14.2 11.2
- Nafta 5.5 5.0 7.6 6.9 11.9 10.6
- Asia 5.9 5.3 12.1 9.0 10.1 9.4
Total Automotive Suppliers 5.8 5.2 9.2 7.9 13.1 10.8
Permium (Discount) Brembo vs. Sector Weighted Average (%) 44.2 44.1 32.2 36.7 24.0 31.1
Source: Company data, Bloomberg, personal estimates
Below are reported the forecasted financial figures utilized to estimate each Target Price of each
ratio.
Exhibit 22: EV/EBITDA indicator
Multiples Model – Enterprise Value/EBITDA
EV/EBITDA 2016 (x) 8.41
* EBITDA 2016 Brembo Spa (€) 371.79
= EV 2016 Brembo Spa (€) 3,127.30
+ Net Debt(-)/Cash(+) at 2016 (€) 213.80
+ Minority Interest in 2015 (€) 5.70
+ Pension liabilities in 2015 (€) -
+ Investment in associated company (€) -
= Equity Value 2016 Brembo Spa (€) 3,346.80
/ Number of shares 2016 (mln) 66.78
* (1+ Premium/(Discount) Brembo Spa vs Peers) (%) -44.23
Target Price 2016 (€) 27.95
Current price (€) 46.91
Potential Upside (%) -40.42
Source: Company data, personal estimates
Exhibit 23: EV/EBIT indicator
Multiples Model – Enterprise Value/EBIT
EV/EBIT 2016 (x) 12.17
* EBIT 2016 Brembo Spa (€) 256.87
= EV 2016 Brembo Spa (€) 3,127.30
+ Net Debt(-)/Cash(+) at 2016 (€) 213.80
+ Minority Interest in 2015 (€) 5.70
+ Pension liabilities in 2015 (€) -
+ Investment in associated company (€) -
= Equity Value 2016 Brembo Spa (€) 3,346.80
/ Number of shares 2016 (mln) 66.78
* (1+ Premium/(Discount) Brembo Spa vs Peers) (%) -32.16
Target Price 2016 (€) 34.00
Current price (€) 46.91
Potential Upside (%) -27.52
Source: Company data, personal estimates
28. ~ 28 ~
MM Target Price
Economic Value Added
model (EVA)
EVA Target Price
Brembo Final Target
Price
Exhibit 24: P/E indicator
Multiples Model – Price/Earnings
P/E 2016 (x) 16.19
* EPS 2016 Brembo Spa (€) 2.80
* (1+ Premium/(Discount) Brembo Spa vs Peers) (%) -23.99
Target Price 2016 (€) 34.47
Current price (€) 46.91
Potential Upside (%) -26.53
Source: Company data, personal estimates
Finally, MM Target Price is obtained by computing the simple average of the financial ratio’s Target
Prices.
Financial indicator Weight Price (€)
Enterprise Value over EBITDA 1/3 27.95
Price over Earnings 1/3 34.47
Enterprise Value over EBIT 1/3 34.00
MM Target Price (€) 32.14
Source: Company data, personal estimates
iv. Economic Value Added model (EVA)
The Economic Value Added model weights 10% of the Brembo Final Target Price.
EVA Target Price is €59.08, calculated in the scenario of a 2.5% Medium-Term growth rate.
Below are exposed the main assumption at the root of the pricing exercise through the EVA model.
EVA Model - Assumptions Share Value scenario Price (€)
Risk Free rate (rf) (%) 2.68 - with g = 2.5% 53.92
+ [Beta (β) 1.003 EVA Target Price (€) 53.92
* Equity Risk Premium rate (ERP) (%)] 5.11
= CAPM Cost of Equity (re) (%) 7.80
Medium Growth (%) 2.50
2015A Book Value (x) 10.20
2016E Dividend (€) 0.80
EPS (0) (€) 2.78
EPS (1) (€) 2.81
EPS (2) (€) 3.15
First Payout (%) 28.51
Second Payout (%) 35.00
Size adjustment (%) 0.00
Convergence ROE (%) 16.10
Source: Company data, personal estimates
v. Brembo Final Target Price
The table below shows Brembo Final Target Price, obtained by computing the weighted average of
the four Target Prices resulting from the application of the four different methodologies applied in
the pricing exercise.
Weight
(%)
Model
Target
(€)
vs Market
(%)
60 DCF 63.14 + 34.59
15 DDM 61.35 + 30.77
15 MM 32.14 - 31.49
10 EVA 53.92 + 14.95
Price
Target 57.30
Market 46.91
Source: Company data, personal estimates
+22.14%
29. ~ 29 ~
Investment
Intangibles
Internal dealings
VII. Investment Intangibles
a. Internal dealings analysis
In this section are provided the last 5 years internal dealings made by Brembo insiders.
All the internal dealings were analyzed having regard to the full documentation available in the
company website for the last 5 years. The analysis was conducted by discriminating each transaction
by year and by type (Sell (S) or Purchase (P)); then each deal was plotted in a yearly graph of the
Brembo stock price.
As outlined by the company in each Annual Report, a share buy-back/sell program is in place in
certain situation: support the stock liquidity of the company, so as to foster the regular conduct of
trading beyond normal fluctuations related to market performance; giving effect to any share-based
incentive plans for the Directors, employees and collaborators of the company and/or its subsidiaries;
and pursuing any swap transactions with equity investments as part of industrial projects.
In the table below, it is possible to see that, apart from the accelerated bookbuilding transaction to
institutional investors led by Nuova Fourb Srl (the Bombassei family Holding) in October 2013, the
overall profit from these dealings was not so high: only €11,556. It is possible to argue and conclude
that all the transactions that have been made in the last five years were more intended to give signals
to the market that the management was confident in the company’s prospects and, at the same time,
containing the stock price when evaluated too high by the management.
Date Name Position Held in Brembo
Type of
Transaction
Quantity
Price
(€)
Mkt Price
(€)
Value
(€)
08.07.2011 Roberto Vavassori Business Development Director S 13,000 10.04 9.93 1,430
10.10.2011
Francisco Carrasco
Garcia
Group Purchasing Director P 2,300 6.22 7.27 2,404
24.10.2011
Francisco Carrasco
Garcia
Group Purchasing Director S 2,300 7.98 8.01 -76
14.11.2011
Francisco Carrasco
Garcia
Group Purchasing Director P 2,600 7.50 7.43 -182
FY11 Total Share Purchase / Sell Performance 3,575
01.02.2012
Francisco Carrasco
Garcia
Group Purchasing Director S 2,600 8.48 8.61 -328
31.05.2012 Roberto Vavassori Business Development Director S 10,000 8.46 8.46 38
FY12 Total Share Purchase / Sell Performance -290
02.04.2013 Dallera Giancarlo Director S 30,000 12.57 13.06 -14,700
03.04.2013 Dallera Giancarlo Director S 8,000 12.46 12.86 -3,238
25.10.2013 Nuova Fourb Srl Bombassei family Holding S 2,000,000 19.60 19.50 200,000
FY13 Total Share Purchase / Sell Performance 182,062
09.10.2014
Andrea Abbati
Marescotti
CEO and General Manager P 6,550 22.89 22.55 -2,227
10.10.2014 Matteo Tiraboschi Executive Vice President P 9,000 22.23 22.96 6,570
19.12.2014 Milena Teresa Motta Auditor P 500 26.80 27.12 160
FY14 Total Share Purchase / Sell Performance 4,503
22.01.2015
Andrea Abbati
Marescotti
CEO and General Manager S 6,550 30.11 30.44 -2,175
23.01.2015 Matteo Tiraboschi Executive Vice President S 9,000 31.33 31.31 182
FY15 Total Share Purchase / Sell Performance -1,992
09.02.2016
Andrea Abbati
Marescotti
CEO and General Manager P 6,150 32.53 33.74 7,424
09.02.2016
Andrea Abbati
Marescotti
CEO and General Manager P 6,150 32.43 33.74 8,033
07.03.2016
Andrea Abbati
Marescotti
CEO and General Manager S 12,300 44.20 43.53 8,241
1Q16 Total Share Purchase / Sell Performance 23,698
- 5Y Total Share Purchase / Sell Performance 211,556
Source: Company data, personal estimates
31. ~ 31 ~
Investment Risks
i. External
Exhibit 28: FY14 Internal Dealings
Source: Company data, personal estimates
Exhibit 29: FY15 Internal Dealings
Source: Company data, personal estimates
Exhibit 30: 1Q16 Internal Dealings
Source: Company data, personal estimates
VIII. Investment Risks
a. Brembo Risk Management framework
This section of the report is devoted to an in-depth analysis of the various risks which the business of
Brembo is exposed to. Hereafter is proposed the first-tier family risks based on the Brembo Risk
Management Policies and the mitigant factors put in place by the company.
i. External (High1;High1)
1. Country risk [E1]: the risk that political, exchange, economic, sovereign and transfer
changes of the Country’s market in which the company operates could affect the business
16
20
24
28
32
01.01
16.01
31.01
15.02
02.03
17.03
01.04
16.04
01.05
16.05
31.05
15.06
30.06
15.07
30.07
14.08
29.08
13.09
28.09
13.10
28.10
12.11
27.11
12.12
27.12
PP PEUR
25
30
35
40
45
50
01.01
16.01
31.01
15.02
02.03
17.03
01.04
16.04
01.05
16.05
31.05
15.06
30.06
15.07
30.07
14.08
29.08
13.09
28.09
13.10
28.10
12.11
27.11
12.12
27.12
SSEUR
30
34
38
42
46
50
01.01
06.01
11.01
16.01
21.01
26.01
31.01
05.02
10.02
15.02
20.02
25.02
01.03
06.03
11.03
16.03
21.03
26.03
31.03
05.04
10.04
15.04
20.04
25.04
30.042xP S
EUR
32. ~ 32 ~
ii. Strategic
iii. Operating
of the company itself.
Mitigant: Due to its worldwide presence, Brembo is widely exposed to the risk that
structural changes in the countries in which it operates could affect its own
business. For instance, change in environmental policies (which could be painful, in
general, for the industrial sector) and losses in GDP (producing, among the others,
shrinkage of the market in which the company operates) would have a remarkable
impact on the company. Brembo reacts to this risk by differentiating its product
menu in order to cover various segments of the market (PC, CV, motorbike and
racing); furthermore, Brembo operates in 15 countries and 3 Regions, making
possible a well diversification of the risk by geographical area.
ii. Strategic (Medium2;Medium2)
1. Innovation risk [S1]: the risk that one company could develop and distribute competitive
products with superior technology than and before another company.
Mitigant: Brembo is a brand-technological excellence with serious commitment to
high standard of quality and technology advancement. It is for this reason that the
company is investing each year from several years the 5% of its Total Revenues
(€103.7mln in 2015) to develop the most advanced cast-iron discs, technological
alternatives for the manufacture of ceramic discs carbon for motorbike segment,
new carbon material for F1 and GT applications.
2. Segment/Market saturation risk [S2]: the risk that a market in which one company
operates could become year-per-year less profitable due to the maximization of the
products provided in that market.
Mitigant: Brembo targets the Luxury and Premium segments of the automotive
market and, in terms of geography, generates most of its Revenues (86% of the
FY15 Total Revenues) from only two mature markets: Europe and North America.
The company has in place different strategy aiming at broadening the products offer
and its geographical distribution. Furthermore, It started targeting the mid-premium
segment too.
3. Strategic risk [S3]: the risk that affect, or is created by, company’s business strategy
decisions.
Mitigant: Brembo makes use of M&A operations to penetrate and/or consolidate its
presence in the markets in which it operates or is willing to operate in the future
(for instance, China before with a joint venture and then after with the acquisition
of Asimco). Before starting every operation, Brembo assesses very carefully all the
possible risks it could incur in the short/medium and long period, especially the
country risk.
iii. Operating (Medium1;Medium1)
1. Supply chain risk [O1]: the risk that the volatility of raw material prices and the
overreliance on strategic suppliers could jeopardize the company’s production process
and the ability to fill orders from clients in a timely manner by suddenly suspending supply
arrangements.
Mitigant: Brembo puts in place a rigorous process of selecting suppliers for its
production materials through a specific Supplier Risk Management Program.
2. Business Interruption risk [O2]: the risk that operational downtime at production facilities
and continuity of operation could have a negative impact on the company’s business.
Mitigant: Brembo manages this possible issue through the US NFPA (National Fire
Protection Association) standards, aiming at mitigating risk factors in terms of
probability of occurrence and implementing protective measures to limit the impact
of this risk.
3. Product Quality risk [O3]: the risk relating to the marketing of company’s products, in
terms of their quality and safety.
Brembo has instituted a worldwide Supplier Quality Assurance function, specifically
dedicated to quality control of components that do not meet Brembo’s quality
standards, in addition to constantly optimizing its Failure Mode & Effect Analysis
33. ~ 33 ~
iv. Financial
Risks’ Scoring model
(FMEA).
4. Environment, Safety and Health risk [O4]: it is a multi-facing risk. It could be inadequate
protection of employee health and safety, environmental pollution resulting from sources
such as uncontrolled emissions, inadequate waste disposal or the spreading of dangerous
substances onto the ground, partial or non-compliance with laws and regulations
governing the sector.
Mitigant: Brembo has implemented systematic rules and management procedures
that allow it to minimize the number of accidents, as well as the impact they may
have. A clear-cut assignment of responsibility at all levels, the presence of
independent internal control bodies that report to the company’s highest officers and
the application of the highest international management standards are the best way
to guarantee the company’s commitment to health, job safety and the environment.
5. Legal & Compliance risk [O5]: is the risk arising from the failure to rapidly comply with
changing laws and new regulations in the sectors and markets in which the company
operates.
Mitigant: 1) mapping (and periodic updates) by the Legal & Corporate Department of
statutes that provide for administrative liability for companies in effect in all foreign
countries in which Brembo operates; 2) reporting to the Country Committees of
subsidiaries through a specific monitoring system on the main issues of concern in
the areas of compliance, governance, legal/contracts and litigation; 3) adoption and
implementation (through training sessions) of a multiple-tier compliance system.
6. Planning and Reporting risk [O6]: the risk that the company’s data standard of quality,
timeliness and comparability are not met.
Mitigant: Brembo puts in place the Enterprise Resource Planning (ERP) software in
order to prepare accurate and reliable financial reporting.
iv. Financial (Medium2;Medium2)
1. Interest Rate risk [F1]: the risk that change in the interest rate level could negatively affect
the firm’s business.
Mitigant: Brembo generally enter in medium/long-term fixed rate loan agreements.
However, its very low level of debt makes the company only marginally exposed to
this risk.
2. Exchange Rate risk [F2]: the risk that excessive volatility in the exchange rate level could
negatively affect the firm’s business.
Mitigant: Brembo uses forward contracts and natural hedging (offsetting receivables
and payables); the company hedges only net positions in foreign currency, using
mostly short-term financing denominated in the currency to be hedged.
3. Commodity risk [F3]: the risk that a business’s financial performance or position will be
adversely affected by fluctuations in the prices of commodities.
No mitigant actions are undertaking by Brembo. It mainly relies on its Supply Chain
risk management policy.
4. Funding Liquidity risk [F4]: the risk that the company may suffer a lack of ability to obtain
the financial resources necessary to guarantee its operations with immediacy.
Mitigant: Brembo essentially optimize the use of liquidity, ensures that the Net Debt
composition is adequate for the investment it is carrying on and, finally, it ensures a
proper balance between short-term and long-term debt.
5. Credit risk [F5]: the risk that a customer or one of the parties will fail to meet its
obligations in accordance with agreed term.
Mitigant: the parties Brembo deals with are mainly leading premium carmakers and
motorbike manufacturers with solid level of creditworthiness and business.
In order to have a more detailed idea of the severity of the risks which Brembo is exposed to, a
scoring model was developed taking into account similarities and differences of the world of the risks.
One scale was used to give a score to each single risk, with respect to its foreseeable likelihood of
34. ~ 34 ~
happening and its likely impact on the company. The scale range from 1 to 9 and, accordingly, from
Low1 to High3. By computing a simple average of the risks’ scores is possible to estimate an average
level of likelihood and the relative impact, flagging the overall Brembo Risk Exposure.
The Scoring Model Overall Brembo Risk Exposure is “Medium2;Medium2”.
Here below is reported the Risks’ Scoring model table and its graphical representation. Different sizes
and colors of the bubbles were selected to better discriminate the different level of risks’ likelihood of
happening and the risks’ different impact on the company.
Risk family Specific Risk Category Likelihood Impact
External Country E1 High1 High1
Scoring Model External Risk Exposure High1 High1
Strategic
Innovation S1 High2 High2
Segment/Market
Saturation
S2 Medium2 Medium2
Strategic S3 Low1 Low2
Scoring Model Strategic Risk Exposure Medium2 Medium2
Operating
Supply chain O1 High3 High3
Business Interruption O2 Medium3 Medium3
Product Quality O3 Low1 Low2
Environment, Safety and
Health
O4 Low3 Medium1
Legal & Compliance O5 Medium2 Medium2
Planning and Reporting O6 Low2 Low3
Scoring Model Operating Risk Exposure Medium1 Medium1
Financial
Interest Rate F1 Low3 Medium1
Exchange Rate F2 Medium2 Medium2
Commodity F3 High2 High2
Funding Liquidity F4 Low3 Medium1
Credit F5 High1 High1
Scoring Model Financial Risk Exposure Medium2 Medium2
Scoring Model Overall Brembo Risk Exposure Medium2 Medium2
Source: Company data, personal estimates
High Likelihood
High ImpactLow Impact
Low Likelihood
S3
O3
O6
F4
F5
F1
O4
O5
S2
O2
F2 E1
F3
S1 O1