Beginners Guide to TikTok for Search - Rachel Pearson - We are Tilt __ Bright...
Profile Of AAPI Tentatively Eligible Applicants
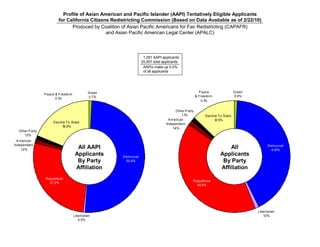
1. Profile of Asian American and Pacific Islander (AAPI) Tentatively Eligible Applicants
for California Citizens Redistricting Commission (Based on Data Available as of 2/22/10)
Produced by Coalition of Asian Pacific Americans for Fair Redistricting (CAPAFR)
and Asian Pacific American Legal Center (APALC)
01,291 AAPI applicants
25,901 total applicants
AAPIs make up 5.0%
of all applicants
Green P eace Green
P eace & Freedo m
0.7% & Freedo m 0.9%
0.1%
0.1%
Other P arty
1.1% Decline To State
A m erican 12.9%
Decline To State Independent
18.9%
1.4%
Other P arty
1.0%
A m erican
Independent Dem o crat
1.2%
All AAPI All 41.9%
Applicants D em o crat
Applicants
By Party 50.4% By Party
Affiliation Affiliation
Republican
R epublican
27.2%
40.8%
Libertarian
Libertarian 1.0%
0.5%
2. Profile of Asian American and Pacific Islander (AAPI) Tentatively Eligible Applicants
for California Citizens Redistricting Commission (Based on Data Available as of 2/22/10)
Produced by Coalition of Asian Pacific Americans for Fair Redistricting (CAPAFR)
and Asian Pacific American Legal Center (APALC)
01,291 AAPI applicants
25,901 total applicants
AAPIs make up 5.0%
of all applicants
Other Party
Other P arty 17.3%
22.4%
Democrat
All AAPI All 41.9%
Applicants D em o crat Applicants
50.4%
By Party By Party
Category Category
Republican
27.2% Republican
40.8%
3. Profile of Asian American and Pacific Islander (AAPI) Tentatively Eligible Applicants
for California Citizens Redistricting Commission (Based on Data Available as of 2/22/10)
Produced by Coalition of Asian Pacific Americans for Fair Redistricting (CAPAFR)
and Asian Pacific American Legal Center (APALC)
01,291 AAPI applicants
25,901 total applicants
AAPIs make up 5.0%
of all applicants
Outside Califo rnia N o rthern Co astal Outside C alifo rnia
N o rthern Co astal 0.6% 0.7%
0.1% 0.5%
So uthern C entral
N o rthern Valley & M o untain
Central 3.8%
No rthern
Valley & Central Valley
M o untain Inland Em pire
& M o untain
8.1% 3.6%
B ay A rea 14.9%
24.4%
So uthern
Central Valley
B ay A rea & M o untain
40.3% 8.3%
All AAPI All
Applicants Applicants Inland
C entral Co astal Em pire
By Region 4.1% By Region 7.8%
So uthern
Co astal
42.1%
So uthern C o astal
39.1%
Central
C o astal
1.5%
4. Profile of Asian American and Pacific Islander (AAPI) Tentatively Eligible Applicants
for California Citizens Redistricting Commission (Based on Data Available as of 2/22/10)
Produced by Coalition of Asian Pacific Americans for Fair Redistricting (CAPAFR)
and Asian Pacific American Legal Center (APALC)
01,291 AAPI applicants
25,901 total applicants
AAPIs make up 5.0%
of all applicants
$ 250,001 $ 250,001
& Over & Over
$ 34,999 $ 34,999
4.6% 4.8%
& Under & Under
13.7% 12.6%
$ 125,000 $ 125,000
- $ 250,000 - $ 250,000
23.5% 21.9%
All AAPI All
Applicants Applicants $ 35,000
$ 35,000
By Household - $ 74,999
By Household - $ 74,999
28.5%
Income 28.2% Income
$ 75,000 $ 75,000
- $ 124,999 - $ 124,999
30.0% 32.3%
5. Profile of Asian American and Pacific Islander (AAPI) Tentatively Eligible Applicants
for California Citizens Redistricting Commission (Based on Data Available as of 2/22/10)
Produced by Coalition of Asian Pacific Americans for Fair Redistricting (CAPAFR)
and Asian Pacific American Legal Center (APALC)
01,291 AAPI applicants
25,901 total applicants
AAPIs make up 5.0%
of all applicants
Fe m ale
Fe m ale
32.4%
34.2%
All AAPI All
Applicants Applicants
By Gender By Gender
M ale
M ale
65.8%
67.6%
6. Profile of Asian American and Pacific Islander (AAPI) Tentatively Eligible Applicants
for California Citizens Redistricting Commission (Based on Data Available as of 2/22/10)
Produced by Coalition of Asian Pacific Americans for Fair Redistricting (CAPAFR)
and Asian Pacific American Legal Center (APALC)
01,291 AAPI applicants
25,901 total applicants
AAPIs make up 5.0%
of all applicants
66 & Over 35 & Under
8.4% 66 & Over 12.4%
18.1%
35 & Under
25.8%
56 - 65 36 - 45
22.4% 15.4%
All AAPI All
Applicants Applicants
By Age By Age
56 - 65
29.0%
36 - 45
21.1%
46 - 55
46 - 55
25.1%
22.3%
7. Profile of Asian American and Pacific Islander (AAPI) Tentatively Eligible Applicants
for California Citizens Redistricting Commission (Based on Data Available as of 2/22/10)
Produced by Coalition of Asian Pacific Americans for Fair Redistricting (CAPAFR)
and Asian Pacific American Legal Center (APALC)
00,651 AAPI Democrats
10,857 total Democrats
AAPIs make up 6.0%
of Democrat applicants
N o rthern Co astal Outside C alifo rnia No rthern Co astal Outside C alifo rnia
0.0% 0.8% So uthern C entral 0.6% 0.8%
Valley & M o untain
N o rthern 3.2%
N o rthern
Central
Inland Em pire Central
Valley & So uthern
2.3% Valley &
M o untain Central Valley
M o untain
8.0% & M o untain
13.1%
6.4%
B ay A rea
28.9%
B ay A rea
AAPI All Inland Em pire
5.7%
44.9% Democrat Democrat
Applicants Applicants
By Region By Region
So uthern
C o astal C entral
Co astal
38.7%
4.5%
So uthern
C o astal
40.0%
C entral Co astal
2.2%
8. Profile of Asian American and Pacific Islander (AAPI) Tentatively Eligible Applicants
for California Citizens Redistricting Commission (Based on Data Available as of 2/22/10)
Produced by Coalition of Asian Pacific Americans for Fair Redistricting (CAPAFR)
and Asian Pacific American Legal Center (APALC)
00,651 AAPI Democrats
10,857 total Democrats
AAPIs make up 6.0%
of Democrat applicants
$ 250,001 $ 250,001
& Over & Over
$ 34,999 4.6% $ 34,999
4.9%
& Under & Under
15.8% 14.3%
$ 125,000 $ 125,000
- $ 250,000 - $ 250,000
21.0% 20.8%
AAPI All
Democrat Democrat
Applicants Applicants
$ 35,000
By Household $ 35,000 By Household - $ 74,999
- $ 74,999
Income 27.6% Income 28.9%
$ 75,000 $ 75,000
- $ 124,999 - $ 124,999
30.6% 31.3%
9. Profile of Asian American and Pacific Islander (AAPI) Tentatively Eligible Applicants
for California Citizens Redistricting Commission (Based on Data Available as of 2/22/10)
Produced by Coalition of Asian Pacific Americans for Fair Redistricting (CAPAFR)
and Asian Pacific American Legal Center (APALC)
00,651 AAPI Democrats
10,857 total Democrats
AAPIs make up 6.0%
of Democrat applicants
Fe m ale Fe m ale
43.3%
AAPI All
43.8%
Democrat Democrat
Applicants M ale Applicants M ale
By Gender 56.7% By Gender 56.2%
10. Profile of Asian American and Pacific Islander (AAPI) Tentatively Eligible Applicants
for California Citizens Redistricting Commission (Based on Data Available as of 2/22/10)
Produced by Coalition of Asian Pacific Americans for Fair Redistricting (CAPAFR)
and Asian Pacific American Legal Center (APALC)
00,651 AAPI Democrats
10,857 total Democrats
AAPIs make up 6.0%
of Democrat applicants
66 & Over
35 & Under
9.1% 66 & Over 14.0%
17.7%
35 & Under
28.4%
56 - 65
36 - 45
22.4% AAPI All 14.8%
Democrat Democrat
Applicants Applicants
By Age By Age
56 - 65
30.3%
36 - 45
46 - 55 20.6% 46 - 55
19.5% 23.3%
11. Profile of Asian American and Pacific Islander (AAPI) Tentatively Eligible Applicants
for California Citizens Redistricting Commission (Based on Data Available as of 2/22/10)
Produced by Coalition of Asian Pacific Americans for Fair Redistricting (CAPAFR)
and Asian Pacific American Legal Center (APALC)
00,351 AAPI Republicans
10,569 total Republicans
AAPIs make up 3.3%
of Republican applicants
N o rthern Co astal Outside C alifo rnia N o rthern C o astal Outside C alifo rnia
0.3% 0.6% 0.4% 0.6%
So uthern C entral
N o rthern
Valley & M o untain
Central
5.1% No rthern C entral
Valley &
M o untain B ay A rea Valley & M o untain
9.4% 18.3% 17.0%
B ay A rea Inland
29.1% Em pire
Central
4.8%
C o astal So uthern
3.6% C entral
AAPI All Valley &
Republican Republican M o untain
11.1%
Applicants Applicants
By Region By Region
Inland
Central Em pire
C o astal 10.3%
0.9%
So uthern
So uthern
C o astal
C o astal
38.7%
49.9%
12. Profile of Asian American and Pacific Islander (AAPI) Tentatively Eligible Applicants
for California Citizens Redistricting Commission (Based on Data Available as of 2/22/10)
Produced by Coalition of Asian Pacific Americans for Fair Redistricting (CAPAFR)
and Asian Pacific American Legal Center (APALC)
00,351 AAPI Republicans
10,569 total Republicans
AAPIs make up 3.3%
of Republican applicants
$ 250,001 & Over
4.0%
$ 250,001
$ 34,999 & Over $ 34,999
& Under 5.3% & Under
10.3% 9.3%
$ 125,000 $ 125,000
- $ 250,000 - $ 250,000
23.6%
27.6% AAPI All
$ 35,000 -
Republican $ 35,000
- $ 74,999
Republican $ 74,999
Applicants 27.4% Applicants 27.9%
By Household By Household
Income Income
$ 75,000 $ 75,000 -
- $ 124,999 $ 124,999
30.8% 34.0%
13. Profile of Asian American and Pacific Islander (AAPI) Tentatively Eligible Applicants
for California Citizens Redistricting Commission (Based on Data Available as of 2/22/10)
Produced by Coalition of Asian Pacific Americans for Fair Redistricting (CAPAFR)
and Asian Pacific American Legal Center (APALC)
00,351 AAPI Republicans
10,569 total Republicans
AAPIs make up 3.3%
of Republican applicants
Fe m ale Fe m ale
21.7% 23.5%
AAPI All
Republican Republican
Applicants Applicants
By Gender By Gender
M ale M ale
78.3% 76.5%
14. Profile of Asian American and Pacific Islander (AAPI) Tentatively Eligible Applicants
for California Citizens Redistricting Commission (Based on Data Available as of 2/22/10)
Produced by Coalition of Asian Pacific Americans for Fair Redistricting (CAPAFR)
and Asian Pacific American Legal Center (APALC)
00,351 AAPI Republicans
10,569 total Republicans
AAPIs make up 3.3%
of Republican applicants
66 & Over 35 & Under
9.4% 35 & Under 8.4%
15.1% 66 & Over
20.9%
36 - 45
14.4%
56 - 65 AAPI All
25.9%
Republican 36 - 45 Republican
20.8%
Applicants Applicants
By Age By Age
56 - 65 46 - 55
29.4% 26.9%
46 - 55
28.8%
15. Profile of Asian American and Pacific Islander (AAPI) Tentatively Eligible Applicants
for California Citizens Redistricting Commission (Based on Data Available as of 2/22/10)
Produced by Coalition of Asian Pacific Americans for Fair Redistricting (CAPAFR)
and Asian Pacific American Legal Center (APALC)
0,289 AAPI Other Party applicants
4,475 total Other Party applicants
Other Party applicants include
decline-to-state and third-party voters
AAPIs make up 6.5% of Other Party
applicants
P eace & Freedo m P eace & Freedo m
0.3% Libertarian 0.5%
2.4% A m erican
Independent
Green
5.2%
3.1%
Green Libertarian
5.0% 5.7%
Other
P arty
4.5% A m erican
Independent
8.0%
AAPI All
Other P arty
Other Party Other Party 6.2%
Applicants Applicants
By Party By Party
Affiliation Affiliation
D ecline To State
74.6%
D ecline To State
84.4%
16. Profile of Asian American and Pacific Islander (AAPI) Tentatively Eligible Applicants
for California Citizens Redistricting Commission (Based on Data Available as of 2/22/10)
Produced by Coalition of Asian Pacific Americans for Fair Redistricting (CAPAFR)
and Asian Pacific American Legal Center (APALC)
0,289 AAPI Other Party applicants
4,475 total Other Party applicants
Other Party applicants include
decline-to-state and third-party voters
AAPIs make up 6.5% of Other Party
applicants
N o rthern Co astal Outside Califo rnia No rthern C o astal Outside C alifo rnia
0.0% 0.3% 0.6% 0.8%
So uthern C entral
N o rthern Valley & M o untain
Central 3.5%
Valley & N o rthern Central
M o untain Inland Valley & M o untain
6.6% Em pire 14.6% So uthern Central
4.8% Valley & M o untain
B ay A rea 6.6%
28.0%
B ay A rea AAPI All
43.6% Inland
Other Party Other Party Em pire
Applicants Applicants 7.0%
By Region By Region
So uthern
Co astal C entral
40.5% C o astal
4.3%
So uthern
Co astal
38.0%
C entral
Co astal
0.7%
17. Profile of Asian American and Pacific Islander (AAPI) Tentatively Eligible Applicants
for California Citizens Redistricting Commission (Based on Data Available as of 2/22/10)
Produced by Coalition of Asian Pacific Americans for Fair Redistricting (CAPAFR)
and Asian Pacific American Legal Center (APALC)
0,289 AAPI Other Party applicants
4,475 total Other Party applicants
Other Party applicants include
decline-to-state and third-party voters
AAPIs make up 6.5% of Other Party
applicants
$ 250,001 & Over
3.9%
$ 250,001
& Over
4.8% $ 34,999 $ 34,999
& Under & Under
13.1% 16.0%
$ 125,000
$ 125,000 - $ 250,000
- $ 250,000 20.8%
23.9%
AAPI All
Other Party Other Party
Applicants Applicants
$ 35,000 -
By Household $ 74,999 By Household $ 35,000
Income 30.4% Income - $ 74,999
28.9%
$ 75,000
$ 75,000 - - $ 124,999
$ 124,999 30.5%
27.7%
18. Profile of Asian American and Pacific Islander (AAPI) Tentatively Eligible Applicants
for California Citizens Redistricting Commission (Based on Data Available as of 2/22/10)
Produced by Coalition of Asian Pacific Americans for Fair Redistricting (CAPAFR)
and Asian Pacific American Legal Center (APALC)
0,289 AAPI Other Party applicants
4,475 total Other Party applicants
Other Party applicants include
decline-to-state and third-party voters
AAPIs make up 6.5% of Other Party
applicants
Fe m ale
Fe m ale 25.6%
29.1%
AAPI All
Other Party Other Party
Applicants Applicants
By Gender By Gender
M ale
70.9% M ale
74.4%
19. Profile of Asian American and Pacific Islander (AAPI) Tentatively Eligible Applicants
for California Citizens Redistricting Commission (Based on Data Available as of 2/22/10)
Produced by Coalition of Asian Pacific Americans for Fair Redistricting (CAPAFR)
and Asian Pacific American Legal Center (APALC)
0,289 AAPI Other Party applicants
4,475 total Other Party applicants
Other Party applicants include
decline-to-state and third-party voters
AAPIs make up 6.5% of Other Party
applicants
66 &
Over 66 & Over
5.5% 12.8% 35 & Under
17.7%
56 - 65
18.0% 35 & Under
32.9%
AAPI All
Other Party 56 - 65 Other Party
Applicants 25.2% Applicants 36 - 45
19.0%
By Age By Age
46 - 55
20.8%
36 - 45
22.8% 46 - 55
25.3%
20. Profile of Asian American and Pacific Islander (AAPI)
Tentatively Eligible Applicants for California Citizens
Redistricting Commission (Based on Data Available as of 2/22/10)
Produced by Coalition of Asian Pacific Americans for Fair Redistricting (CAPAFR)
and Asian Pacific American Legal Center (APALC)
Northern Central
Valley & Mountain
Northern
Shows counties grouped into the same regional
Coastal
groupings used by the California State Auditor.
The colors shown here correspond to the colors
in the previous charts showing the number of
applicants by region.
Bay
Area
Southern Central
Valley & Mountain
Inland Empire
Central Coastal
Southern Coastal
21. Profile of Asian American and Pacific Islander (AAPI) Tentatively Eligible Applicants
for California Citizens Redistricting Commission (Based on Data Available as of 2/22/10)
Produced by Coalition of Asian Pacific Americans for Fair Redistricting (CAPAFR)
and Asian Pacific American Legal Center (APALC)
Technical Notes:
Figures are based on data available at the California State Auditor’s website as of February 22, 2010 concerning individuals who
submitted applications for the Citizens Redistricting Commission and who are considered “tentatively eligible.”
Applicants whom the State Auditor deems to be “tentatively eligible” based on information provided by applicants are eligible to participate
in the next phase of application process (the supplemental application period).
The figures presented here are based on the number of tentatively eligible applicants as of February 22, 2010. This number may change
depending on the State Auditor’s decisions with respect to reconsideration requests submitted by applicants who were initially deemed
ineligible.
The number of AAPI applicants presented here includes individuals who identified as “Asian” or “Pacific Islander” in their application
forms. Because of technical issues, this number does not include individuals who identified as “Other” in their application forms and
indicated a multi-racial Asian or Pacific Islander background.