Influence of Labour Turnover on Business Growth: A Case Study of Petrol Stati...
WSC 2013 - Harrell Gladwin Hoag - Final
1. Proceedings of the 2013 Winter Simulation Conference
R. Pasupathy, S.-H. Kim, A. Tolk, R. Hill, and M. E. Kuhl, eds
MITIGATING THE “HAWTHORNE EFFECT” IN SIMULATION STUDIES
Charles R. Harrell Bruce Gladwin
Ira A. Fulton College of Engineering and
Technology
Brigham Young University
V.P. of Consulting
ProModel Corporation
556 N Technology Way
Provo, UT 84602, USA Orem, UT 84097, USA
Michael P. Hoag
Capacity Manager
Home Depot
2455 Paces Ferry Rd, C15
Atlanta, GA 30339, USA
ABSTRACT
Though little research has been published on the influence of the Hawthorne effect in simulation studies,
it is an inescapable phenomenon that can have a dramatic impact on both data gathering and model vali-
dation. This paper examines the potential impact of the Hawthorne effect on simulation studies and pre-
sents several case studies where it has occurred and been successfully managed. Techniques for detecting
and dealing with this psychological phenomenon are presented.
1 INTRODUCTION
A common phenomenon that occurs in open observation studies of workplace modification is that
participants, conscious (or even just suspicious) of being observed, will alter their normal behavior, often
in a positive direction. The tendency of people to increase their work pace and perform better when they
sense they are being observed is referred to as the “Hawthorne effect.” (The negative reaction to observa-
tion impelling one to slow down is sometimes referred to as negative or reverse Hawthorne effect.) The
Hawthorne effect got its name from the Hawthorne Works plant of Western Electric near Chicago where
the phenomenon was first observed during a study on the impact of varying levels of lighting on worker
productivity in 1924. According to Blalock and Blalock (1982), to the surprise of the researchers, “each
time a change was made, worker productivity increased…. As a final check, the experimenters returned to
the original unfavorable conditions of poor lighting…. Seemingly perversely, productivity continued to
rise.” When assessing human performance under conditions where the Hawthorne effect may be present,
the analyst must determine whether an increase in human performance is due to the subject’s awareness
of being observed rather than to actual improvements made to the workplace or work methods.
One of the stated benefits of doing computer simulation is the presumptive freedom from the Haw-
thorn effect, since the experiment is conducted using digital representations of people rather than actual
people. In contrasting real-world experimentation with simulation, Robinson (2004) observes, “It
is…likely that experimentation with the real system will lead to the situation where staff performance im-
2. Harrell, Gladwin, and Hoag
proves simply because some attention is being paid to them.” Though not explicit, the clear implication of
this statement is that such a situation doesn’t occur with simulation experiments. Phillips (2004) expressly
states that “people who are observed…often behave differently compared to times when they are not ob-
served. This ‘Hawthorne effect’ is obviously not present in a computer simulation.” Though perhaps un-
intentional, these observations leave an unwarranted impression that simulation studies are immune to the
Hawthorne effect.
Surprisingly, very little research has been published on the potential impact of the Hawthorne effect
in simulation studies and even less on how it can be mitigated. A search through all past Winter Simula-
tion Conference proceedings from 1968 to 2012 showed only two papers even mentioning that the Haw-
thorne effect should be a consideration when doing simulation. Neither of these two papers addressed
ways of detecting or mitigating this effect. An extensive Google search showed only three articles that
addressed the Hawthorne effect in simulation studies in any substantive way. These articles provide the
source material for three of the case studies on Hawthorne-effect mitigation presented below.
When simulating human systems there are two phases of the simulation study where the Hawthorne
effect is likely to occur. One is during data gathering and the other is during model validation. Each of
these activities is discussed below with examples of how the Hawthorne effect was detected and mitigat-
ed.
2 THE HAWTHORNE EFFECT IN DATA GATHERING
2.1 Recognizing the Phenomenon
In the simulation literature surveyed for this study, all mention of the Hawthorne effect pertained to the
data gathering phase of a simulation study, and more specifically to the measurement of manual task
times. It is important to recognize, however, that the Hawthorne effect can impact not only task times, but
also other areas of human behavior, such as break times, quality of work and the order in which tasks are
performed.
There are certainly ways to conduct human performance studies without inducing the Hawthorne ef-
fect (e.g., hidden observation, measuring results instead of behavior, etc.). A common technique in time
and motion studies is simply to inform the worker of the purpose of the time study, so they don’t feel like
they are under the microscope. Inevitably, there will be instances where the Hawthorne effect is unavoid-
able and must simply be taken into consideration in the observer’s analysis of the data. Following are four
cases in which the Hawthorne effect was effectively screened or mitigated while gathering input data for
simulation.
2.2 Case 1: Oil Change Center
A rather straightforward example of avoiding the Hawthorne effect in a simulation study is described by
Williams et al. (2005) in connection with the simulation of an oil change center. As part of the study, data
were gathered on service times associated with changing oil, transmission fluid and engine coolant. Rec-
ognizing that Hawthorne effect would be a factor in observing service times, a way was found to gather
service times unobtrusively, thus avoiding any worker perception that they were being observed. To en-
sure that workers were unaware of being observed, times were afterwards checked against worker recol-
lections and log books to corroborate the measurements. This simple method of avoiding the Hawthorne
effect proved to be effective in this situation.
2.3 Case 2: Tuna Canning
A canned tuna producer belatedly recognized the Hawthorne effect when gathering time/motion data for a
simulation study of a canning line in a tuna plant. When the collected data were used in a ProModel simu-
lation model, it was realized that the simulation provided abnormally better predicted results than actual
3. Harrell, Gladwin, and Hoag
historical output. After investigating several possible factors that might be contributing to the difference
in results, the analysts compared the output for the period during which workers were observed with re-
cent, similarly scheduled production days and concluded that the workers were indeed producing at high-
er than normal efficiency levels. It was concluded that the operators accelerated their work pace when
they became conscious of being observed.
The solution for eliminating the Hawthorne effect in the study was to set up a simple data acquisition
system whereby PLC performance on the filler servo was monitored via their factory network. This data
provided them with accurate and to-the-second up-time performance for the line. It further provided a
more accurate identification of the sources of downtime. Each servo emitted a unique signal so that the
specific operator or piece of equipment which caused the downtime could be determined. The PLC-
gathered data was then used to populate the model which produced results that were much more aligned
with historical data of fill-line performance. The lesson learned was that data gathering isn’t just about
accurately recording times, but recording the right times under the right conditions. In this case, an indi-
rect method of worker observation proved to be effective.
2.4 Case 3: Retail Checkout
A third example involving the Hawthorne effect took place in a simulation study while collecting custom-
er service times for cashiers in a retail checkout station (Williams et al. 2002). In this example, a rather
clever method was used to identify the difference in performance due to the Hawthorne effect. In the
study, customer service time data were gathered either by examining videocassette recordings from the
security cameras or by direct onsite observation. Use of the security videotapes was preferred over direct
observation because it was unobtrusive and therefore provided more objective data. This worked well
when the checkout area was not congested and no more than two checkout lines were open. However, un-
der extremely busy conditions, the necessarily careful examination of these tapes became impractical to
impossible, so on-site manual data collection was necessary. The cashiers seemed to feel uneasy and ap-
peared to be working faster as a result of being observed—an ostensible manifestation of the Hawthorne
effect. However, after further consideration the analysts identified two hypotheses explaining the reason
for this increase in work pace:
1) The cashiers worked faster because they were under observation (the Hawthorne effect).
2) The cashiers worked faster because they felt pressured by the long lines.
Obviously, to the degree that hypothesis 2 contributed to the increase in work pace, that increase should
be included into the simulation model. Any increase in work pace due to the Hawthorne effect (hypothe-
sis 1), on the other hand, should be excluded from the model.
To determine how much of the increased work pace was due to the Hawthorne effect, data collection
was repeated for a slack period and the data thus obtained were compared to the data that had been col-
lected from the videotapes. The mean difference was attributed to the Hawthorne effect. This difference
was then subtracted from the increase in work pace (determined by the difference between the perfor-
mance during the videoed slack period and the manual peak period) to obtain that portion of the increase
attributable to workload pressure. The remainder was then attributed to the Hawthorne effect.
2.5 Case 4: CNC Machine Shop
The final example of the Hawthorne effect in data gathering comes from a simulation study conducted by
Williams et al. (2001) in which a ProModel simulation model was created for a machine shop which had
four semi-automatic, CNC (computer numerically controlled) machines. These machines required parts
to be manually loaded and unloaded. Collecting data on the length of automatic cycles was routine, but
collecting data on the manual load and unload times induced the Hawthorne effect. To mitigate this effect
the following steps were taken:
4. Harrell, Gladwin, and Hoag
1. The two data collectors, who had strong interpersonal skills, developed a rapport with the workers
being observed.
2. Data were collected over an extended period of time to help workers adjust to the data collectors,
who became psychologically inconspicuous.
3. The data collectors assessed the level of trust between management and workers and were able to
determine that workers were confident that data were being collected for process improvement,
not as a prelude to censure.
As an added precaution, a few atypical data points collected early (while the Hawthorne effect may have
still been operative) were discarded if clearly shown to be outliers.
3 THE HAWTHORNE EFFECT IN MODEL VALIDATION
3.1 Recognizing the Phenomenon
The second phase of a simulation study where the Hawthorne effect comes into play, and for which no
documented research could be found, is the validation phase. The DoD defines validation as “The process
of determining the degree to which a model or simulation… [is] an accurate representation of the real
world” (2009). The degree to which a model represents real-world behavior is best determined through
empirical validation in which the simulation results are compared with the results of the real system (Law
2007, Sargent 2012). The premise is that if there is reasonable agreement in the results, the model is valid.
Empirical validation can be conducted at the completion of the simulation experiment if the real system
already exists and performance data from the system are readily obtainable. If it is a system yet to be im-
plemented, however, empirical validation may have to wait.
It should be apparent that when dealing with human systems, an empirical validation may produce a
Hawthorne effect, especially if workers believe they are being observed. In such instances it is difficult to
tell whether differences between the simulation results and real-world results are due to the model being
invalid or to a Hawthorne effect in the real system. This failure to screen for Hawthorne effect can result
in a type I error in which the model is rejected as an invalid model, when in fact it may actually be valid.
3.2 Case 5: Home Improvement Retailer
The presence of the Hawthorne effect in model validation was recently seen in a simulation study con-
ducted by a large home improvement retailer. The retailer was experiencing rapid growth, and was invest-
ing heavily in the development of its own internal supply chain system of distribution centers (DCs)
across the country. In order to increase the total volume of product shipped through its own distribution
network while controlling costs, the retailer is constantly seeking ways to increase the efficiency and
throughput of its DCs.
Studies showed that a critical bottleneck in the retailer’s DCs is the PTS (put-to-store) area. This is
where pallets of non-conveyable product are broken down and sorted according to the store to which they
are to be shipped. These palletized cartons are retrieved by forklift from a PTS staging area and taken to
multiple store drop-off points where the forklift operator removes the cartons destined for a particular
store and loads them onto a separate outbound pallet. This consolidation of cartons by store continues un-
til an outbound pallet is full, at which time, the forklift operator signals for the pallet to be picked up by
another forklift to be taken to shipping. The PTS area is divided into multiple zones with as many as six
forklifts dedicated to each zone. The key performance metric for measuring the throughput rate of the
PTS area is cartons per (man) hour or CPH.
Increasing the throughput (CPH) of the PTS area can be challenging because at some point simply
adding more forklifts increases traffic congestion and becomes a safety concern. Traffic congestion is par-
ticularly severe when multiple forklifts are attempting to unload cartons whose ultimate
5. Harrell, Gladwin, and Hoag
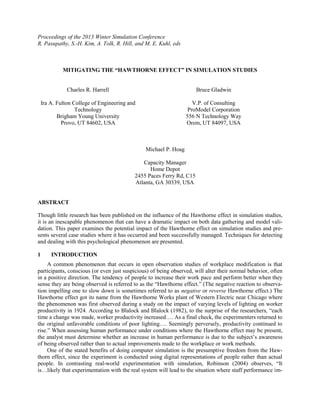
destination is the same store. Outbound pallets are staged on both sides of each primary aisle, and the
forklifts have to maneuver back and forth across the aisle depending upon which stores have a demand for
the product being placed. A snapshot of the ProModel animation showing this original PTS layout is
shown in Figure 1.
Figure 1. Animation Snapshot of Original Layout
One DC attempted to pilot a new layout which partially addresses the forklift congestion by creating
aisles where outbound pallets are positioned on only one side, allowing for a passing lane on the opposite
side. Each single aisle therefore became twice the length of the aisles in the original layout. The pallets
were also angled to conserve aisle space by making them easier to pick up and take away to the outbound
queue. An added bonus of the proposed layout is that it reduces the floor space of the PTS area by rough-
ly 25% over the original layout. This reduction in floor space was made possible by having the take-away
forklifts use the same aisle to access the outbound pallets as the PTS forklifts used to build the pallets. In
the original system the take-away forklifts accessed the outbound pallets from a back aisle.
The formation of single-sided aisles was intended to minimize forklift congestion and facilitate fork-
lift maneuverability by eliminating side-to-side travel down a double aisle. An animation snapshot of the
proposed PTS area is shown in Figure 2.
PTS STAGING - INBOUND
PTS STAGING - OUTBOUND
6. Harrell, Gladwin, and Hoag
Figure 2. Animation Snapshot of Proposed Layout
This proposed layout was already being piloted in one of the retailer’s DCs, and a ProModel simulation
model was being developed to test the merits of the new layout under different levels of product demand
and mix. Preliminary results from the real-life pilot were promising, showing that relieving forklift con-
gestion could increase the throughput of the system—even if the forklifts had to travel longer distances to
avoid congestion. In the pilot facility the CPH jumped by 17% over what it was previously capable of
achieving. With this demonstrated improvement in CPH, an initiative was underway to implement the
proposed layout in the other DCs across the country, at the cost of over $1 million.
Before finalizing the decision to incorporate the new proposed layout, the retailer ran several simula-
tion experiments to validate the model in order to better understand the implications of the proposed
changes. As simulation experiments were run, the analysts were astonished to discover that instead of im-
proving CPH by 17%, the proposed new layout was projected to reduce CPH by 3.4%. In other words, the
simulation predicted exactly the opposite results from what they were seeing in the pilot system. Accord-
ing to the simulation, the key consequences of reduced throughput would be an increase in the amount of
labor expenses for the same amount of volume, and an increase in cycle time through the process. This
discrepancy between the simulation results and the actual pilot system performance was baffling.
Upon further investigation, it was determined that the Hawthorne effect was largely responsible for
the difference in results. In the pilot system, workers were conscious of being under the microscope and
therefore either deliberately or unconsciously improving their performance. Further, as a multiple-DC
supply chain with increasingly strict controls around process changes and standardized operating proce-
dures, the management and engineering teams responsible for developing the “rogue” pilot were similarly
PTS STAGING - OUTBOUND
PTSSTAGING-INBOUND
7. Harrell, Gladwin, and Hoag
under pressure to achieve positive results as a consequence of investing in a new system. This expecta-
tion of increased throughput from local leadership also likely produced a Hawthorne-like effect beyond
that traditionally thought to be caused by simple scientific observation. The simulation, on the other
hand, was completely unbiased and used the same assumptions regarding forklift travel speeds, put and
pick times, and operator work methods across both scenarios. If used as a pilot itself, it could have avoid-
ed significant cost and production downtime as well.
In the end, the existing system proved to be more efficient because the frequency and duration of
forklift blockages were far less substantial than the increased travel distances required by the pilot layout
that was developed to reduce forklift congestion. It is noteworthy that the performance gain realized in the
pilot DC that was attributed to the Hawthorne effect was not sustained. Shortly after the decision was
made to cancel the expansion of the proposed new PTS layout into the other facilities, the CPH rate began
to drop from the 17% improvement down to around 6%. This was further evidence that at least the major-
ity of performance improvements seen in the pilot DC was a function of the Hawthorne effect and not re-
lated to the layout change.
4 CONCLUSION
In conclusion, the Hawthorne effect is a phenomenon in simulation studies that should be taken seriously.
Whenever dealing with human systems, consideration must be given to the methods in which data is
gathered and models are validated. Otherwise, the Hawthorne effect can produce models based on invalid
data or cause one to erroneously reject a valid model. As demonstrated in the cases presented, there are
effective ways to either minimize Hawthorne effect in data gathering and model validation or, at the very
least, detect and filter out Hawthorne effect when it does occur.
In testing for the Hawthorne effect the following guidelines can help:
Compare observed times against logs, recollections, indirect measures or other sources of unbi-
ased data.
Validate the model (e.g., compare the simulation output with actual performance output). A valid
model is an indication of valid input data. One should be careful to avoid the Hawthorne effect
when observing actual system performance as part of the validation process (illustrated in case 5).
Be careful to avoid mistaking the Hawthorne effect for an increase in work pace due to legitimate
factors (see case 3 above).
Ways to mitigate the Hawthorne effect, whether during the data gathering phase or model validation
phase of a simulation study include the following:
Develop a rapport with workers being observed so they feel comfortable working at a normal
pace.
Assure workers that the purpose of the study is to improve the process, not pass judgment on
worker performance.
If practical, gather data over a long period of time to allow workers to settle into normal work
patterns.
If possible (and permissible), find way to gather data that is unobtrusive so that workers are una-
ware of their being studied.
If practical, gather data indirectly through automatic data capture or conferring with logs or other
records that might be available.
8. Harrell, Gladwin, and Hoag
REFERENCES
Blalock, A. B., H. M. Blalock. 1982. Introduction to Social Research. Englewood Cliffs,
NJ: Prentice-Hall.
Law, A. 2007. Simulation Modeling and Analysis, Fourth Edition, New York, NY: McGraw-Hill.
Payne G., J. Payne. 2004. Key Concepts in Social Research. London, England: Sage Publications.
Phillips, J. 2004. Topic 8: Simulation and Queuing Theory. Accessed April 15.
http://www.macs.hw.ac.uk/~jphillips/DAS/DataAnalysisTopic8.pdf.
Robinson, S. 2004. Simulation: The Practice of Model Development and Use, West Sussex England:
Wiley & Sons, LTD.
Sargent, R. 2012. “Verification and Validation of Simulation Models,” Journal of Simulation, vol. 7.
http://www.palgrave-journals.com/jos/journal/v7/n1/full/jos201220a.html#.
Williams, E. J., J. D. Bales, Jr., J. A. Clark, R. M. Amodeo. 2005. “Simulation Improves Staffing Proce-
dure at an Oil Change Center,” In Proceedings 19th European Conference on Modelling and Simula-
tion, Edited by Y. Merkuryev, R. Zobel, E. Kerckhoffs. ECMS.
Williams, E. J., D. Darwactor, L. Shorkey. 2001. “Evaluation of Machine Shop Logistic
Alternatives Using Simulation,” In Proceedings of the 13th European Simulation Symposium, Edited by
N. Giambiasi and C. Frydman.
Williams, E. J., M. Karaki, C. Lammers. 2002. “Use of Simulation to Determine Cashier Staffing Policy
at a Retail Checkout,” In Proceedings 14th European Simulation Symposium, Edited by A. Ver-
braeck, W. Krug. SCS Europe BVBA.
___________________. Department of Defense Instruction. 2009. Accessed April 15 at
http://www.dtic.mil/whs/directives/corres/pdf/500061p.pdf.
AUTHOR BIOGRAPHIES
CHARLES HARRELL is an Associate Professor of Manufacturing Engineering Technology at Brigham
Young University and director at ProModel Corporation. His research interests are in system simulation
and process improvement. He is a senior member of IIE and SME. His email is harrellc@byu.edu.
BRUCE GLADWIN is Vice President of Consulting Services at ProModel Corporation in Orem, UT,
with responsibility for all consulting operations. He has been with ProModel for 18 years, with over 25
years of experience in simulation of manufacturing, logistics and service systems.
MICHAEL HOAG is the Capacity Manager for The Home Depot Supply Chain team and is a graduate
of the Leaders For Manufacturing program at MIT. He is a subject matter expert in Lean Manufacturing,
and uses simulation tools in both production and distribution environments.