2. June 16, 2014
Eugene Bike Share Feasibility Study │ii
Contents
Executive Summary...................................................................................................................................... iv
1 Introduction ..........................................................................................................................................2
1.1 Report Organization......................................................................................................................2
2 What is Bike Share? ..............................................................................................................................5
3 Benefits of Bike Share...........................................................................................................................9
3.1 Mobility, Transportation, and Community Building Benefits.......................................................9
3.2 Economic Benefits.......................................................................................................................13
3.3 Health Benefits............................................................................................................................15
3.4 Environmental Benefits...............................................................................................................16
3.5 Safety Benefits ............................................................................................................................17
3.6 Summary of Benefits and Risks...................................................................................................21
4 Comparable Cities...............................................................................................................................23
4.1 Boulder B-Cycle...........................................................................................................................26
4.2 Chattanooga Bike Transit System ...............................................................................................28
4.3 Fort Worth Bike Sharing..............................................................................................................29
4.4 GREENbike – Salt Lake City .........................................................................................................29
4.5 Summary of Experience in Peer Cities ........................................................................................31
5 System Goals.......................................................................................................................................34
6 Public and Stakeholder Engagement ..................................................................................................36
6.1 Public Input .................................................................................................................................36
6.2 Stakeholder Engagement............................................................................................................43
6.3 Compatibility with the University of Oregon Bike Share System ...............................................45
7 System Planning..................................................................................................................................49
7.1 Community Analysis....................................................................................................................49
8 Preliminary System Plan .....................................................................................................................66
8.1 System Phasing ...........................................................................................................................66
8.2 Preliminary Station Locations .....................................................................................................68
8.3 Permitting and Station Siting Guidelines ....................................................................................70
9 Business Model Evaluation .................................................................................................................74
10 Financial Analysis ................................................................................................................................81
3. June 16, 2014
Eugene Bike Share Feasibility Study │iii
10.1 Financial Pro-Forma....................................................................................................................81
10.2 Funding Plan................................................................................................................................89
11 Implementation Plan ..........................................................................................................................95
11.1 Site Planning and Permitting.......................................................................................................95
11.2 Marketing Plan............................................................................................................................98
11.3 Operations Preparation ............................................................................................................104
11.4 Performance Standards ............................................................................................................105
11.5 Implementation Timeline..........................................................................................................106
12 Summary and Conclusion .................................................................................................................109
Appendices (under separate cover)
Appendix A – Public Meeting Summary
Appendix B – Online Survey Results
Appendix C – Stakeholder Meeting Themes
Appendix D – Example Memorandum of Understanding from Hubway
Appendix E – Community Analysis Mapping
Appendix F – Preliminary Phase-by-Phase Station Maps
Appendix G – Site Planning Guidelines
Appendix H – Station Examples
Appendix I – Business Model Evaluation
Appendix J – U.S. Bike Share System Data Summary
Appendix K – Sponsorship Examples
Appendix L – Sponsorship Marketing Packet – Portland, OR
Appendix M – Implementation Flow Chart
4. June 16, 2014
Eugene Bike Share Feasibility Study │iv
Executive Summary
Lane Transit District (LTD) and the City of Eugene (City) engaged Toole Design Group to assess the
feasibility of implementing a bike share system in Eugene, Oregon. Bike share would build on the City’s
existing reputation as a Bicycle Friendly Community and continue efforts to grow bicycling as a
transportation mode and integrate it with the region’s transit options.
The University of Oregon is also an important player. The University of Oregon Bike Program is planning
to launch a four station bike share system on the University of Oregon campus in 2015 and it is logical
that any expansion into the City of Eugene (and potentially to other parts of the region in the future) be
integrated with one another, allowing a seamless user experience between jurisdictions.
Bike share is a public transportation option that allows users to access bicycles located at self-service
stations around the community and take bicycles from one station to another. The feasibility study
explores the benefits and challenges of launching a bike share system, drawing from experience in cities
of similar size, with a college presence, and
similar transportation infrastructure to
Eugene.
Some of the major benefits that bike share
could bring to Eugene include:
• Providing an additional transportation
option that, combined with other
transportation options, presents an
opportunity to reduce dependence on
automobile transportation.
• Expanding and enhancing existing
transit services by providing a first-
and last-mile option and an
opportunity to relieve already over-capacity transit services.
• Introducing new riders to the benefits of bicycling and spurring new impetus for further
investment in bicycling facilities.
• Building on the City’s reputation as a forward-thinking, bicycle-friendly community and using
bike share to promote the City to potential employers, residents, and visitors.
The major challenges are:
• Ensuring that sufficient funding is available to support capital, expansion, and ongoing
operations. Most bike share systems are not economically self-sustaining from membership and
usage fees alone.
• Understanding local policies that may limit the placement of stations and the ability to generate
revenue through sponsorship or advertising.
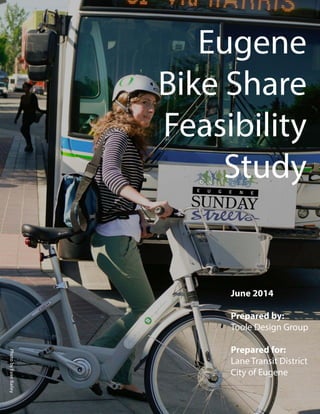
Figure 1: Greenbikes is a Bike Share System in Salt Lake City.
5. June 16, 2014
Eugene Bike Share Feasibility Study │v
To understand the areas most suited to bike share, the project team undertook a community analysis, a
demand mapping exercise, and engaged the public (in person and via the project website) to suggest
potential station locations. This information was assembled to produce the phasing and preliminary
station plan shown in Figure 2.
The plan calls for a 46 station / 420 bike system to be deployed in five phases starting with the four
station system on the University of Oregon campus in 2015. The system would then expand into
Downtown, to the Whiteaker, Amazon, and Jefferson Westside neighborhoods as well as into the north
side of the Willamette River.
Figure 2: Preliminary Phasing and Station Plan for Eugene Bike Share.
Based on input received from public meetings, online surveys, and stakeholder engagement, a set of
goals and objectives were developed for a potential bike share system in Eugene. System priorities
include:
1. Personal Mobility: integrating bike share with existing transit services and connecting
Downtown Eugene and the University of Oregon.
2. Bicycling, Health, and Safety: increasing the prevalence and role of bicycling in Eugene and
encouraging improved health and safety outcomes.
3. System Quality: operating a well-designed and well maintained system that is oriented towards
high customer service standards.
4. Long Term Financial Sustainability: ensuring sustainable sources of capital and operations
funding relying on minimal local public assistance.
5. Social and Geographic Equity: ensuring the system is accessible and affordable to all
socioeconomic groups.
6. June 16, 2014
Eugene Bike Share Feasibility Study │vi
6. Economic Benefits: create a system that will benefit local business, draw national attention, and
attract new employers, residents, and businesses.
After establishing the goals and objectives
consideration moved into determining a
governance structure for the system that
would be able to best achieve local
priorities. The most common bike share
business models from the United States
were assessed, including agency owned and
privately operated, non-profit owned and
operated, and privately owned and
operated. Considering the advantages and
disadvantages of each operating model
resulted in the selection of a non-profit run
system for Eugene. This operating model
has the following advantages:
• The non-profit model maximizes fundraising opportunities.
• The community-oriented mission of the non-profit aligns with many of the goals of bike share in
Eugene.
• The non-profit model is able to span jurisdictional boundaries.
• The non-profit model makes for the easiest integration with the University of Oregon system.
• The non-profit model transfers risk and financial responsibility away from the public agencies.
• The non-profit model maintains transparency through agency representation on the Board of
Directors.
The 46 station / 420 bike system is expected to cost approximately $2.3 million. With University of
Oregon already committing $0.2 million to the first four stations, there is a capital funding shortfall of
$2.1 million. It is proposed that a capital funding grant be sought from federal or state grant
opportunities, which will require a 20-percent local match that could come from the University of
Oregon’s campus bike share fund and a combination of private, philanthropic, or local public funding
sources.
The system will cost approximately $2.6 million to operate for the first five years. User revenues are
expected to cover approximately $1.4 million (or 54-percent) of the operating expenses. The remaining
$1.2 million could come from sponsorship or advertising on the stations and bikes, direct contributions
from the University of Oregon and other private interests, and local public funding.
A year-by-year breakdown of costs and revenues is included in Table 1.
Figure 3: Riders Using the Fort Worth Bike Share System.
7. June 16, 2014
Eugene Bike Share Feasibility Study │vii
Table 1: Summary of Funding Need for Eugene Bike Share System
Year 1 Year 2 Year 3 Year 4 Year 5 Total
Capital Cost $ (1.1 M) - $ (0.4 M) $ (0.5 M) $ (0.3 M) $ (2.3 M)
University of Oregon
Funding
$ 0.2 M - - - - $ 0.2 M
Capital Funding Need $ (0.9 M) - $ (0.4 M) $ (0.5 M) $ (0.3 M) $ (2.1 M)
Operating Cost $ (0.3 M) $ (0.4 M) $ (0.5 M) $ (0.6 M) $ (0.8 M) $ (2.6 M)
User Revenue $ 0.1 M $ 0.2 M $ 0.3 M $ 0.4 M $ 0.4 M $ 1.4 M
Operating Funding Need $ (0.2 M) $ (0.2 M) $ (0.2 M) $ (0.2 M) $ (0.4 M) $ (1.2 M)
Implementation would take anywhere between 12 and 24 months and the process would include:
• Organizing and administering the non-profit.
• Fundraising and procurement.
• Site planning.
• Branding and marketing.
• Setting up operations.
• Deployment.
• System launch.
Based on this analysis, a bike share system in Eugene appears feasible. Partner agencies should begin
organizing a non-profit organization charged with taking the concept forward and securing capital
funding for the system.
9. June 16, 2014
Eugene Bike Share Feasibility Study │2
1 Introduction
Lane Transit District (LTD) and the City of Eugene (City) engaged Toole Design Group (TDG) to investigate and
determine the feasibility of a bike share system in Eugene, Oregon. TDG was also tasked with identifying an
appropriate scale and operational model to implement an effective system that complements the proposed bike
share system on the University of Oregon campus, integrates with the transit network, provides high visibility
and improved mobility options, and draws the attention of potential employers, future residents, and visitors.
There have been several recent initiatives aimed at introducing bike share to Lane County. The City and LTD
have actively sought capital funding and previously applied for a Federal Transit Administration (FTA) Livability
Grant. While that application was denied, the City recently applied for a ConnectOregon Grant and although it
also was not successful, the application showed that there is a groundswell of support for bike share in the
community with letters of support provided by developers, businesses, and community organizations. The intent
of this study is to focus efforts and to develop a guiding document that can be used as an implementation
blueprint for partner agencies and a tool for attracting funding and support for the system.
The University of Oregon was also a partner in the FTA Livability Grant.
In 2012, the student government granted the University of Oregon
Bike Program $199,000 and agreed to use this funding for FTA
Livability grant match requirements. Since the grant was unsuccessful,
the funds will be used to purchase and install four stations and 40
bikes on campus in 2015.
Initially, the University of Oregon Bike Program will operate the bike
share system on campus. However, they have indicated that
operations would likely be turned over to another organization once
the system expands beyond the campus1
. Membership is likely to be
offered at a reduced rate to University of Oregon students, while the
general public and faculty / staff will pay more. The service could also become part of the University of Oregon
group bus pass program, though this would require coordination with LTD as the group pass program
administrator.
An important part of this study is to determine how the University of Oregon system will integrate with an
expanded system in Eugene. This includes equipment compatibility, overcoming sponsorship and advertising
limitations on the University campus, maintaining compatible fee structures, and contracting and income
distribution across multiple jurisdictions.
1.1 Report Organization
This feasibility study follows the framework outlined in Figure 1.1. It includes phases for information gathering,
goal setting, community and environmental analysis, evaluation of feasibility, system development, and
implementation considerations. The completion of each phase resulted in the chapters described below.
1
Based on conversations with Briana Orr, University of Oregon Bike Program Coordinator on November 19, 2013.
“The intent of this study is to
focus efforts and to develop
a guiding document that can
be used as an
implementation blueprint for
partner agencies and a tool
for attracting funding and
support for the program.”
10. June 16, 2014
Eugene Bike Share Feasibility Study │3
Chapter 1 (this chapter) introduces the purpose of the study and provides background on the past efforts of the
City, LTD, and University of Oregon.
Chapter 2 introduces bike share and Chapter 3 describes the economic, transportation, health, environmental,
and safety benefits and risks of bike share. Chapter 4 describes the experiences of cities similar to Eugene,
identifying how their systems were established and how they overcame certain challenges in those
communities.
Chapter 5 outlines the system goals identified by the project partners. These are important as they set the
parameters for how the system will be set up and what will constitute success. Chapter 6 outlines the public and
stakeholder engagement process, feedback received from that process, and how public comment was
incorporated into the study. Chapter 7 presents the results of a community analysis that explores the
preparedness of the region for bike share and these results are
combined with the proposed system goals and community and
stakeholder feedback to develop a preliminary system plan and
phasing strategy that is outlined in Chapter 8.
Chapter 9 evaluates different business models that have been
used to operate bike share systems in the United States and
offers a recommendation on the most appropriate model and
the roles of the regional partners under this model.
A financial analysis, which includes a business pro-forma that
compares costs and revenues based on experience in other
cities, is included in Chapter 10. A potential funding plan for
capital and operations is also presented.
Implementation is considered in Chapter 11, including
development of an implementation flow chart and advice on
station permitting, performance standards, and liability
considerations. A marketing plan is also included in this chapter.
Chapter 12 concludes the report with a summary of study
outcomes and recommendations. Public process documents,
maps, and sample agreements are provided in the appendices.
Information Gathering
Goal Setting
Community &
Environmental Analysis
Assess Feasibility
Program Development
Implementation
Considerations
Figure 1.1: Feasibility Study Process.
12. June 16, 2014
Eugene Bike Share Feasibility Study │5
2 What is Bike Share?
Bike share is an innovative transportation system, whereby system subscribers have access to public bicycles
through self-service kiosk locations around the community. The system is accessed through low-cost
subscriptions ranging from a few dollars for one-day to between $50 and $100 for annual membership.
There are a number of different bike share technologies available. Most of the systems in the United States
utilize “station-based” technology that include a computerized terminal where transactions and information are
processed to release and lock the bicycles at a series of connected docks. The components of station-based bike
share system are shown on Figure 2.22
and include:
• Station: the collective grouping of the following elements:
o Kiosk: the electronic terminal where all rental transactions are made;
o Information Panel: a display that can be used to provide maps, information about the system,
and space for advertising;
o Dock: the mechanism that holds the bicycles. Each dock has a mechanized locking system that
locks and releases the bicycles;
2
Bike Sharing in the United States: State of the Practice and Guide to Implementation. Federal Highway Administration. United States
Department of Transportation. September 2012.
Figure 2.1: Example of a Bike Share System in Minneapolis / St. Paul, MN.
Source: Dunn Bros Coffee
13. June 16, 2014
Eugene Bike Share Feasibility Study │6
o Platform: the structure that holds the kiosk, information panel, and docks. Most systems utilize
wireless technology and solar power so that intrusion into the surface is not necessary. Most
systems are modular allowing various sizes and arrangements;
o Bicycle: the bicycles are specifically designed for short trips and constructed of customized
components to limit their appeal to theft and vandalism; and
• RFID Card: Radio Frequency Identification technology, usually in the form of a card or fob, allows users
to check out a bicycle directly from the dock and speeds up transactions. This also provides an added
layer of security and accountability to each transaction.
A bike share member swipes either their membership key or credit card to release a bicycle from the station and
returns it to any station within the system service area. The check-in and check-out transactions take a few
seconds each. Therefore, bike share is ideal for short distance, point-to-point trips. Most systems allow
subscribers to make as many trips as they like without additional charge, provided they return the bicycles to a
station within 30 to 60 minutes. Operators generally begin to charge gradually increasing fees after this free
period to discourage users from holding onto the bicycles when they are not being used, encouraging turnover
and ensuring that bicycles are readily available for other subscribers. In cities across the U.S. bike share systems
have proven very popular and successful by giving residents and visitors alike a fast, affordable, easy-to-use
transportation option.
Figure 2.2: Components of a Station-Based Bike Share System.
14. June 16, 2014
Eugene Bike Share Feasibility Study │7
An emerging technology in bike share is the use of
“smart bikes” rather than “smart stations”. This
technology takes the features of the station-based
systems and moves them onto the bicycles. For
example, the bicycle shown on Figure 2.3 includes
a transaction terminal, a locking mechanism, and a
GPS unit on the bicycle itself. This allows more
flexibility as to where bicycles can be locked but
doesn’t necessarily provide the reliability of
knowing where bicycles are compared to the
station-based systems. Although, smart-bike
vendors are setting up de facto stations using
regular bicycle racks to replicate the visibility of
bike share stations in the community. In general,
smart bike systems are cheaper per bicycle than
station-based systems but are largely untested to date in large-scale municipal bike share systems.
For the most part, operators in the United States limit users to those who are over 16 to 18 years old (depending
on the city). This is primarily a result of the size of the bicycles being suited to adults and in some areas the
requirement for persons under this age to wear a helmet.
Although helmets are not required for
adults in any of the currently operating
bike share systems, operators do
encourage the use of helmets through
discount programs, helmet giveaways
(often funded by public health and medical
partners), locating nearby helmet retailers
on the system maps, and through safety
messaging. Some cities with helmet laws,
and some without, are considering or
testing prototypes for helmet vending
machines (see Figure 2.4).
Some systems offer independent locks so
that users can lock the bicycle while it is
still in their possession (e.g. to run an
errand at a location without a station).
However, the time the bicycle is locked is
counted to the user and could impose usage fees.
Figure 2.4: Prototype Helmet Vending Machine in Boston.
Figure 2.3: Example of Technology Integrated into a “Smart Bike”.
15. June 16, 2014
Eugene Bike Share Feasibility Study │8
Some of the characteristics of bike share are:
• It is oriented to short-term, point-to-point use: most U.S. operators record the average ride at 15 to 20
minutes and between one-to-three miles long;3
• The bicycle can be returned to any number of self-serve bike share stations, including the original check
out location;
• Generally, the bicycles are one style and easy to operate with simple components and adjustable seats;
and
• The rental transaction is fully automated and there is no need for on-site staff.
As a transportation investment, bike share is relatively inexpensive. A 30 station / 300 bike share system such as
those in Chattanooga, Tennessee or Columbus, Ohio, costs in the order of $1.5 million to implement. This is less
than one quarter of the cost of
constructing a mile of new four lane
urban highway.4
They are also relatively quick to
implement. Systems typically launch
within two years of concept, although
some cities have experienced delays from
grant funding disbursement, equipment
production, force majeure, and other
factors. The stations themselves make
use of wireless and solar technologies and
take less than two hours to install
(see Figure 2.5).
3
Bike Sharing in the United States: State of the Practice and Guide to Implementation. Federal Highway Administration.
United States Department of Transportation. September 2012.
4
One mile of new four lane urban highway costs$8 - $10 million based on information from the American Road &
Transportation Builders Association, accessed online at http://www.artba.org/faqs/#20 on December 12, 2013.
Figure 2.5: Bike Share Station Lifted into Place in Chicago.
16. June 16, 2014
Eugene Bike Share Feasibility Study │9
3 Benefits of Bike Share
Bike share is a relatively inexpensive and quick-to-implement transportation option that can deliver a variety of
mobility, economic, health, safety, and quality of life benefits. When combined with other modes of
transportation, bike share can provide a fundamental shift in the way people move about and make decisions
about transportation.
The benefits of bike share to a community include mobility, economic, health, environmental and safety. For
Eugene, bike share could be a means to:
• Expand and enhance existing transit services;
• Reduce dependence on automobile transportation;
• Introduce new riders to the benefits of bicycling;
• Promote the city to potential employers, residents, and visitors;
• Provide an economic uplift to local businesses;
• Reduce household transportation expenditure;
• Improve physical and mental health, and reduce health care costs; and
• Reduce greenhouse gas emissions.
These benefits are described in more detail in the sections below.
3.1 Mobility, Transportation, and Community Building Benefits
Bike share creates additional mobility in a community by adding transportation options. Bike share trips tend to
be short – between one to two miles in length and about 20 minutes in duration. As a result, they provide an
option for trips too far to walk and trips too short to wait for transit; a perfect first-mile / last-mile solution to
access public transit. Many bike share users combine membership in a bike share system with transit, car-share,
walking, and other transportation options to reduce their dependency on automobile travel. In some places, this
has resulted in a fundamental shift in trip-making and household vehicle ownership. As well, cities have found
that bike share contributes positively to increasing people’s perception and enjoyment of the city and increased
social interaction through the physical presence on the stations and through social networking.
Following is a summary of the mobility, transportation, and community building benefits:
• Augments a community’s existing transit system;
• Relieves already over-capacity transit services;
• Encourages active transportation by lowering barriers to entry;
• Provides the impetus for further investment in bicycling facilities;
• Contributes positively to people’s attitude towards the City; and
• Acts as a conversation starter and increased social interaction.
17. June 16, 2014
Eugene Bike Share Feasibility Study │10
Transit Benefits
A bike share system complements existing transit services by offering a first- and last-mile option that extends
the reach of existing fixed-route services, connects transit lines that do not cross, and adds capacity to already
congested transit routes. Following are some examples of how bike share has augmented transit in other cities:
• In New York City, two-thirds of Citi Bike users link their bike share trips with transit and the busiest
stations are clustered near transit hubs5
. An example of bike share’s role in extending transit can be
seen on the Lower East Side. These stations provide a first- and last-mile connection for an area
currently under-served by mass transit. Daily usage patterns at these stations follow an outward flow of
bicycles from the neighborhood in the morning and a reverse of this pattern in the afternoon;6
• Several cities including New York City and Vancouver, Canada have identified bike share as a means to
alleviate over-capacity transit routes by providing an option for bicycling to less crowded stops or to
replace certain transit trips altogether;7,8
and
• In Washington D.C. over half (54%) of respondents to Capital Bikeshare’s member survey stated that at
least one of their bike share trips in the previous month had started or ended at a Metrorail station and
about a quarter (23%) of respondents used bike share to access the bus in the previous month.9
Recognizing that transit agencies are important partners in bike share systems, the Federal Transit
Administration (FTA) has funded several different systems including Boston and Chattanooga. To be eligible for
FTA funding stations must be within a 3 mile radius of transit and funds can be used towards bike share docks,
equipment and other capital costs (the cost of the bicycles and operating costs are not eligible).10
Active Transportation Benefits
Cities across the United States are looking for effective ways to encourage active transportation and promote
the benefits of walking and biking. Bike share has proven one of the most effective ways to quickly and
affordably introduce new riders to bicycling. In using the momentum around bike share, cities can drive further
investment in active transportation.
5
New York City Department of Transportation Press Release (December 12, 2013). After First 200 Days of Citi Bike, NYC DOT
Releases New Data Showing that Significant Number of New Yorkers are Biking, Complementing Transit System.
6
For example, view the E 10
th
Street & Avenue A bike share station in New York: http://bikes.oobrien.com/newyork/.
7
New York City (2009). Bike Share Opportunities in New York City. Accessed online at:
http://www.nyc.gov/html/dcp/pdf/transportation/bike_share_complete.pdf on January 2, 2014.
8
Johnston, S. (July 2013). Presentation to Vancouver City Council: City of Vancouver Public Bike Share System. Accessed
online at: http://vancouver.ca/files/cov/public-bike-share-staff-presentation-to-council-07232013.pdf on January 2, 2014.
9
LDA Consulting (2013). 2013 Capital Bikeshare Member Survey Report. Accessed online at
http://capitalbikeshare.com/assets/pdf/CABI-2013SurveyReport.pdf on December 13, 2013.
10
Federal Transit Administration’s Frequently Asked Questions and Answers Concerning Bike Sharing Relative to the United
States Department of Transportation. Accessed online at http://www.fta.dot.gov/documents/Informal_Q_and_As_Final_6-
14-12.pdf on December 26, 2013.
18. June 16, 2014
Eugene Bike Share Feasibility Study │11
Bike share’s ability to reduce some of the common barriers to entry,
(i.e., allowing new users to try bicycling without needing to own or
store a bicycle) as well as the design of the bicycles and the visibility of
the stations has a significant impact in attracting new riders. In
Minneapolis for example, 33% of new members surveyed in 2010 by
Nice Ride Minnesota had ridden less than once per month before
joining.11
In addition, bike share is often coupled with an increase in bicycle infrastructure. Figure 3.1 shows an example of
how the City of Boston increased the amount of on-street bikeways in conjunction with the implementation and
launch of bike share. While the exact correlation between bike share and investment in bikeways has not been
studied, it is clear that utilization of bike share increases the desire for a more comfortable riding environment
and may prompt increased investment in the bicycling network as a result of public demand.
Figure 3.1: Increase in On-Street Bikeways in Boston with the Launch of Bike Share.
11
Two-thirds of members also said they had increased their amount of bicycling since joining Nice Ride. Figures taken from
Nice Ride 2010 Annual Report.
“Life will never be the same. I’ve always
loved getting around by bike, but since I
know so little about bike repair, it only took
a flat tire to keep me off bikes for months.
Capital Bikeshare got me riding again, so I
use my own bike more and it’s caused me to
get my son interested in bicycling as well.”
-Capital Bikeshare annual member.
19. June 16, 2014
Eugene Bike Share Feasibility Study │12
Community Building Benefits
As well as providing an additional transportation and mobility option for residents and visitors, cities
implementing bike share systems have found that there are also a number of positive community-building
benefits including:
• People’s perception of the city can be shifted by the presence of bike share. Of Nice Ride Minnesota
users surveyed in 2011, 95% agreed or strongly agreed that bike share had made the Twin Cities a more
enjoyable place to live;12
• Two-thirds of Capital Bikeshare survey participants reported that they like bicycling because it is “fun”;
Eighty-five percent reported that biking is an easier and faster way to get around;13
• After the installation of bike share kiosks in New York City, it was observed that the kiosks created a
social space where people meet and gather as well as acting as a conversation starter;14
and
• Social networking is a large part of how bike share systems communicate to users and how users
interact with each other. For example, Boston’s Hubway has 6,000 followers and very active interaction
among users.
Mobility Risks
Although 20-40% of bike share trips replace single occupancy vehicle trips,5,15,16
the remainder of trips are
entirely new trips, augment public transit trips, or may actually replace public transit or walking trips. A full,
holistic analysis of the impact of bike share on public transit and active transportation has not been undertaken.
However, some bike share trips may replace other public transit or active transportation trips.
Overall Mobility Impacts for Eugene
Overall, in Eugene, bike share could be a positive addition to the existing transportation options. Bike share can
not only augment the existing transit network, but can relieve already over-capacity transit services such as the
EmX service between Downtown Eugene and the University of Oregon campus. Bike share could be a tool in
delaying the need for costly increases in bus service frequency or additional fleet capacity.
Eugene is already recognized as a Gold Bicycle Friendly Community by the League of American Bicyclists. The
addition of more bicyclists could provide the impetus for further investment in bicycling facilities.
12
Nice Ride Minnesota Annual Report 2011. Accessed online at: https://www.niceridemn.org/_asset/9n2z8n/
13
LDA Consulting (2012). Capital Bikeshare 2011 Member Survey Report. Accessed online at
http://capitalbikeshare.com/assets/pdf/Capital%20Bikeshare-SurveyReport-Final.pdf on December 3, 2013.
14
Nelson, David M. and David Leyzerovsky. The Social Life of CitiBike Stations. Project for Public Spaces.
http://www.pps.org/blog/the-social-life-of-citibike/. December 3, 2013.
15
National League of Cities (2011) Integrating Bike Share Programs into a Sustainable Transportation System.
16
Nice Ride Minnesota (October 2011) Presentation about Nice Ride Minnesota.
20. June 16, 2014
Eugene Bike Share Feasibility Study │13
3.2 Economic Benefits
There are a number of economic benefits that bike share offers at a community, business, and individual level.
These include making the community attractive for employers, individual transportation savings, dollars spent
by bike share users at local businesses, and bike share memberships as part of employee benefits packages.
Following is a summary of the economic benefits of bike share:
• At a community level, bike share is recognized as a means for attracting or retaining workforce talent
and in providing visitors with a unique way to experience the city;
• For businesses, bike share riders spend more money at local businesses, and offer potential employee
benefits for employees; and
• For individuals, bike share reduces the costs of transportation and health care.
Community Benefits
A bike share system can help a community attract and retain residents. Many communities see bike share as
part of a (re)vitalization effort for their downtown area. In addition, it provides a new and different way for
tourists to see a city, helping attract more tourists and their spending power to communities.
The amount of national and international press coverage
generated by a bike share system would serve to emphasize the
city to visitors, businesses, and employers. For example, the
launch of Charlotte B-Cycle in North Carolina received exposure
in 18 newspapers including the New York Times.17
A bike share system also creates a small number of local jobs
operating and maintaining the system.
Business Benefits
There are many ways that local businesses and employers benefit from bike share. Some of the business
benefits of bike share are described below:
• Increased sales: in other cities, businesses located near bike share stations have seen an economic
uplift. A recent study of the Nice Ride Minnesota bike share system in Minneapolis / St. Paul found that
bike share users spent an additional $150,000 at local businesses over the course of one bike share
season compared to the prior year before bike share was implemented18
. Increased sales in the bicycle
retail sector can also be expected. Although there is limited data available in the United States, in Paris,
city-wide bicycle sales increased 39% following the launch of Velib19
. The sale of bicycle-related products
and accessories could also increase as a result of bike share.
17
From the Sponsor’s Perspective (2013). Accessed online at www.bikeshare.com on December 12, 2013.
18
Schoner, J.E., Harrison, A. and Wang, X. (2012). Sharing to Grow: Economic Activity Associated with Nice Ride Bike Share
Stations. Humphrey School of Public Affairs, University of Minnesota.
19
Bike Europe (2007). Strong Shifts in 2007 French Market. Accessed online at http://www.bike-
eu.com/Home/General/2008/4/Strong-Shifts-in-2007-French-Market-BIK002778W/ on December 3, 2013.
“Although I am a native to the area, seeing
Chattanooga by bicycle adds an entirely new
perspective. It is so nice to slow down, not worry
about parking and get to explore and check out
bars, restaurants, and shops you might not
regularly. We go downtown and do so much more
now with the bike share than we ever did before.”
-Recommendation of Chattanooga Bicycle Transit
System on TripAdvisor
21. June 16, 2014
Eugene Bike Share Feasibility Study │14
• Corporate membership: most bike share systems offer corporate membership packages where annual
memberships are purchased in bulk by the organization at a discounted rate. Some systems, such as
Hubway in the Boston area, offer packages where employers choose how much of the membership cost
they contribute and whether they cover usage fees or not.20
Corporate membership could be offered as
part of a company’s travel demand management program, as a way to decrease the inventory of fleet
vehicles or vehicle maintenance costs, or as an employee benefit.
• Sponsorship and promotions: most bike share systems offer sponsorship or advertising opportunities on
the stations and bicycles. This can range from one large system sponsor to many smaller station-based
sponsors. In some communities, sponsors become involved in bike share promotions, such as
discounted goods or services for bike share members.
Individual Benefits
The economic benefits to individuals and households come in the form of reduced household expenditure on
transportation and health care, which combined make up over 22% of annual average household expenditure in
the United States.21
Compared to the cost of operating an automobile, bike share membership is relatively
inexpensive with most systems costing between $50 and $100 per year. In comparison, the median cost of
annual car ownership is approximately $9,100.22
Eighty-seven percent of annual members in Washington D.C.
said they saved money on weekly travel costs by using Capital Bikeshare.9
On average, this resulted in an $800
per year saving on personal transportation costs for these users.
Economic Risks
There are some economic risks related to a bike share system:
• Most bike share systems are not economically self-sustaining, i.e. operating costs are greater than
membership and usage fees. Therefore, the responsible organization (public agency, non-profit, or
private company) must ensure that the requisite funding is available to support capital purchases,
expansion, and ongoing operations. If membership and ridership are not significant, then the cost of
operations needs to be recouped through a higher burden on other funding sources;
• Although there have been few examples in the United States of failed systems, should a system not
garner membership and ridership, it could act negatively on the city’s image; and
• There has been a fear in many communities that bike share will threaten the local bicycle rental and
bicycle retail businesses. Some actions can be taken to reduce this risk, including developing a price
structure to deter long term rental of the bike share bicycles and identifying bicycle rental and retail
locations on the station maps.
20
Hubway Corporate / University Accounts, accessed online at http://www.thehubway.com/corporate on December 27,
2013.
21
U.S. Department of Labor, Bureau of Labor Statistics, Consumer Expenditure Survey, 2010.
22
For comparison, the median annual cost of car ownership is approximately $9,100 based on information from
www.consumerreports.org accessed on December 12, 2013.
22. June 16, 2014
Eugene Bike Share Feasibility Study │15
Overall Economic Impact on Eugene
Overall, communities that have implemented a bike share system have faced the economic risks, and have
overcome them (i.e., no system has shut down due to financial non-compliance). The most impactful potential
net benefits to Eugene are:
• Augmenting the image of Eugene as a forward-thinking, bicycle-friendly city to attract and retain
students, residents, and visitors;
• Increased likelihood that bike share users will patronize businesses located near a bike share station;
• Opportunity for employers and businesses to sponsor, advertise, and provide bike share as an employee
benefit; and
• Individual savings on transportation.
3.3 Health Benefits
The health benefits of bicycling are well known in helping to address preventable diseases such as obesity, heart
disease, and diabetes. As such, bike share can have a positive impact on both physical and mental health.
Physical Health Benefits
Bike share is a means for people to incorporate active transportation into their daily lives and lower medical and
health care costs. Bicycling for 30 minutes a day, e.g., using bike share to go to and from work each day, can
reduce the risk of heart disease by 82%23
and reduce the risk of diabetes by up to 58%.24
A study of the Bicing bike share system in Barcelona, Spain published in the British Medical Journal in 2011
compared the benefits of increased physical activity to the additional risks introduced from increased inhalation
of air pollutants and increased exposure to traffic crashes. The study found that over 10 deaths were avoided
each year due to increased physical activity, offsetting any smaller increases in expected deaths from air
pollutant inhalation and traffic crash exposure.25
The health benefits of bike share are recognized by the health care industry. The federal government, through
the Centers for Disease Control (CDC), has funded several systems including Boston and Nashville. The private
sector is also represented with many bike share systems in the United States supported by health care providers
such as Blue Cross Blue Shield (Nice Ride Minnesota) and Kaiser Permanente (Denver B-Cycle) through
partnerships and sponsorships.17
23
British Medical Association (1992). Cycling Towards Health and Safety. Oxford University Press.
24
Lindström, J. et al. The Finnish Diabetes Prevention Study: Lifestyle intervention and 3-year results on diet and physical
activity. Diabetes Care, December 2002, vol. 26 no. 12 3230-3236. Accessed online at
http://care.diabetesjournals.org/content/26/12/3230.full on December 13, 2013.
25
Rojas-Rueda, D. et. al. (2011). The Health Risks and Benefits of Cycling in Urban Environments Compared with Car Use:
Health Impact Assessment Study. British Medical Journal 2011; 343:d4521. Accessed online at:
http://www.bmj.com/content/343/bmj.d4521 on January 2, 2014. Statistics reported are based on the sensitivity analysis
that assumes 10% of Bicing trips replace car trips.
23. June 16, 2014
Eugene Bike Share Feasibility Study │16
Mental Health Benefits
Bike share can also have a positive impact on mental health. Users in other cities have expressed that bike share
has positively contributed to an improved outlook, increased recreation, and improved sociability.
Health Risks
Safety is a large concern for bike share users. This risk is described more in the Safety Benefits section below.
Health Impact for Eugene
Overall, bike share can have a positive health impact on Lane County and Eugene. Considering that in Lane
County over half of the adult population is obese or overweight,26
bike share can be a useful tool in addressing
obesity. Additionally, businesses in the health care industry may be interested in sponsoring part of a bike share
system as a prevention strategy.
3.4 Environmental Benefits
Bike share can have an impact on reducing greenhouse gas emissions by replacing trips taken previously by
automobile. These impacts can be multiplied when bike share is used in combination with transit and other
modes to reduce dependence on automobile use, change travel patterns, and increase environmental
consciousness.
Reduction in Greenhouse Gas Emissions
In communities where bike share is an active transportation option, surveys have shown that approximately 20
– 40 percent of annual member bike share trips replace what would have been an automobile trip.5,15,16
A survey
of Capital Bikeshare members in Washington D.C. in 2011 showed that bike share trips had replaced
approximately 4.4 million vehicle miles, representing a 4 percent decrease in the city’s annual driving mileage.27
In its first season of operation, Denver B-Cycle users took over 100,000 trips and rode more than 200,000 miles.
A survey of members showed that over 40% of trips replaced a motor vehicle trip, resulting in savings of almost
16,000 gallons of gasoline consumption and avoiding over 300,000 pounds of greenhouse gas emissions.
Increase Environmental Consciousness
Bike share helps to increase environmental consciousness for both individuals and communities as a whole. For
individuals, most bike share systems offer member logins where people can track the amount of greenhouse gas
emissions avoided through their bike share trips. Employers can use these statistics to help track the
organization’s greenhouse gas emission reductions. The data tracked through a bike share system can also be
26
Lane County Health Department (2013). Lane County Community Health Assessment. Accessed online at
http://www.scribd.com/fullscreen/185874216?access_key=key-
2m3hzkve1a466udwfhsq&allow_share=true&view_mode=scroll on December 10, 2013.
27
Federal Highway Administration, Highway Statistics 2011: Urbanized Areas – 2010 Miles and Daily Vehicle – Miles
Traveled. Accessed online at http://www.fhwa.dot.gov/policyinformation/statistics/2011/hm71.cfm on December 27, 2013.
24. June 16, 2014
Eugene Bike Share Feasibility Study │17
used to foster contests among employees for distance ridden. Such contests are already frequently used with
pedometers at workplaces.
Bike share is also a high-profile endeavor for a community which garners significant press attention. In 2011 at
the launch of Hubway, Boston Mayor Thomas Menino famously commented, “The car is no longer king”. This
quote was memorialized on a Hubway bicycle. The press attention allows politicians to publicly support a
popular and convenient transportation system that has a positive environmental benefit. There have been many
images of celebrities on bike share bicycles, including Raphael Nadal on Toronto Bixi, Leonardo DeCaprio on Citi
Bike, and many images and mentions of Citi Bike on late-night television, including Bruce Willis on David
Letterman and Paul McCartney on Saturday Night Live. Such high-profile attention brings attention to the bike
share system as well as increases overall environmental awareness.
Environmental Risks
A major part of bike share operations is balancing the system – that is, moving bicycles around from full stations
to empty stations to ensure the availability of bicycles and empty docking points. Typically, this operation is
undertaken by vans. Because of the relatively high cost and low availability of non-fossil fuel burning options,
there are few operations that utilize electric or other environmentally friendly vehicles. There have been no
studies on the emissions of such vehicles, or other aspects of operations on the overall environmental impact of
a bike share system. However, this negative impact should be noted.
Overall Environmental Impact for Eugene
Overall, a bike share system could provide a positive environmental impact for Eugene, increasing public transit
accessibility and usage, lowering single occupancy vehicle trips, and increasing environmental awareness.
3.5 Safety Benefits
The safety of bicycling in a community is a significant concern to bike share users. Although still relatively new,
bike share has an extremely impressive safety record. To date, no system in the United States has recorded a
fatality and the rates of injury crashes are typically lower than private bicycling, as shown on Figure 3.2.28
The safety benefits of bike share include:
• Introducing more riders to a community for a “safety in numbers” effect;
• Exposure of riders to road rules and safety hints through safety messaging at bike share stations and
websites; and
• Introducing safer bicycles in good repair that feature permanent lighting systems to the community.
28
Only Capital Bikeshare has a higher injury crash rate than private bicycling. It is uncertain why the injury crash
rate is higher in Capital Bikeshare than in other systems and higher than the private bicycling rate.
25. June 16, 2014
Eugene Bike Share Feasibility Study │18
Figure 3.2: Comparison of Injury Rates for Bike Share and Private Bicycling.
29
Safety in Numbers
Millions of bike share trips were taken in almost 30 U.S. cities in 2013 significantly increasing the number of
bicycling trips in these cities. For example, in New York, there were an additional 40,000 bicycle trips per day
due to Citi Bike and bike share trips made up approximately 29% of the 113,000 daily bicycle trips made within
the bike share service area. Bike share has been effective in attracting new and previously infrequent bicyclists.
A survey of Hubway members in Boston found that 12% bicycled less than once per year prior to joining Hubway
and a further 16% bicycled less than once per month prior to joining.30
Along with the high visibility of stations, the high volume of riders result in greater awareness of bicyclists by
drivers. In fact, the “safety in numbers effect” is well established. A study published in Injury Prevention in 2003
showed that the “likelihood of a person walking or bicycling being struck by a motorist varies inversely with the
amount of walking and bicycling”.31
Figure 3.3 shows how the injury rate (referred to as “relative risk index”
in Figure 3.3) reduces exponentially with the number of cyclists using the road system (in this case using journey
to work mode share as a proxy for the overall amount of bicycling).
29
Injury rates for private bicycling obtained from: Beck, L. et al. (2007). Motor Vehicle Crash Injury Rates by Mode of Travel,
United States. Published in the American Journal of Epidemiology.
30
Presentation titled The Hubway Influence on New Riders given by Nicole Freedman, 2013. Accessed online at:
http://baystateroads.eot.state.ma.us/movingtogether/docs/Freedman-Moving%20Together%202013.ppt.pdf.
31
Jacobsen, P.L. (2003). Safety in Numbers: More Walkers and Bicyclists, Safer Walking and Bicycling. Injury Prevention
2003;9:205-209.
26. June 16, 2014
Eugene Bike Share Feasibility Study │19
Figure 3.3: Walking and Bicycling Risk in 68 California Cities in 2000.
Road Rules and Safety Hints
Bike share provides a unique opportunity to communicate with bicyclists about road rules and regulations and
safety hints. Some examples include:
• Don’t ride on sidewalks;
• Ride with the flow of traffic;
• Watch out for car doors;
• Encouragement of helmets and communication about where to purchase a helmet;
• Watch out for right-turning vehicles; and
• Ride predictably and in control.
Means of communicating safety messages are numerous, including:
• Website;
• Social media;
• At kiosk during registration;
• On the bicycle handlebars and stem;
• On the map panels; and
• High-profile events or press articles.
Such communication leads to more educated and safer riders who typically take fewer risks than the traditional,
private bicyclist.
27. June 16, 2014
Eugene Bike Share Feasibility Study │20
Safe Bicycles
The strong safety record of bike share is also impacted by the introduction of bicycles with many safety features.
These are shown on Figure 3.4 and include:
• Built-in safety features such as front and rear lights, brakes, and reflectors;
• An upright position of the rider; and
• A heavy bicycle (typically 40-45 lbs.) with wide handlebars where riders generally keep slow speeds and
do not weave in traffic.
In addition, the operator undertakes regular maintenance of the bicycle fleet to ensure safety.
Figure 3.4: Safety Features of Bike Share Bicycle.
32
32
Atlanta Bicycle Coalition (2013). Atlanta – Decatur Bike Share Feasibility Study. Accessed online at:
http://issuu.com/atlantabike/docs/atl-dec_bikeshare_book_lowres# on January 2, 2014.
Sturdy tires and wheels for urban riding
Step-through frame provides
durability and a universal fit
Multiple gears allow users to
adjust effort for a variety of
terrain and traffic conditions
Adjustable seats allow quick sizing
Basket for purse or bags
Front and rear lights improve
visibility during day and night
28. June 16, 2014
Eugene Bike Share Feasibility Study │21
Safety Risks
Many communities have had strong concerns about safety prior to implementation, including:
• Lack of bicycle infrastructure for safe bicycling;
• Introducing inexperienced riders to the streets;
• Low helmet usage rate among bike share users (a study of bike share trips in Boston and Washington
D.C. showed that less than 20% of bike share riders wore a helmet)33
; and
• Pedestrian concerns of riders breaking rules such as riding on the sidewalk or against traffic (particularly
for the elderly pedestrian population).
Overall Safety Impact on Eugene
Although the safety risks are real and should be considered and mitigated for a system in Eugene, none of these
fears have proven to be a large factor once a system is up and running in a city. This is evidenced by the
aforementioned strong safety record of bike share in almost all communities that it has been introduced.
3.6 Summary of Benefits and Risks
Bike share provides a multitude of mobility, transportation, community-building, economic, health,
environmental and safety benefits. However, there are also risks associated with launching a bike share system.
Some of the major benefits that bike share could bring to Eugene include:
• Providing an additional transportation option that by itself or combined with other options presents an
opportunity to reduce dependence on automobile transportation;
• Expand and enhance existing transit services providing a first- and last-mile option and an opportunity to
relieve already over-capacity transit services;
• Introducing new riders to the benefits of bicycling and spurring new impetus for further investment in
bicycling facilities;
• Building on the City’s reputation as a forward-thinking, bicycle-friendly community and using bike share
to promote the city to potential employers, residents, and visitors;
• Providing an economic uplift to local businesses;
• Reducing household transportation expenditure;
• Improve physical and mental health and reduce health care costs;
• Reduce greenhouse gas emissions and increase environmental consciousness;
• Introducing more riders on safely designed and well maintained bicycles to positively contribute to the
safety in numbers effect; and
• Introducing new opportunities to promote safety messaging to all road users.
The major risks include:
33
Fischer, C.M. et al. (2012). Prevalence of Bicycle Helmet Use by Users of Public Bikeshare Programs. Published in the
Annals of Emergency Medicine, Vol. 60, Issue 2, pp. 228-231.
29. June 16, 2014
Eugene Bike Share Feasibility Study │22
• The possibility that some bike share trips may replace other public transit or active transportation trips;
• The need to ensure that sufficient funding is available to support capital, expansion, and ongoing
operations. Most bike share systems are not economically self-sustaining from membership and usage
fees alone;
• Concerns that bike share may threaten the local bicycle rental and retail markets; and
• Ensuring that rebalancing efforts do not offset the greenhouse gas emission benefits of the system.
30. June 16, 2014
Eugene Bike Share Feasibility Study │23
4 Comparable Cities
Most of the major North American bike share systems launched after 2010. Several systems, in cities of
comparable size to Eugene, have come on line recently and provide a unique opportunity to deliver data for this
feasibility study. Four peer cities were selected from among active systems based on their similarities in
population size, system scale, integration with transit, and proximity to a major university campus. The selected
systems also highlight several different ownership and operational models. Characteristics of the following peer
cities are summarized in Table 4.1 and discussed in more detail below:
• Boulder B-Cycle: Boulder, CO (120 bikes / 23 stations);
• Chattanooga Bike Transit System: Chattanooga, TN (300 bikes / 30 stations);
• Fort Worth Bike Sharing: Fort Worth, TX (300 bikes / 27 stations); and
• GREENbike: Salt Lake City, UT (85 bikes / 12 stations).
From Table 4.1 the following comparisons can be drawn:
• Station densities vary significantly ranging from 2.1 stations / sq. mi. in Boulder to 15.5 stations / sq. mi.
in Chattanooga. Higher densities are generally seen as more conducive to a successful bike share system
allowing stations to be close by no matter where a user is in the system. However, in the case of
Chattanooga, the system is only 2 square miles in area making many point-to-point trips a short walk;
• The number of bicycles provided per station also ranges from just over 5 bikes per station in Salt Lake
City (although this system is still growing and will likely increase this ratio in the future) to 10 bikes per
station in Fort Worth. In all systems a significant portion of open docks are provided with the minimum
ratio being 1.5 docks per bike. This is typically considered by operators as the lowest acceptable ratio in
terms of how often the bicycles need to be redistributed. Higher dock ratios such as the 1.8 to 1.9 docks
per bike in Boulder and Chattanooga are more typical and allow less frequent rebalancing;
• The fee structures for the case study cities are very similar with all offering annual membership for
between $65 and $80 per year, and 24-hour membership for between $5 and $8. Some systems offer 3-
day, weekly, or monthly membership options. Three of the systems offer the user the first 60 minutes
for free before charging additional fees. These fees vary from $3 per half hour to $5 per half hour; and
• All systems operate year-round and (except for Boulder) for 24-hours a day.
Performance data for the four peer city bike share systems are shown on Table 4.2. For two of these cities,
Boulder and Chattanooga, full year data from the second year of operations is presented. For Fort Worth and
Salt Lake City, partial year data from the first year of operations is included because these systems started more
recently.
31. June 16, 2014
Eugene Bike Share Feasibility Study │24
Table 4.1: Bike Share Case Study System Characteristics
34
Boulder B-Cycle
(started: May 20, 2011)
Chattanooga Bike Transit System
(started: July 23, 2012)
Fort Worth Bike Sharing
(started: April 22, 2013)
Salt Lake City GREENbike
(started: April, 2013)
Population 102,000 171,000 778,000 189,000
System
Characteristics
22 stations
150 bikes
279 docks
31 stations
300 bikes
547 docks
30 stations
300 bikes
450 docks
12 stations
65 bikes
182 docks
Service Area 10.6 sq.mi. 2.0 sq.mi. - -
System Ratios
2.1 stations / sq.mi.
6.8 bikes / station
1.86 docks / bike
15.5 stations / sq.mi.
9.7 bikes / station
1.82 docks / bike
10 bikes / station
1.5 docks / bike
5.4 bikes / station
2.8 docks / bike
Membership Cost
$65 annual
$20 weekly
$7 24-hour
$75 annual
$6 24-hour
$80 annual
$30 monthly
$20 weekly
$15 3-day
$8 24-hour
$75 annual
$15 weekly
$5 24-hour
Trip Fees
First 60 minutes free
$4.50 / additional half hour
First 60 minutes free
$5.00 / additional half hour
First 60 minutes free
$3.00 / additional half hour
First 30 minutes free
$2.00 / second half hour
$5.00 / additional half hour
Operating
Practices
Year-round, 5am to midnight Year-round, 24-hours a day Year-round, 24-hours a day Year-round, 24-hours a day
Average High
Temperatures
88 F (summer) / 45 F (winter) 90 F (summer) / 50 F (winter) 97 F (summer) / 57 F (winter) 90 F (summer) / 38 F (winter)
Average Monthly
Precipitation
1.8” (summer) / 0.9” (winter) 4.9” (summer) / 4.9” (winter) 1.9” (summer) / 1.9” (winter) 0.6” (summer) / 1.5” (winter)
34
Maps taken from screenshots of http://bikes.oobrien.com/global.php.
32. June 16, 2014
Eugene Bike Share Feasibility Study │25
Table 4.2: Performance Metrics for Case Study Bike Share Systems
Boulder B-Cycle
(started: May 20, 2011)
Chattanooga Bike
Transit System
(started: July 23, 2012)
Fort Worth Bike
Sharing
(started: April 22, 2013)
Salt Lake City
GREENbike
(started: April, 2013)
System Characteristics
22 stations
150 bikes
279 docks
31 stations
300 bikes
547 docks
30 stations
300 bikes
450 docks
12 stations
65 bikes
182 docks
DATA CHARACTERISTICS
Data for the Period 2012 Aug 2012 – Jul 2013 2013 (partial) 2013 (partial)
Days in Operation 250 365 183 248
MEMBERSHIP CHARACTERISTICS
Casual Members 9,059 8,578 7,000 -
Annual Members 869 696 383 -
RIDERSHIP CHARACTERISTICS
Casual Trips 11,786 - 9,783 -
Annual Member Trips 13,568 - 5,637 -
Total Trips 25,354 32,000 15,420 26,000
PERFORMANCE METRICS
Annual Members /
Population
0.85% 0.41% 0.05% -
Casual Members / Station 410 275 235 -
Trips per Casual Member 1.3 1.8 1.4 -
Trips per Annual Member 15.6 23.3 14.7 (6 months) -
Trips per Bike per Day 0.81 0.29 0.28 1.61
Farebox Recovery
35
36% 26% - 30%
In terms of membership draw, Boulder has been very successful in attracting high volumes of annual and casual
members relative to the population of the city. Annual membership success in Boulder is likely a result of the
community-based business model used to start the system and follow-on from early membership drives to
support the system. The high number of visitors and tourists to Boulder drives the high casual membership.
Eugene could expect to see relatively high rates of annual membership uptake (the average of the peer cities
represents an uptake rate of approximately 0.4% of the population purchasing annual membership). Casual
membership could be expected to draw up to 250 casual members per station per year.
The number of trips made per bike per day varies amongst the peer cities. Salt Lake City has a high ridership rate
with each bicycle being ridden an average of 1.6 times per day. This is comparable with larger, more established
cities such as Denver and Minneapolis that record approximately 1.0 to 1.5 trips per bike per day. However,
smaller markets typically observe lower ridership rates. Boulder sees an average of 0.8 trips per bike per day, a
lot coming from its high number of casual users. Chattanooga and Fort Worth are lower still with approximately
0.3 trips per bike per day. The system in Fort Worth is still establishing and results in Chattanooga could be
35
Farebox recovery is the amount of operating cost recouped by membership and usage charges.
33. June 16, 2014
Eugene Bike Share Feasibility Study │26
influenced by some early technical difficulties as well as delays in opening the system (i.e. losing the momentum
of early excitement around the system) as well as the small area covered by the system.
Financial information is not available for all of the case study cities, however, information from the Boulder B-
Cycle system shows that operating revenues come from a combination of sponsorships (38%), contributions
(26%), memberships (25%), usage fees (10%), and other sources (1%).36
Farebox recovery, which represents the amount of operating cost recouped by membership and user fees, is
presented for Boulder and Chattanooga. These cities recorded recoveries of 36% and 26% in 2012 respectively.
For comparison, farebox recoveries in larger cities include 54% in Denver and Minneapolis, 60% in Toronto, and
88% in Boston in 2012. Traditional transit services such as those provided by LTD typically recover around 20% of
their operating costs.37
4.1 Boulder B-Cycle
Boulder B-Cycle is a public - private partnership between the City of Boulder and a non-profit group that owns
and operates the system. Boulder B-Cycle was formed by individuals interested in bringing bike share to the
city.38
The system initially launched in May 2011 with 85 bikes at 12 stations and has since expanded to 150
bikes at the 22 stations shown on Figure 4.1. In 2012, Boulder B-Cycle had 869 annual members and over 9,000
casual users and recorded over 25,000 rides.39
Capital funding was obtained through a combination of federal, state, and local government grants and gifts
from individuals and businesses in the community. The City of Boulder is a major partner and has an agreement
with Boulder B-Cycle that it will pursue grant funding for capital expansion with Boulder B-Cycle responsible for
securing any local match. As of June 2013, the City had contributed $330,800 of city funds and $332,733 of state
and federal grants to purchase 18 of the 22 stations. The other four stations were funded through the Boulder
County Capital Improvement Fund (2 stations), a grant from the University of Colorado student group (1
station), and contributions from a private property owner (1 station).40
The system is set to expand to 32 stations and 200 bikes through a Federal Highway Administration (FHWA)
Transportation, Community, and System Preservation (TCSP) grant secured by the City. Grant matches are
fundraised by Boulder B-Cycle through grass-roots campaigns targeted towards individuals and businesses in the
community and businesses and property owners adjacent to the stations.
36
Boulder B-Cycle 2012 Annual Report.
37
Lane Transit District, 2012-2013 Comprehensive Annual Financial Report for fiscal year ended June 30, 2013.
http://www.ltd.org/pdf/boardmeetings/2012-13%20CAFR.pdf
38
Momentum Magazine (September 23, 2013). Bike Share Finds Success in Small Cities. Accessed online on December 5,
2013 at http://momentummag.com/features/bike-share-finds-success-in-small-cities/.
39
Boulder B-Cycle (July 2013). Boulder B-Cycle – 2012 Annual Report. Accessed online on December 5, 2013 at
https://boulder.bcycle.com/About/DataandReports.aspx.
40
Boulder B-Cycle (August 2013). Station Master Plan. Accessed online on December 5, 2013 at
https://boulder.bcycle.com/About/DataandReports.aspx.
34. June 16, 2014
Eugene Bike Share Feasibility Study │27
Figure 4.1: Boulder B-Cycle System Map.
Operating expenses are funded through a combination of membership and usage fees and sponsorships. The
City has also committed to contributing to an operating reserve, although details of the amount and use of these
funds were not available for this study. As is the case in many smaller cities, Boulder B-Cycle has had reasonable
success with sponsorship requests in the $1,000 to $10,000 range where decisions can be made at a local level.
They have also had some success with contributors in the $10,000 to $50,000 range that need regional or
national approval, but to date have not had any success with requests over $50,000.
The University of Colorado (CU), located in Boulder, is under-represented in the current system with just one
station located on CU property. However, Boulder B-Cycle has identified the University as a key partner and
critical to the system’s growth and success. There are plans to find more opportunities for stations on the
campus and Boulder B-Cycle offers discounted student membership to the system. CU is also a sponsor.
The transit provider in Boulder, the Regional Transportation District (RTD), is not a recognized partner, however,
the system integrates with transit by locating stations near RTD stops. In 2012, 80% of annual members
surveyed had an RTD transit pass and 33% use B-Cycle to connect to public transit.
35. June 16, 2014
Eugene Bike Share Feasibility Study │28
4.2 Chattanooga Bike Transit System
The City of Chattanooga started to explore bike share as early as 2007, however system development
commenced with the award of $100,000 in funding from the local Lyndhurst Foundation in 2009. The City,
partnering with the local transit system CARTA, then won a federal CMAQ (air-quality) grant the following year
to start the system.41
The system cost approximately $528,000 to operate for the first 12 months.42
The system currently features 300 bikes at 30 stations as shown on Figure 4.2. The City of Chattanooga owns the
system and it is administered by Outdoor Chattanooga (OC), a division of the City’s Parks and Recreation
Department. OC contracts operations to a private operator with an agreement to share any profits (75% City /
25% private operator).
Figure 4.2: Chattanooga Bike Transit System Map.
41
Streetsblog (February 2013). Chattanooga Bike-Share: Lessons for Smaller Cities. Accessed on December 5, 2013 at
http://dc.streetsblog.org/2013/02/11/chattanooga-bike-share-lessons-for-smaller-cities/.
42
Chattanooga Bicycle Transit System (2013). Bike Chattanooga – First Year of Operations.
36. June 16, 2014
Eugene Bike Share Feasibility Study │29
The system has faced a number of challenges including delays in disbursing federal grant money due to early
understanding of Buy America requirements, technology challenges as the vendor updated its operating system,
difficulty attracting major sponsors, and a generally auto-oriented culture in the city.
The University of Tennessee Chattanooga plays a large role in the system with five stations (and 80 docks) in and
around the campus and a large number of members through subsidized memberships to students. The system
has also partnered with the University to conduct bicycle and pedestrian related research and analysis.
The connection with transit is emphasized through the system’s name as a “bicycle transit system” and stations
located at major transit stations and stops. CARTA was also a major partner in securing federal funding.
4.3 Fort Worth Bike Sharing
The Fort Worth Bike Sharing system is relatively recent opening in April 2013 with 300 bikes at 27 stations in
Downtown, the Cultural District, and on the Texas Christian University (TCU) campus shown on Figure 4.3.
The concept was driven by the Planning Department at the Fort Worth Transportation Authority (the local
transit agency) who obtained a $1 million Federal Transit Administration (FTA) grant to launch the system. The
system is operated by a non-profit, however transit has remained an integral partner with part of the system’s
mission to “complement our existing public transportation system” with bike share stations near transit stations
such as the Fort Worth Intermodal Transportation Center.
4.4 GREENbike – Salt Lake City
GREENbike in Salt Lake City is a relatively new bike share system that opened in April 2013. It is primarily located
downtown with 65 bikes at the 12 stations shown on Figure 4.4.
The operating model is unique in that GREENbike, SLC Bike Share is a 501(c)3 non-profit organization that is a
public / private partnership between Salt Lake City, the Salt Lake Chamber of Commerce and the Salt Lake City
Downtown Alliance. The system is operated by the Downtown Alliance. Local public funding and significant
sponsorship was used to launch and operate the system.
University of Utah is connected to Downtown by light rail but is not part of the bike share system at this stage.
The Utah Transit Authority (UTA) (the local transit operator) is recognized as a “strategic partner”.
37. June 16, 2014
Eugene Bike Share Feasibility Study │30
Figure 4.3: Fort Worth Bike Share System Map.
38. June 16, 2014
Eugene Bike Share Feasibility Study │31
Figure 4.4: GREENbike System Map.
4.5 Summary of Experience in Peer Cities
Table 4.3 summarizes the business models and funding strategies for the peer city bike share systems
showcased above. These case studies show that there is no single “right” way to form, implement, or operate a
bike share system in a small community. In all cases, cities have built on the momentum created by those
championing the idea. In some instances this is a grass-roots community group (such as in Boulder and Aspen)43
,
a business improvement association (such as in Salt Lake City), or through the local transit agency (in the case of
Fort Worth). Most systems however, receive their impetus through the support of city government, and, in
particular, systems have tended to be most successful (especially in obtaining capital and sponsorship dollars)
when there has been early and visible mayoral support.
There is no one business model for these smaller communities. However, the involvement of a non-profit is the
most common model, in part due to the community-minded mission of these organizations and the fact that
large, sophisticated (and potentially expensive) operations are not necessary for a smaller system. Non-profits
are also well placed to receive funding from a variety of sources, but in most cases rely on the city or transit
agency to identify, seek, and disburse federal, state, or local grants for capital funding. The responsibility for
local matches can fall to either the public agency or the non-profit or both.
43
The WE-Cycle system in Aspen, Colorado was also established through the grass-roots efforts of local champions of the
concept.
39. June 16, 2014
Eugene Bike Share Feasibility Study │32
Membership and user fees generally cover only a portion of the operating cost (up to 35% in Boulder) with the
remainder needing to be supplemented by other sources – in particular from sponsorship and advertising.
Smaller markets tend to attract numerous smaller sponsors rather than a few large ones. This means a lot of
time and effort is required to identify, commit, and retain sufficient sponsorship to make the system financially
sustainable.
Table 4.3: Case Studies of Small and Mid-Sized Community Bike Share Systems in the United States
Boulder B-Cycle
Chattanooga Bike
Transit System
Fort Worth Bike
Sharing
Salt Lake City
GREENbike
BUSINESS MODEL
Impetus Driven
By
Local community group City Transit Agency City and Chamber of
Commerce
Ownership Non-Profit City Non-Profit Non-Profit
Contract
Administrator
- City - Non-Profit
Operator Non-Profit Private Non-Profit Downtown Alliance
City Role Funding agent, federal
/ state grant agent,
Board representation,
planning
Owner, administrator,
fundraising, planning
Project partner Part of non-profit,
funding partner
Transit Agency
Role
Project partner Federal grant agent,
station planning
Initiated bike share
idea, FTA grant agent,
project partner,
sponsor, station
planning
Strategic partner,
funding partner
College Role Project partner, one
station on campus,
sponsor, planning
partner
Stations on campus,
subsidized
membership, research
Stations on campus,
discounted
membership, sponsor
Limited involvement
FUNDING
Capital City pursues federal,
state, local grants; BBC
fundraises local match
Federal grant Transit Authority
pursued FTA grant
Local funding and
strategic partner
contributions
Operations Membership and usage
fees (35%);
sponsorship; local
funds
Membership and usage
fees (25%) and
sponsorship
- Strategic partner
contributions and
sponsorship
40. June 12, 2014
Eugene Bike Share Feasibility Study │33
Section II
System Planning
41. June 16, 2014
Eugene Bike Share Feasibility Study │34
5 System Goals
An important component in determining the feasibility of a bike share system is to understand the system’s role
in the community, decide what benefits are considered most valuable, and determine what will be considered a
successful system. To this end, the project team developed a set of goals and objectives based on meetings with
key regional stakeholders and initial feedback from the public.
These initial goals were then sent back to local stakeholders to get their position on what are the most
important priorities for a potential bike share system in Eugene. Nineteen stakeholders responded to the survey
and from these responses a set of final goals and objectives were established. Table 5.1 shows the final
proposed goals and objectives in priority order from most important to least important. The objectives
underneath each goal have also been ranked similarly.
Table 5.1: Proposed Goals and Objectives for a Potential Eugene Bike Share System
Goal Objectives
1. Personal Mobility • Integrate the bike share system with compatible adjacent land uses, including
transit facilities and high activity centers.
• Increase the reach of complementary transportation modes such as transit and
walking.
• Increase transit capacity between Downtown Eugene and the University of Oregon.
• Increase the accessibility of neighborhoods that are currently underserved by
transit.
2. Bicycling, Health
and Safety
• Divert single occupancy vehicle trips to bicycling and foster an active lifestyle.
• Increase the prevalence of people riding bicycles to enhance bicycling “safety in
numbers” and encourage investment in new bicycling infrastructure.
• Increase the bicycle mode share for short distance trips (less than 2 miles).
• Educate the public about safe bicycling practices and rules of the road.
3. System Quality • Create and maintain a customer-service focused system that is tidy, with bicycles
that are well-maintained and stations that are well-balanced.
• Create and maintain a system that is integrated into the urban fabric, and has a self-
contained power and communication system with minimal need for infrastructure
improvement.
• Identify system performance targets based on community expectations and develop
measures to hold system operators accountable.
4. Long Term
Financial
Sustainability
• Create and maintain a contract structure whereby the system owner and operator
are both incentivized to sustain a financially sustainable system.
• Plan for and ensure sustainable capital and operational funding for system growth
and ongoing equipment replacement.
• Create a pricing structure that encourages ridership and increases revenues, and
lowers barrier to entry to encourage low-cost trial usage.
• After initial seed funding, operating expenses should be funded with minimal public
assistance.
• Clearly communicate system performance and effectiveness to partner agencies
and the public.
42. June 16, 2014
Eugene Bike Share Feasibility Study │35
Goal Objectives
5. Social and
Geographic Equity
• Ensure that bike share is cost competitive and financially accessible to users of all
economic strata and is an affordable alternative compared to other modes of
transportation.
• Create a system with stations located to service the greatest number of
neighborhoods and activity centers, while ensuring the economic feasibility of those
stations.
• Create a pricing structure that lowers barrier to entry and is accessible to people of
all income classes.
6. Economic Benefits • Provide an enjoyable and active means of transportation for visitors to Eugene,
including conference attendees, families of students and tourists to the area that
allows them to explore more neighborhoods and experience different parts of the
community.
• Create opportunities for developers, business owners, and employers to use bike
share as an alternative to private automobile travel through developer parking
reductions, discounted bike share memberships, and other programs.
• Collaborate with local businesses to leverage the bike share system to attract new
workers and promote new business startups.
• Create a system that will attract national attention to Eugene and that will both
attract visitors and retain residents.
Prioritization of the goals shows a system that is focused on giving Eugene more transportation options and
increasing the prevalence of bicycling in Eugene. Following these key goals, the system must be well maintained
and be sustainable financially. Although equity is a stated goal of the system, financial sustainability should not
be sacrificed for equity. Finally, although economic benefits were discussed during stakeholder meetings, the
priority rankings placed this goal below the other goals. Therefore, when designing the system, providing a
transportation service for residents should be considered at the highest priority, with visitor usage a lower
priority. However, visitor revenue is important to the financial sustainability of the system, moving the priority
of their usage higher up in the goals.
43. June 16, 2014
Eugene Bike Share Feasibility Study │36
6 Public and Stakeholder Engagement
Public and stakeholder outreach was undertaken to gather input from the local community about the potential
for bike share in Eugene and the surrounding region. The overall input was that there is significant support for
bike share in Eugene, both in the general public and among small and large organizations. The most significant
use of the system was clearly to connect the University of Oregon with Downtown Eugene, and it would be
important to have a system that fully integrates the University of Oregon system with a system in Downtown.
Both the general public and most stakeholders, however, expressed strong concern with the potential financial
sustainability of a bike share system in Eugene. Questions were raised as to whether large sponsorship funding
would be available in the Eugene community, and whether a sustainable operations model could be created for
bike share in Eugene. Finally, there were many comments that neither the City nor LTD should directly own a
bike share system given current large commitments and funding difficulties.
The biggest overall impact on the recommendation for bike share in Eugene from the public and stakeholder
engagement is that a non-profit governance structure likely addresses all of these issues most effectively. A non-
profit organization can have the lowest potential operating costs, put together the most diverse set of funding,
and most easily allow for University of Oregon integration. This option is discussed in further detail in Section 9.
Details of the public outreach effort, as well as an analysis of University of Oregon integration, are described
below.
6.1 Public Input
Public outreach included an open house information session and the creation of a project website
(www.eugene-or.gov/bikeshare). The project website included information about the project, links to a bike
share survey, and an online map where users could locate or support potential station locations.
6.1.1 Public Meeting
A public meeting was held at Lane Community
College’s downtown campus on Wednesday February
12, 2014 to introduce the project and obtain initial
feedback from the community. The meeting was
attended by sixteen people and included a
presentation introducing bike share and outlining the
project schedule, followed by a question and answer
session. There were also hard copy versions of the
bike share survey and maps for attendees to suggest
station locations.
Participants were asked to select what they
considered to be the major priorities for a bike share
system in Eugene. The top priorities identified were
high membership and ridership, and integration with the University of Oregon system. Social and geographic
equity, improving livability, economic competitiveness, and financial performance were also considered
Figure 6.1: Public Open House Presentation.
44. June 16, 2014
Eugene Bike Share Feasibility Study │37
important. The top priorities lined up with the ultimate prioritization of goals and objectives by stakeholders, as
discussed in Section 5.
Overall, attendees were generally supportive of the concept of bike share and the questions asked included the
following themes:
• Integration of the system with the University of Oregon and other systems in the state;
• Social equity: ensuring the system is affordable and engages lower-income communities; and
• Funding: utilizing innovative funding mechanisms given the traditional avenues of public funding or large
corporate sponsors may not be available.
A summary of the public meeting is included in Appendix A.
6.1.2 Bike Share Survey
An online survey was made available during February and March 2014 on the project website and was promoted
through a variety of sources including links from the Lane Transit District, City of Eugene, and Point2Point
websites, student media at the University of Oregon, press releases, local publications, at the public open house,
and through social media. The survey included 20 questions asking respondents demographic and employment
information; current bicycling habits; and opinions on bike share implementation.
The survey results helped to understand:
• What role bike share could play in Eugene;
• What kind of support (or opposition) there is for a possible bike share system; and
• How much people might use and be willing to pay for the system.
The following section provides a summary of the 91 responses received. Complete survey results can be found in
Appendix B. It should be noted that there are some limitations to this survey and the results should not be
considered a statistically valid sample. Many of the respondents are self-selecting individuals who either
strongly support or oppose bike share and may be more inclined to complete the survey, rather than a randomly
chosen sample.
Demographic and Employment Information
Survey participants were asked to provide demographic and employment information. Based on the results of
the survey, Table 6.1 compares the demographics of respondents with the citywide population of Eugene. This
shows that survey respondents tended to over-represent younger, male, and higher income populations.
45. June 16, 2014
Eugene Bike Share Feasibility Study │38
Table 6.1: Comparison of Survey Respondent and Citywide Demographics
Demographic Survey Respondents Eugene Population Representation
Age (median) 39 43 Survey over-represented younger
populations
Gender (% female) 40% 48% Survey under-represented female
population
Ethnicity (% white) 88% 90% Survey represents non-white
populations
Annual Household Income
(median)
$60,000 $42,000 Survey over-represented higher
income households
College Enrollment
(% enrolled)
22% 26% Survey represents citywide college
enrollment
The survey also asked respondents to provide the zip code of their current residence, place of employment, and
school (if currently enrolled). Figure 6.2 shows the distribution of survey responses by zip code. The majority of
respondents (96%) live in Lane County with 92% living in Eugene-Springfield Metro Area.
Current Bicycle Usage
Generally, survey respondents represented active cyclists. A summary of bicycling usage amongst survey
respondents is included on Figure 6.3.
The significant majority (89%) of respondents reported having access to a working bicycle and 74% indicated
that they ride daily or multiple times per week. Approximately two-thirds (65%) of respondents are year-round
bicyclists that are willing to ride regardless of weather conditions.
Just over one-third of respondents (36%) indicated that they had previously used a bike share system, with
Capital Bikeshare (Washington, DC), Madison B-cycle (Madison, WI) and Barclays Cycle Hire (London, UK) being
the most common.
Opinions on Bike Share and its Feasibility in Eugene
A majority of survey respondents (70%) were of the opinion that a bike share system is a good idea for Eugene,
approximately one-quarter (27%) were not sure, and approximately 3% did not think it was a good idea.
When asked why bike share was a good idea, respondents included as reasons:
• Provide all community members with access to a cheap and efficient form of transportation;
• Increase connectivity to transit;
• Promote health, tourism and local businesses; and
• Provide additional connections to Downtown Eugene and the University of Oregon.
46. June 16, 2014
Eugene Bike Share Feasibility Study │39
Figure 6.2: Distribution of Survey Responses by Zip Code.
Respondent Household Zip Code,
Normalized By Area
Respondent School Zip Code,
Normalized By Area
Respondent Employment Zip Code,
Normalized By Area
0-1
2-5
6-16
17-35
0
1-2
3-4
5-10
0-1
2-4
5-14
15-25
47. June 16, 2014
Eugene Bike Share Feasibility Study │40
Figure 6.3: Current Bicycling Usage Trends Amongst Survey Respondents.
Respondents who indicated they didn’t think bike share was a good idea for Eugene were also asked to share
their reasoning. Explanations for not supporting the system included:
• Cost of implementation and maintenance;
• Opportunity cost, i.e., other bicycling investments may have larger returns;
• The high number of people in Eugene that already own bicycles; and
• Relatively small tourist and visitor market.
Forty-percent of survey respondents stated that they would utilize a bike share system at least once a week
(42%), while only 6% stated that they would never use the system.
Respondents stated that the most likely trips that they would use bike share for included: running errands; going
to or from transit stops; going to meetings; and shopping or dining out. A full break down of anticipated trip
types is included on Figure 6.4.
48. June 16, 2014
Eugene Bike Share Feasibility Study │41
Figure 6.4: Stated Frequency and Trip Purpose for Bike Share Trips in Eugene.
49. June 16, 2014
Eugene Bike Share Feasibility Study │42
When asked about what prices they would likely pay for
annual, weekly and daily memberships, survey
respondents stated that they would pay an average of
$67, $15 and $8 respectively.
Other Results
Further analysis of the survey responses found that:
• Of those people that do not currently have access to a working bicycle (11% of respondents), 60% stated
that they would use bike share frequently, i.e., at least once a week. Similarly, of the 14% of people who
bicycle only a few times per year, 60% stated that they would use bike share frequently.
• Under-represented population groups provided the following responses:
o Female respondents (39%) identified that they would use bike share primarily for running
errands, going to meetings and riding to transit.
o About 20% of respondents self-selected as non-white and most (80%) stated they would use
bike share frequently.
o Lower income individuals (i.e., those people earning less than the median income in Eugene)
represented 38% of respondents and of these, 88% stated that they would use bike share at
least once a month. These individuals reported that if bike share were available they would use
bicycles for running errands, riding to transit, and meeting family and friends most often.
• Of the 36% of respondents that had previously used bike share, 77% supported a bike share system in
Eugene.
6.1.3 Interactive Web-Based Mapping Tool
The project website provided a link to an interactive web map that provided an opportunity for the public to
suggest possible bike share station locations. The interactive map was opened for public comment in early
February 2014 and as of March 4, 2014, 193 station suggestions were submitted, with many of these locations
being preferred (“liked”) by multiple users.
Suggested station locations were exported as a Geographic Information System (GIS) shapefile and mapped by
the project team on Figure 6.5 (with each station weighted by the number of “likes”). This feedback was used
along with the community analysis to produce a demand analysis map.
6.1.4 Summary of Public Input
Based on public input, the following opportunities and challenges were identified:
Challenges:
• Some survey respondents expressed concerns about the feasibility of a bike share system in Eugene
given the (low) density of land use and the financial investment required; and
• Some survey respondents believe that even if capital funds are raised, operational costs will present on-
going challenges.
$67 Annual membership
$15 Weekly membership
$8 24-hour access
50. June 16, 2014
Eugene Bike Share Feasibility Study │43
Figure 6.5: Public Suggested Bike Share Station Locations.
Opportunities:
• Public feedback generally indicates strong public support for a potential bike share system;
• Survey respondents indicated that they would be willing to pay prices commensurate with comparable
bike share systems in other parts of the country; and
• Public suggestions for bike share station locations generally align with the demand analysis (presented
in Deliverable 2 and shown on Figure 12 of that memorandum).
6.2 Stakeholder Engagement
Stakeholder outreach was conducted through several workshops with individuals and organizations that could
play a role as supporters, sponsors, or participants of the bike share system. The project team gathered
information from over 30 organizations during the course of the feasibility study. The bulk of stakeholder
engagement was conducted through a series of workshops held on February 11 - 12, 2014 in Eugene. Each group
was asked to provide input on what they thought a bike share system could provide for the community, the
challenges they saw to implementation, and how their organization could become involved.
51. June 16, 2014
Eugene Bike Share Feasibility Study │44
Given the number of stakeholders, workshops were conducted with stakeholders in smaller groups. The
workshop groups included: transportation and permitting, food and beverage, large businesses and developers,
business associations, sponsorship, tourism, and health and wellness.
Following were the organizations represented in stakeholder meetings:
• City of Eugene (many different agencies)
• Lane Transit District
• University of Oregon (many different departments)
• City of Springfield
• Oakshire Brewing
• Hot Mamas Wings
• Lane Community College
• NW Community Credit Union
• CAWOOD (Marketing Agency)
• University Small Business Association
• Downtown Eugene Incorporated
• Bell+Funk (Marketing Agency)
• Hilton Eugene
• Eugene, Cascades & Coast Sports
• VA Hospital
• Falling Sky Brewing
• IMG (Sports Marketing)
• PeaceHealth (Health Care)
• Concentric Sky (Software)
Each meeting included an introduction to bike share in the United States and in the region and then turned to a
group discussion where participants were asked to introduce themselves and identify how bike share might be
relevant to their organization. Participants were also asked to identify any challenges they saw to implementing
a bike share system and, depending on the group, the appropriateness of potential sponsorship scenarios.
The majority of the organizations were supportive of a bike share system in Eugene. In particular, organizations
believed that bike share could help Eugene in the following ways:
• Connect Downtown and the University of Oregon;
• Enhance the livability of Eugene to retain younger employees in the growing technology sector;
• Alleviate congestion on the EmX;
• Potential large sponsor opportunities, as well as smaller businesses banding together for group
sponsorships and employee bike share membership packages; and
• Connect neighborhoods that are not currently connected by other forms of public transit such as the
Whiteaker Neighborhood.