1. 1 University of Oregon Investment Group
Presentation Date
Sector
Covering Analysts: Name
Investment Thesis
FMC’s transition from a diversified chemical company to a simpler, more
focused, agricultural, health and nutrition company will make them more
reliant on the performance of the agricultural industry.
FMC’s higher multiples relative to comparable peers suggest that it is
currently trading at a slight premium.
Larger debt positions and the increasing need for more investment research
and development to produce new technologies will limit the cash that is
available to shareholders.
High inflation and import restrictions in Argentina, combined with slowing
demand in China for high-end protein beverages, and the challenging
environment in the agricultural markets will reduce FMC’s earnings in the
next twelve months.
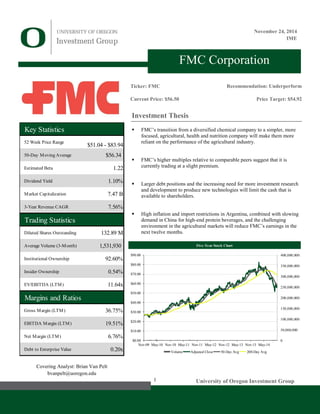
Five-Year Stock Chart
0
50,000,000
100,000,000
150,000,000
200,000,000
250,000,000
300,000,000
350,000,000
400,000,000
$0.00
$10.00
$20.00
$30.00
$40.00
$50.00
$60.00
$70.00
$80.00
$90.00
Nov-09 May-10 Nov-10 May-11 Nov-11 May-12 Nov-12 May-13 Nov-13 May-14
Volume Adjusted Close 50-Day Avg 200-Day Avg
FMC Corporation
Ticker: FMC
Current Price: $56.50
Recommendation: Underperform
Price Target: $54.92
Key Statistics
52 Week Price Range
50-Day Moving Average $56.34
Estimated Beta 1.22
Dividend Yield 1.10%
Market Capitalization 7.47 B
3-Year Revenue CAGR 7.56%
Trading Statistics
Diluted Shares Outstanding 132.89 M
Average Volume (3-Month) 1,531,930
Institutional Ownership 92.60%
Insider Ownership 0.54%
EV/EBITDA (LTM) 11.64x
Margins and Ratios
Gross Margin (LTM) 36.75%
EBITDA Margin (LTM) 19.51%
Net Margin (LTM) 6.76%
Debt to Enterprise Value 0.20x
$51.04 - $83.94
Covering Analyst: Brian Van Pelt
bvanpelt@uoregon.edu
November 24, 2014
IME
2. UOIG 2
University of Oregon Investment Group
Business Overview
John Bean founded FMC Corporation in 1883 in Los Gatos, CA under the name
Bean Spray Pump Company. The company’s first product was the piston pump,
which was used to spray insecticides on many of the fruit orchards in the area. In
1948, the company changed its name to Food Machinery and Chemical
Corporation following the acquisition of two canning machinery companies in
1928, and Bolens Lawn and Garden Equipment in 1946. Since then, FMC has
manufactured a wide variety of products including landing vehicle-tracked
vehicles (LVT’s), fire truck pumps and pumper bodies, cranes and excavators,
even Armored Personnel Carriers for the United States War Department during
WWII. Today, FMC is a diversified chemical company that operates in three
segments: FMC Agricultural Solutions, FMC Health and Nutrition, and FMC
Minerals. FMC serves customers in four geographic regions: North America,
Latin America, Europe, the Middle East and Africa (EMEA), and Asia Pacific.
It is headquartered in Philadelphia, PA and has approximately 5,600 employees.
Business Segment Analysis
FMC Agricultural Solutions
The FMC Agricultural Solutions segment, which accounted for approximately
55% of FMC’s 2013 revenue, is the company’s largest and fastest growing
segment. This segment develops, manufactures, markets, and sells a wide
variety of crop protection, pest control, and lawn and garden products. The FMC
Agricultural Solutions product portfolio is comprised of three major pesticide
categories: herbicides (protect crops from weed growth), insecticides (protect
crops from insects), and fungicides (protect fruits and vegetables from fungal
disease).
FMC Agricultural Solutions is the leading global supplier of technology-based
crop protection products that serve niche crop markets. FMC works closely with
customers to develop differentiated, technically superior products to meet
rapidly changing market needs. FMC then exclusively sells these products
through their global market access positions.
FMC Agricultural Solutions is global in scope but holds particular strength in
the Americas. They are able to access key markets across the globe through
their own sales and marketing organization, independent distributers, and joint
venture agreements.
Over the past five years, revenue in this segment has increase at a compound
annual growth rate (CAGR) of 15.33%. The majority of growth in recent years
has largely been driven by FMC’s expansion into South America, which
includes the large agricultural market of Brazil. Going forward, FMC expects to
maintain and enhance their access positions in key agricultural markets, and
continue to develop new high-margin niche products that will enable them to
compete effectively.
FMC Health and Nutrition
Source: FMC 10-K
33%
36%
18%
13%
North America
Latin America
Asia Pacific
EMEA
Figure 1: Revenue by Region - 2013
Source: FMC 10-K
24%
55%
15%
6%
North America
Latin America
Asia Pacific
EMEA
Figure 3: Agricultural Solutions Revenue by
Region - 2013
Source: FMC 10-K
Figure 2: Agricultural Solutions Revenue and
Operating Margin 2009 - 2013
$1,052 $1,242
$1,465
$1,764
$2,146
0%
10%
20%
30%
40%
50%
60%
$0
$500
$1,000
$1,500
$2,000
$2,500
2009 2010 2011 2012 2013
Revenue (millions) Operating Margin
3. UOIG 3
University of Oregon Investment Group
The FMC Health and Nutrition Segment focuses on high performance food
ingredients, nutraceuticals, pharmaceutical ingredients, and other specialty
consumer products to meet increasing global demand for nutritious and
convenient foods, effective pharmaceuticals, and beneficial nutrient
supplements. The segment consists of six naturally derived products:
microcrystalline cellulose (MCC) from specialty grades of wood pulp,
carrageenan and alginates from seaweed, natural colorants from plants and
select insect species, pectin from citrus fruit peels, and omega-3 from fish oil.
The primary focus of the Health and Nutrition segment is on food and
pharmaceutical markets, but FMC has worked to expand its presence in
nutraceuticals, cosmetics, and other related product categories. Product offerings
serving the food markets principally provide texture, structure, and physical
stability (TSPS) to stabilize and thicken certain food products. In the
pharmaceutical industry, products function as binders, disintegrants, control-
release compounds, and suspending agents for the production of both liquid and
solid pharmaceutical products.
Revenue in this segment accounted for approximately 20% of total revenue in
2013 and has increased at a 5.6% CAGR over the past five years. FMC Health
and Nutrition continues to strengthen its business in emerging markets,
particularly in Asia where demand for MCC used in foods and high-protein
beverages continues to rise. While in developed economies, FMC is continuing
to grow sales by enhancing color, texture, structure and stability in food
products.
FMC Minerals
The FMC Minerals segment is FMC’s least diverse segment and accounted for
approximately 25% of company revenue in 2013. This segment consists of only
two divisions: Alkali Chemicals and Lithium, which accounted for 77% and
23% of segment revenue in 2013, respectively.
The Alkali Chemicals division is the world’s largest producer of natural soda
ash, a primary ingredient used to produce glass. Historically, the large cash
proceeds generated by this division helped cover the operational expenses of
other divisions within the company. However, in September FMC announced
that it plans to sell the Alkali Chemicals division midway through 2015 to help
leverage the acquisition of Cheminova A/S.
Thus, going forward the FMC Minerals segment will only consist of the lithium
business. FMC extracts lithium from its lithium brines in Argentina. Lithium is
used for batteries, polymers, pharmaceuticals, greases and lubricants, glass and
ceramics, and other industrial uses. Although lithium can be sold into a variety
of different end markets, FMC has focused their strategy on energy storage,
polymer, and pharmaceutical uses.
Business Growth Strategies
Figure 5: Health and Nutrition Revenue by
Region - 2013
Source: FMC 10-K
32%
9%
25%
34%
North America
Latin America
Asia Pacific
EMEA
Figure 4: Health and Nutrition Revenue and
Operating Margin 2009 - 2013
Source: FMC 10-K
$580 $611
$654 $681
$762
0%
10%
20%
30%
40%
50%
60%
$0
$100
$200
$300
$400
$500
$600
$700
$800
$900
2009 2010 2011 2012 2013
Revenue (millions) Operating Margin
Figure 6: FMC Minerals Revenue and
Operating Margin 2009 - 2013
Source: FMC 10-K
$748 $837
$918
$966 $970
0%
10%
20%
30%
40%
50%
60%
$0
$200
$400
$600
$800
$1,000
$1,200
2009 2010 2011 2012 2013
Revenue (millions) Operating Margin
4. UOIG 4
University of Oregon Investment Group
In 2010, FMC presented its revised corporate strategy and business growth plan
for the next five years. This plan, named Vision 2015, focuses on driving sales
and earnings growth through organic growth, targeted acquisitions, and active
portfolio management. Vision 2015 has five key elements:
.
Growing Leadership Positions
FMC plans to continue to strengthen their market-leading positions primarily
through organic growth, which will be complemented by a focused external
growth strategy.
FMC Agricultural Solutions is focused on new product and market innovations
to drive organic growth. Organic growth in this segment comes from moving
into new crops or expanding solutions for existing crops. Growers are constantly
demanding new pesticides that increase crop yields, and over time certain
insects, weeds, and funguses develop immunities to certain crop protection
chemicals. Therefore, FMC’s growth in this segment will be dependent on their
ability to develop environmentally compatible and sustainable customer-based
solutions, and quickly bring them to market. FMC plans to compliment this
organic growth through targeted acquisitions, such as the acquisition of
Cheminova, which add new products and technologies to their portfolio, and
allow them to strengthen their market access and enter into adjacent spaces.
In FMC Health and Nutrition, new products and new applications for existing
products will drive organic growth in the upcoming years. The external growth
efforts in this segment are directed towards product and small company
acquisitions that complement existing supply chain competencies and serve
similar end markets as their current products (food ingredients, pharmaceuticals,
nutraceuticals, etc.).
The FMC Minerals segment is focused on growing their leadership positions
through organic growth that is driven by decreasing the unit cost production of
lithium. This segment evaluates acquisitions opportunistically and therefore
does not have an active external growth strategy.
Increasing Reach
Rapidly develop economies have been the main focus of FMC’s geographic
growth initiatives over the past couple years. FMC plans to further strengthen
their position in RDEs, particularly in Latin America and East Asia. Growth in
Latin America will depend on FMC’s ability to leverage their FMC Agricultural
Solutions leadership positions and expand into new markets such as Argentina
and Central America. In Asia, FMC is investing in human, scientific, and
technological resources across the region, such as their new MCC plant in
Thailand, to gain market access and increase their reach.
Capturing the Value of Common Ownership
FMC has gradually shifted their organizational structure from a decentralized
model to one that has both centralized and decentralized qualities, to better
leverage size and scale. The priority areas of this shift are procurement, global
supply chain, and RDE infrastructure. FMC believes that this balanced model
Figure 7: Vision 2015 Logo
Source: Google Images
Figure 9: FMC Asia Innovation Center –
Shanghai, China
Source: FMC Presentation
Source: FMC Presentation
Figure 8: Agricultural Innovation Focus
5. UOIG 5
University of Oregon Investment Group
will help them realize efficiencies, while maintaining strong accountability
across all their business units.
Proactive Management of the Business Portfolio
FMC is constantly assessing the performance of all of their business divisions
and product lines to make sure that all businesses are well positioned for
sustained economic growth. If FMC believes that a business or product line has
become non-core or lacks economical sustainability, it will take the appropriate
actions, such as the divestiture of the FMC Peroxygens segment in 2013, the exit
of the zeolites product line in 2012, and the exit of the sodium percarbonate
product line in 2011. A complete summary of FMC’s proactive portfolio
management can be found in Appendix 7.
Disciplined Cash Deployment
FMC’s external growth strategy is not expected to consume all the cash
available for deployment. Thus, the final element of FMC’s Vision 2015
strategic plan is to return a significant amount of cash to shareholders through
share repurchases and cash dividends. In April 2013, the board of directors
authorized the repurchase of up to $500 million of common shares. However,
FMC has not repurchased any shares in 2014.
Strategic Positioning
Since 2010, FMC has engaged in numerous acquisitions, strategic alliances,
collaborations, and dispositions of non-core businesses, as part of their proactive
portfolio management. This activity and corporate restructuring has resulted in a
business that looks significantly different than it did five years ago. Therefore, to
effectively analyze the strategic positioning of FMC, it is beneficial to look at
the strategic positioning of each individual segment.
FMC Agricultural Solutions
This segment has experienced the least amount of structural change over the past
five years. It continues to develop, manufacture, and sell pesticides to customers
globally, and is still the main driver of company revenue. Although FMC has
explicitly stated in the past that its external growth strategy excludes making
large-scale, transformational acquisitions, they made a splash in September with
the announcement to acquire Cheminova.
Cheminova is a privately owned Danish crop protection company that had $1.3
billion in revenues in 2013 (roughly 1/3 of FMC’s 2013 revenue). The deal will
transform FMC into much more of a pure play agrochemical company with
FMC Agricultural Solutions revenues projected to represent 77% of total
company revenue pro forma (up from 55% in 2013).
The Cheminova acquisition will significantly strengthen FMC’s market access
in Europe, as well as in Latin America, and select Asian countries. Cheminova
has an attractive portfolio of over 60 active ingredients, which will add to a
robust innovation pipeline and enhance FMC’s ability to deliver new and
differentiated products.
Figure 11: Cheminova Logo
Source: Google Images
Figure 10: Notable Acquisitions and Dispositions
Source: FMC Presentation
Proactive Portfolio Management
Dispositions:
Phosphates (2010)
SodiumPercarbonates (2011)
Zeolites / Silicates (2012)
Peroxygenst (2014)
Alkali Chemicals (2015 E)
Acquisitions:
Phytone (natural colorants) (2012)
Pectin Italia (2012)
Epax(omega-3) (2013)
Cheminova (2015 E)
6. UOIG 6
University of Oregon Investment Group
In addition to targeted acquisitions, FMC frequently enters into strategic
alliances and collaborations with other agrochemical companies to increase
market access and gain new technologies. In 2013, FMC entered into an
exclusive collaboration with Chr. Hansen, a leading global biosciences
company, which was complemented with the acquisition of the assets of the
Center for Agricultural and Environmental Biosolutions (CAEB). The two
separate transactions give FMC a strong foundation for developing biologically
based products that enhance farmer’s yields and respond to evolving pest
pressures and resistance.
As a result of their recent acquisitions and strategic alliances, FMC believes they
are well positioned to meet rapidly changing market demand for innovative and
technology based crop protection chemicals. They will continue to use active
ingredient innovation and formulation science to focus on higher-margin niche
crops and pockets of technical differentiation in row crops.
FMC Health and Nutrition
Formerly reported as the Specialty Chemicals segment, the FMC Health and
Nutrition segment was created in 2013 after the divestiture of the FMC
Peroxygens business. FMC Health and Nutrition has positioned itself to meet
growing demand in the food ingredient, pharmaceutical, and nutraceutical end
markets by expanding their natural product line through the acquisitions of Epax
(2013), Pectine Italia S.p.A (2012), and Phytone Ltd (2012).
Epax is a global supplier of omega-3 fatty acid concentrates derived from fish
oils. Going forward, FMC believes that its UK Seal Sands facility, which uses
advanced technology to manufacture high purity, high-concentration Omega-3
products, will enable cost-effective penetration into the pharmaceutical and
nutraceutical end markets.
Pectine Italia S.p.A produces pectin, a stabilizing and thickening agent derived
from citrus peels that is used in a variety of foods. Phytone Ltd. is a producer of
natural colorants that are used by customers in the food, beverage, and personal
care sectors. These acquisitions have provided FMC Health and Nutrition with a
diverse portfolio of biopolymers that serve multiple different end markets. As a
result, FMC Health and Nutrition is the FMC’s least cyclical business segment.
FMC Minerals
In September, FMC announced that it plans to sell the Alkali Chemicals division
to help leverage the acquisition of Cheminova. Therefore, the FMC Minerals
segment will just consist of the lithium business in the future.
FMC has focused their Lithium efforts on the energy storage, polymer, and
pharmaceutical markets. They have also invested heavily in manufacturing
additions in recent years to try and achieve what they refer to as “operational
excellence”. As a result, FMC has experience 12 consecutive months of
improved operations and record volumes at their lithium processing facility in
Figure 12: FMC’s Revenues Pro Forma
Source: FMC Earnings Call
77%
18%
5%
FMC Agricultural
Solutions
FMC Health and
Nutrition
FMC Minerals
Figure 13: 2015 Product Lines
Source: UOIG Spreads
Segment Products
Agricultural Soloutions Herbicides
Inseticides
Fungicides
Health andNutrition MCC
Carrageenans
Alginates
Natural Colorants
Pectin
Omega-3 EPA/DHA
Minerals Lithium
Soda Ash
Source: Google Images
Figure 14: Lithium Brines
7. UOIG 7
University of Oregon Investment Group
Argentina. Thus, FMC is well positioned to capitalize on increasing global
demand for lithium.
Industry
FMC is classified as operating in the diversified chemicals industry. However,
the industry is way too diverse and broad in scope to provide a meaningful
analysis for FMC. Therefore, it is better to look at the specialized industries in
which each FMC segment operates.
Pesticide Industry
The pesticide industry is a mature industry that consists of companies that
manufacture crop protection chemicals. Currently, there are fewer than 20 basic
manufacturers of pesticide chemicals (Fredonia Group). Since the pesticide
industry can increase crop yields and boost farm productivity, it is considered an
integral component of the agricultural sector and is heavily dependent on
agricultural production. IBISWorld projects the pesticide industry to grow at an
average annual rate of 3.4% from 2014-2019.
Aside from general factors such as local climate, soil conditions, and prevalence
of harmful agricultural pests, demand is mainly determined by farm incomes and
demand from crop production. Farm incomes can be influenced by a number of
factors, but are primarily driven by commodity prices and the level of
government subsidies available to farmers. Agricultural commodity prices are
measured by the Agricultural Price Index (API), which measures the costs of all
agricultural products. The API is projected to decrease in the upcoming years,
posing a threat to the pesticide industry.
Technological innovations in the agricultural industry are also posing a major
threat to the pesticide industry; the main one being the use of genetically
modified (GM) seeds. GM seeds typically produce greater farm yields and are
designed to be significantly more resistant to pests, thereby reducing the demand
for pesticides. Without widespread consumer concern and government
regulations dictating change, the commercial use of GM seeds is likely to
increase over the next 5-10 years.
Other external factors that could negatively impact the pesticide industry in the
immediate future include increasing health and environmental concerns about
the use of pesticides, and the resulting rise in environmental compliance costs.
Thus, continued product innovation will be a very important part of the industry
going forward as the demand for safer and more carefully designed chemicals
increases.
Despite having fewer than 20 basic manufacturers, competition in the pesticide
industry is relatively limited due to the highly differentiated nature of products.
The top six players in the industry account for approximately 65% of the
industry’s global sales. However, rather than competing with the industry
leaders in sales volume, FMC competes with the next tier of agrochemical
companies through unique technologies that focus on specific crops, markets,
and geographic regions.
Source: IBISWorld
Figure 15: Pesticide Industry Characteristics
Life Cycle Stage: Mature
Concentration Level: Medium
Competition Level: Low
Revenue Volatiliity: Medium
Capital Intensity: High
Technology Change: High
Regulation Level: Very High
Industry Assistance: Medium
Barriers to Entry: High
Industry Globalization: Medium
Pesticide Industry
Figure 16: Agricultural Price Index 2006-2020
Source: IBISWorld
Figure 17: Product and Services Segmentation
- 2014
Source: IBISWorld
60%20%
10%
10%
Herbicides
Insecticides
Fungicides
Other
8. UOIG 8
University of Oregon Investment Group
Organic Chemicals Industry
The organic chemicals industry is an extremely diverse industry with hundreds
of competing firms that produce thousands of various chemical products. Unlike
the agrochemical industry, concentration in the industry is low, with the top
players accounting for less than 5% of total industry revenue. The industry
experienced significant growth from 2009-2014 as the economy recovered from
the recession and industrial production increased. However, due its mature
nature, the organic chemicals industry is only expected to grow at an annual rate
of 3.1% from 2014-2019 (IBISWorld).
Much of the demand growth in the industry is driven by increasing demand in
downstream and end markets. In the case of FMC, growth within its Health and
Nutrition segment will result from growing demand in food ingredient,
pharmaceutical, and nutraceutical end markets. Demand in these end markets is
expected to increase as a result of new product innovations and increased
consumption of processed foods and pharmaceuticals in rapidly developing
economies, particularly in Asia.
Key external drivers of the organic chemical industry include consumer
spending, the world price of crude oil, and industrial production. Consumer
spending is expected to increase at an average annual rate of 2.6% over the next
five years (IBISWorld). This will increase demand in certain end markets, as
increased consumer spending will result in greater sales of consumer goods.
Just like the pesticide industry, increased regulation could significantly impact
the organic chemical industry in upcoming years, resulting in higher operational
costs for chemical manufacturers. However, FMC is not as sensitive to this risk
as other industry competitors because they do not have a product portfolio
consisting of environmentally hazardous or dangerous chemicals.
The market for food ingredients consists of a large number of competitors
because of the broad spectrum of chemistries employed. FMC’s main
competitors in the food ingredient industry include DuPont, Cargill, J.M. Huber
Corporation, and Kerry Group plc. Competitors in the pharmaceutical and
nutraceutical ingredient markets tend to be grouped by chemistry. For example,
FMC’s main MCC competitors include Ming Tai Chemical Co., Ltd, and
Blanver Farmoquimica Ltda, whereas in omega-3, FMC’s main competitors are
BASF AG, DSM and Croda International. Thus, industry participants focus less
on other competitors, and more on developing innovative new products and
finding new applications for existing products.
Lithium
There are currently only three key producers of lithium compounds in the world:
FMC, Rockwood Holdings, Inc., and Sociedad Química y Minera de Chile S.A.
Lithium is extracted from the water of brine deposits. The electrochemical
properties make it an ideal material for portable energy storage in applications
such as smart phones, laptops, tablets, hybrid electric vehicles, and other next
generation energy storage technologies.
Figure 20: Lithium Demand 2002 - 2012
Source: 2015 Tru Group Research
Life Cycle Stage: Mature
Concentration Level: Low
Competition Level: Low
Revenue Volatiliity: High
Capital Intensity: High
Technology Change: Low
Regulation Level: Very High
Industry Assistance: Low
Barriers to Entry: Medium
Industry Globalization: High
Organic Chemicals Industry
Figure 19: Organic Chemicals Industry
Characteristics
Source: IBISWorld
Figure 18: Pesticide Industry Growth Rate
2015 - 2020
Source: IBISWorld
0%
1%
2%
3%
4%
5%
6%
2015 2016 2017 2018 2019 2020
9. UOIG 9
University of Oregon Investment Group
Demand for lithium is expected to grow at compound annual growth rate of
10.1% from 2011-2025 driven primarily by energy storage used in hybrid and
electric vehicles (Tru Group Inc.)
Management and Employee Relations
Pierre Brondeau – Chairman, President and CEO
Brondeau joined FMC on January 1st
, 2010, as President and Chief Executive
Officer. He holds a Ph.D. in Biochemical Engineering from INSA in Toulouse,
France, and also holds a master’s degree in Food Sciences from the University
of Montpellier, France. Before coming to FMC he was the President and COO
of Rohm and Haas, which was acquired by Dow Chemical in 2009. Mr.
Brondeau also serves on the Board of Directors of Tyco Electronics and
Marathon Oil Corporation, and is Chairman of the Board of the American
Chemistry Council.
Paul Graves – Vice President and CFO
Graves joined FMC on October 1st
, 2012, as Executive Vice President and Chief
Financial Officer. He earned a bachelor of arts in Accounting and Finance from
Nottingham Trent University in 1993. Before joining FMC Graves served as
managing director and partner in the Investment Banking Division of Goldman
Sachs Group in Hong Kong. He brings over 19 years of international banking
and accounting experience, with a specialized focus in chemicals and
agriculture.
Management Guidance
Historically, management has been reasonably accurate with their guidance.
Every quarter they provide revised low-end and high-end estimates on EPS,
sales, and other line items. They have beat EPS guidance by an average of 1.3%
over the past three years. However, in recent quarters they have missed the
average analyst estimates, but have only missed their low-end estimate once.
Portfolio Strategy
FMC is currently held in all three of our portfolios. The Tall Fir’s portfolio is
currently in-line in IME and overweight mid-cap. Svigal’s portfolio is currently
underweight in IME and overweight mid-cap. FMC currently represent 12.47 %
of the DADCO portfolio.
Recent News
“FMC Corporation Announces Lithium Carbonate and
Lithium Salts Price Increase”
November 4th
, 2014
FMC announced that effective December 1st
, 2014, it will increase global
pricing for all grades of lithium carbonate and lithium salts, including lithium
hydroxide, specialty salts and pharmaceutical carbonate by 10 percent. The
increases are necessary to offset the increasing operating and raw materials costs
at their Argentina processing facility.
Figure 21: FMC Headquarters
Source: 2015 Google Images
Figure 22: Mid-cap Allocation vs. Benchmark
Source: UOIG Spreads
23.90%
19.30%
20.81%
11.02%
0.00%
5.00%
10.00%
15.00%
20.00%
25.00%
30.00%
Tall Firs Svigals'
Portfolio
Benchmark
10. UOIG 10
University of Oregon Investment Group
“FMC Corporation Executes Credit Agreements for $3.5
Billion”
October 14th
, 2014
FMC Corporation announced that it has executed $3.5 billion of unsecured
credit agreements with lenders to facilitate the agreement to acquire all the
outstanding equity of Cheminova A/S. The new credit agreements include a $2
billion term loan agreement that can be drawn to finance the acquisition. FMC
also amended and extended the term of its $1.5 billion revolving credit facility,
which now expires on October 10, 2019.
Catalysts
Upside
Better healthcare and greater access to pharmaceuticals in rapidly
developing economies will increase demand for FMC’s products
serving pharmaceutical end markets.
The acquisition of Cheminova will give FMC greater geographical
diversity, limiting the impact of unfavorable regional developments.
Hybrid electric vehicles (HEV’s) and other applications for portable
energy storage will increase demand for lithium.
Downside
Changes in the regulatory environment could impact FMC’s ability to
continue producing/selling certain products or could increase the cost
of doing so.
An increase in the costs of raw materials or energy, including natural
gas, could significantly affect FMC’s operating results and reduce
profitability.
The expiration of product patents will bring increased competition in
the agricultural chemical markets from generic suppliers of the same
pesticidal active ingredient.
Climate change.
Comparable Analysis
Comparable companies were screened and selected by comparing different
quantitative and qualitative metrics. Since companies within the diversified
chemical industry have highly unique and differentiated product mixes, selecting
good comparable companies was difficult. Qualitative metrics used focused on
finding companies with similar risk exposure, that serve similar end markets as
FMC, such as food ingredients, pharmaceuticals, and agricultural markets.
Companies were also evaluated based on the geographic regions they operate in
as well as the diversity of their product portfolio in comparison to FMC’s.
Quantitative metrics included finding companies comparable in size, with
similar growth rates, capital structures, and betas.
Ashland Inc. (ASH) – 30%
Ashland Inc. is a diversified chemical company that serves customers
worldwide. Ashland Inc. is divided into three segments: Ashland Specialty
Ingredients, Ashland Performance Materials, and Ashland Consumer markets.
Source: Google Images
Figure 25: Ashland Inc. Logo
Figure 23: One-year Stock Chart
Source: Yahoo Finance
One-Year Stock Chart
0
500000
1000000
1500000
2000000
2500000
3000000
3500000
4000000
$0.00
$10.00
$20.00
$30.00
$40.00
$50.00
$60.00
$70.00
$80.00
$90.00
Jun-13 Aug-13 Oct-13 Dec-13 Feb-14 Apr-14 Jun-14 Aug-14 Oct-14
Volume Adjusted Close 50-Day Avg 200-Day Avg
Figure 24: Comparable Analysis Multiples
Source: UOIG Spreads
Multiple Implied Price Weight
EV/Revenue 64.96 0.00%
EV/Gross Profit 85.43 0.00%
EV/EBIT 54.48 50.00%
EV/EBITDA 53.68 50.00%
EV/(EBITDA-Capex) 50.99 0.00%
Market Cap/Net Income = P/E 50.89 0.00%
Price Target $54.08
Current Price 56.50
Overvalued (4.28%)
11. UOIG 11
University of Oregon Investment Group
Ashland received the highest weighting because of its very similar EBITDA
growth rate, EBIT and EBITDA margins, market capitalization, and beta. In
addition, Ashland is exposed to many of the same market risks as FMC and has
a similar level of portfolio diversity.
Celanese Corporation (CE) – 25%
Celanese Corporation is a diversified chemical company that manufactures and
sells value-added chemicals and other chemical based products worldwide. The
company is divided into four segments: Advanced Engineered Materials,
Consumer Specialties, Industrial Specialties, and Acetyl Intermediaries. In
addition, the company also provides organic solvents and intermediates for
agricultural, pharmaceutical, and chemical products.
Celanese was deemed a good comparable company because it operates
internationally and produces a wide variety of chemicals and polymers used for
foods, beverages, and personal care products, thus sharing similar market risks
as FMC. It is also has a similar market capitalization and capital structure.
Eastman Chemical Co. (EMN) – 20%
Eastman Chemical Company is a diversified chemical company that
manufactures and sells specialty chemicals, fibers, and plastics. Eastman’s
products are divided into four segments: Additives & Functional Products,
Adhesives & Plasticizers, Advance Materials, Fibers, and Fluids &
Intermediaries.
Eastman was chosen as a comparable to FMC because it serves agricultural and
health end markets, and has similar EBIT and EBITDA margins. However,
Eastman received a slightly lower weighting because it has a much more
diversified product portfolio, higher market capitalization, and significantly
higher beta.
Rockwood Holdings (ROC) – 20%
Rockwood Holdings Inc. is a specialty chemical company that develops,
manufactures, and markets chemicals for industrial and commercial
applications. Rockwood Holdings Inc. is one of three key producers of basic
lithium compounds, which is used for glass and ceramics production,
performance greases, battery products, and pharmaceutical applications.
Although Rockwood holdings has significantly higher valuation multiples, It
was chosen as comparable company because it is one of FMC’s two direct
competitors in the lithium business and has a nearly identical capital structure.
Rockwood also has similar profitability margins as FMC, and a similar beta.
Monsanto Co. (MON) – 5%
Monsanto is a large-cap agricultural chemical company that operates in two
segments: Seed and Genomics, and Agricultural Productivity. The Agricultural
Productivity segment manufactures and sells herbicides for agricultural,
commercial, and industrial uses. Monsanto has operations in the United States,
Europe, Asia, Africa, Brazil, Mexico, and Argentina.
Figure 26: Celanese Logo
Source: Google Images
Source: Google Images
Figure 27: Eastman Chemical Co. Logo
Figure 28: Rockwood Holdings Logo
Source: Google Images
12. UOIG 12
University of Oregon Investment Group
Monsanto was added as a comparable because it is Agrochemical Company and
therefore shares many of the same risks as FMC, especially as FMC becomes
more of a pure play agricultural solutions company. However, due to the major
differences in size, capital structure, and growth, Monsanto only received a 5%
weighting.
Discounted Cash Flow Analysis
Revenue Model
Revenue growth was broken down into FMC’s three main business segments
and then was projected forward based on the key external drivers of each
segment and FMC’s strategic position to capitalize on those drivers. Revenue
growth is projected to peak in 2017 once all the revenues from Cheminova are
accretive, then gradually decline to 4.48% going into perpetuity.
FMC Agricultural Solutions
Agricultural Solutions is FMC’s biggest driver of revenue and was the most
challenging segment to predict because of the recent announcement that FMC
has agreed to acquire the Danish crop protection company Cheminova, which is
expected to close in early 2015.
The acquisition is expected to increase segment revenue from 55% of total
company revenue to 77% pro forma, with the majority of growth happening in
the first two years. Therefore, it was necessary to project out the revenues of
FMC’s other two business segments first, and then project Agricultural solutions
revenue through 2017 as a percentage of total company revenue.
From 2018-2022 revenue growth is expected to decrease slightly each year due
to a combination of external factors, such as the increased use of genetically
modified crops, increased regulation, and industry consolidation. However,
FMC’s unique focus on high-margin, technology-based solutions for niche crops
will allow them to outperform the industry by 300-500 basis points during those
years before dropping to 4% going into perpetuity.
FMC Health and Nutrition
Revenue growth in the FMC Health and Nutrition segment is projected decrease
to 6.00% in 2015 resulting from a slowdown in demand in China for MCC used
in high-end beverages. Even if economic growth in China remains stagnant,
FMC has positioned themselves nicely through their proactive portfolio
management to experience sustained revenue growth within this segment.
Demand in pharmaceutical end markets remains robust and is expected to
increase as rapidly developing economies gain more access to pharmaceuticals.
The number of FDA approvals for Omega-3 based products indicates growing
Omega-3 demand in the upcoming years, which FMC will be able to capitalize
on once they have more pharmaceutical customers and have developed the right
nutraceutical product.
With consumer spending expected to increase annually by 2.6% over the next
five years, and increasing global demand for beneficial supplements, effective
pharmaceuticals, and nutritious food ingredients, revenue growth in the non-
cyclical Health and Nutrition segment is projected to increase steadily from
2016-2022, before dropping to 5% in the terminal year.
Figure 29: Monsanto Logo
Source: Google Images
Figure 30: Segment Revenue (%) 2015 - 2023
Source: UOIG Spreads
0%
10%
20%
30%
40%
50%
60%
70%
80%
90%
100%
2015E 2016E 2017E 2018E 2019E 2020E 2021E 2022E 2023E
FMC Agricultural Soultions FMC Health and Nutrition
FMC Minerals
Figure 31: Segment Revenue Growth 2014 -
2023
Source: UOIG Spreads
0%
5%
10%
15%
20%
25%
30%
2014E 2015E 2016E 2017E 2018E 2019E 2020E 2021E 2022E 2023E
FMC Agricultural Solutions FMC Health and Nutrition
FMC Minerals
13. UOIG 13
University of Oregon Investment Group
FMC Minerals
FMC Minerals revenue is projected to increase from 8% in 2015 to 12.5% in
2020 as global demand for lithium continues to increase. After 2020, revenue
growth is projected to slightly decrease to 8% in the terminal year as new
producers enter the market and new technologies for energy storage emerge.
Discontinue Operations & Eliminations
FMC expects to sell their Alkali Chemicals division midway through 2015 to
leverage the acquisition of Cheminova. Thus, discontinued operations in 2015 is
projected as roughly half a year’s revenue for that segment.
Eliminations account for sales from one business segment to another. Due to
FMC’s more centralized organizational model, eliminations are not project in
the future.
Costs of Goods Sold (COGS)
COGS have remained at around 60% of total revenue over the past few years as
increased operational efficiencies in the FMC Minerals segment have been
offset by the high inflationary environment and impact of import restrictions in
Argentina. As management turns its focus towards achieving “Operational
Excellence” within the Health and Nutrition segment, and FMC capitalizes on
cost synergies and increased economies of scale from the acquisition of
Cheminova, COGS is likely to decrease. However, these cost reductions may be
partially offset by increasing energy costs and higher environmental compliance
costs due to increased regulation. Therefore, COGS is projected to decrease as a
percentage of revenue to 58.5% by 2017 and remain at that level going into
perpetuity.
Beta
FMC’s beta was determined by regressing the 3-year daily, 5-year daily, and-5
year monthly against the S&P 500. These regressions received weightings of
30%, 15%, and 20%, respectively. In addition, a 3 year HAMADA beta and a 3-
year Vasicek beta was used because of the major restructuring changes FMC has
gone through in the past three years.
Selling, General, and Administrative Expense
Selling, general and administrative expenses include sales and marketing costs,
accounting costs, fees associated with concluding acquisitions, and other
corporate expenses. SG&A expenses are projected to increase as a percentage of
revenue in 2015 and 2016 due to the transaction fees associated with the
Cheminova acquisition and the sale of their Alkali division, and then decrease
linearly as a percentage of revenue back to historical levels.
Depreciation and Amortization
Depreciation is provided on the straight-line basis over the estimated useful lives
of assets. Depreciation and Amortization was projected forward using the
percentage of Net PP&E Beginning. To account for the acquisition of
Cheminova, the approximate value of Cheminova’s net assets ($670 million)
was added to 2015 Net PP&E Beginning.
Research and Development
Figure 32: Beta Calculation
Source: UOIG Spreads
Beta SE Weighting
1-Year Daily 0.99 0.10 0.00%
3-Year Daily 1.20 0.03 30.00%
5-Year Daily 1.16 0.05 15.00%
3-Year Monthly 1.14 0.11 0.00%
5-Year Monthly 1.19 0.07 20.00%
3-Year Hamada 1.33 N/A 20.00%
3-Year Vasicek 1.20 0.05 15.00%
FMC Corp Beta 1.22
Figure 34: Long-lived Assets by Region - 2013
Source: FMC 10-K
43%
8%
15%
34%
North America
Latin America
Asia Pacific
EMEA
Figure 33: Beta Sensitivity Table
Source: UOIG Spreads
ImpliedPrice Undervalued/(Overvalued)
Terminal Growth Rate Terminal Growth Rate
55 2.0% 2.5% 3.0% 3.5% 4.0%
1.02 61.72 65.94 71.05 77.36 85.34
1.12 55.14 58.54 62.59 67.49 73.55
1.22 49.51 52.28 55.53 59.41 64.11
1.32 44.63 46.91 49.55 52.67 56.39
1.42 40.37 42.26 44.43 46.97 49.95
AdjustedBeta
14. UOIG 14
University of Oregon Investment Group
The Agricultural Solutions segment currently accounts for 85% of FMC’s total
R&D costs. Since FMC is transitioning into more of pure play agricultural
solutions company, and the industry has an increasing reliance on new
technologies and product innovation, R&D costs are projected to increase as a
percentage of revenue.
Restructuring and Other Charges
Restructuring and other charges consist of costs associated with restructuring
portions of FMC’s business such as severance benefits, and environmental
charges associated with environmental remediation at continuing operating sites.
Restructuring charges are very difficult to predict, but environmental charges are
likely to be recurring for chemical companies and may even increase. Thus,
restructuring and other charges were projected to remain in line with historical
levels, and decrease as a percentage of revenue.
Acquisitions
FMC complements its organic growth strategy with targeted acquisitions of new
products and technologies that add to their diverse portfolio. Since increasing
technological innovation and industry consolidation are two major themes of the
pesticide industry, it is likely that acquisitions will continue to be a major part of
FMC’s external growth strategy. Thus, acquisitions are projected to increase
each year, but remain steady as a percentage of revenue.
Capital Expenditures
Capital expenditures in 2014 have been significantly higher than historical levels
due to capital expansion projects in FMC Health and Nutrition and FMC
Minerals. Going forward capital expenditures are projected to increase year over
year, while marginally decreasing as a percentage of revenue.
Tax Rate
FMC’s historical effective tax rate has been roughly 25.5%. Starting in 2014,
Denmark’s corporate tax rate will decrease one percentage point per year
through 2016 when it will stop at 22%. It is likely that FMC will funnel income
through this subsidiary to achieve a lower effective tax rate. Thus, FMC’s tax
rate is projected to decrease linearly from 25.5% to 23.2% by 2020.
Recommendation
At current price of $56.50, valuation multiples suggest that FMC is currently
trading at a premium in comparison to its competitors. FMC has transitioned its
focus to the agrochemical industry, which is likely to be negatively impacted by
increased competition, stricter regulations, rising energy costs, and unfavorable
climatic conditions. Thus, I recommend a sell for all three equity portfolios.
Valuation Method Implied Price Weighting
Discounted Cash Flows Analysis 55.48 60%
Comparable Analysis 54.08 40%
Final Implied Price $54.92
Current Price 56.50
Overvalued (2.79%)
Final Price Target
$0
$50
$100
$150
$200
$250
$300
$350
$400
$450
$500
2015E 2016E 2017E 2018E 2019E 2020E 2021E 2022E 2023E
R&D Capital Expenditures
Figure 35: Research and Development vs.
Capital Expenditures 2015 - 2023
Source: UOIG Spreads
Figure 36: Tax Rate Sensitivity Table
Source: UOIG Spreads
ImpliedPrice Undervalued/(Overvalued)
Terminal Growth Rate Terminal Growth Rate
55 2.0% 2.5% 3.0% 3.5% 4.0%
19.20% 49.12 51.85 55.05 58.86 63.48
21.20% 49.30 52.04 55.27 59.11 63.77
23.20% 49.47 52.24 55.48 59.36 64.06
25.20% 49.65 52.43 55.70 59.61 64.34
27.20% 49.83 52.63 55.92 59.86 64.64
TaxRate