Solving for the equation for disruption to the U.S. electric power industry
poster_Work_Injuries
1. Attribute-Based Analysis of Fatal and Nonfatal Incidents
Among Electrical Contractors
Andrew Cockerill, Pouya Gholizadeh, Brett Keim, Roland Signon
University of Nebraska - Omaha
Fatal Non FatalFatal Non FatalFatal Non FatalFatal Non FatalFatal Non Fatal
0.00
0.25
0.50
0.75
1.00
0.00 0.25 0.50 0.75 1.00
Degree Proportion
ProjectProportion
Alteration Demolition Maintenance New Project Other
Fatal Non FatalFatal Non FatalFatal Non FatalFatal Non FatalFatal Non FatalFatal Non Fatal
0.00
0.25
0.50
0.75
1.00
0.00 0.25 0.50 0.75 1.00
Degree Proportion
EndUseProportion
Commercial building Dwelling Non commercial building Other Plant Roads
Fatal Non FatalFatal Non FatalFatal Non FatalFatal Non FatalFatal Non FatalFatal Non Fatal
0.00
0.25
0.50
0.75
1.00
0.00 0.25 0.50 0.75 1.00
Degree Proportion
AttributeProportion
Caught Electrocution Fall Multiple Other Struck
2009 2010 2011 2012
0
10
20
30
40
50
0
10
20
30
40
50
Over50KUnder50K
Non Fatal Fatal Non Fatal Fatal Non Fatal Fatal Non Fatal Fatal
Degree
Occurrence
Amputation
Asphyxia
Bruise/Contus/Abras
Burn/Scald(Heat)
Concussion
Fracture
Heat Exhaustion
Other
Shock
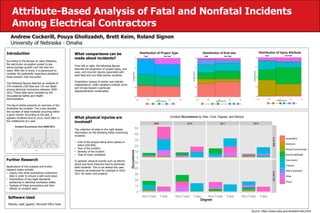
Distribution of Project Type Distribution of End Use Distribution of Injury Attribute
Incident Occurrence by Year, Cost, Degree, and Nature
What comparisons can be
made about incidents?
From left to right, the following figures
describe the proportion of project types, end
uses, and incurred injuries associated with
both fatal and non fatal worker incidents.
Proportions (areas) of similar size indicate
independence, while variations indicate some
sort of bias toward a particular
degree/attribute combination.
Introduction
According to the Bureau of Labor Statistics,
the electrician occupation poised to see
above average growth over the next ten
years. With this in mind, it is paramount to
consider the potentially hazardous situations
these workers may encounter.
The following figures describe an analysis of
276 incidents (100 fatal and 176 non fatal)
among electrical contractors between 2009-
2012. These data were compiled by the
Occupational Safety and Health
Administration.
The figure below presents an overview of the
timeframe we consider. The y-axis denotes
the number of total incidents occurring within
a given month. According to the plot, it
appears incidents tend to occur more often in
the middle/end of a year.
0
5
10
15
20
2009 2010 2011 2012
Date
Occurrence
Incident Occurrence from 2009-2012
Further Research
Applications of this analysis and further
research topics include:
• Inquiry into what precautions contractors
take in order to ensure a safe work place.
• Examination of any legal standards
pertaining to electrical workplace safety
• Analysis of these precautions and their
effects on incident rates
Software Used
RStudio, sqldf, ggplot2, Microsoft Office Suite
What physical injuries are
involved?
The collection of plots to the right display
information on the following fields concerning
incidents:
• Cost of the project being done (above or
below $50,000)
• Year of the incident
• Severity of the incident
• Type of injury sustained
In general, physical injuries such as electric
shock and bone fractures tend to dominate
fatal incidents. This is not always the case
however, as evidenced for example in 2010-
2011 for lower cost projects.
Source: https://www.osha.gov/oshstats/index.html