1. Lower Extremity Kinematic Differences Between Genders at Various Treadmill Running Speeds
Brendan Donohue SPT, John Galbreath SPT, Emily Germain SPT, Matthew Hutzel SPT, Christopher Young SPT, Alain Zurmuhlen SPT, Rumit Kakar PT, PhD
Ithaca College Physical Therapy Department
<your name>
<your organization>
Email:
Website:
Phone:
Contact
1.
2.
3.
4.
5.
6.
7.
8.
9.
10.
References
• Running is a common and accessible form of aerobic exercise. Incidence
of lower extremity injuries range from 19.4% to 79.3% within 0-18 months
of general training and recreational running.1
• Females runners are twice as likely to sustain running injuries; such as
patellofemoral pain syndrome (PFPS), iliotibial band friction syndrome
(ITBS), and tibial stress fractures as compared to males.2,3
• Female anatomical structure may be a predisposing intrinsic factor in
developing specific running injuries secondary to increased hip adduction,
hip internal rotation, and genu valgus when compared to males.2
• Changes in running speeds may further predispose to injury as increasing
speed alters lower extremity kinematics in the sagittal plane.4
Introduction
Purpose
• 4 male (Mean: 23.9yrs ± 0.9yrs) and 5 female (Mean: 24.0yrs ± 0.6yrs)
self reported healthy and physically active college aged participants.
• Standard anthropometric data was obtained for males and females
respectively (height 1.8 ± 0.1m, 1.7 ± 0.1m; weight 78.5 ± 8.3kg, 71.7 ±
11.4kg) including leg lengths, leg dominance, ankle and knee width.
• Location of 22 Retro-reflective markers (Figure 1) were collected using 7
camera Vicon® Motion capture System during self selected jogging (2.0-
2.7m/s) and running (2.8-4.0m/s) pace. Data was collected for 15 seconds
for both conditions.
Methods and Materials
• Intra-gender analysis showed results similar to those reported in the
literature, and is consistent with the concept that lower extremity
kinematics change as the movement task, such as running speed, is
altered.4
• Results showed females’ lower extremity kinematics changed including
differences in knee flexion and extension.
This increased knee flexion may increase eccentric loads on the
quadriceps group contributing towards abnormal patellar tracking
and compression forces, a known factor in PFPS.5
• Increased sagittal plane peak joint angles indicate greater knee ROM
which may be a predisposing factor in ITBS, as increased friction between
the femur and iliotibial band is noted at 20-30° of knee flexion.6 Females
with ITBS demonstrate increased knee flexion when compared to healthy
controls.6
• Research has found inter-gender differences in peak joint angles and
velocities in gait mechanics; however our study did not find any significant
differences.2,3
• Limitations of our study include a small sample size, and self-selected
running pace.
Discussion
• Although there were no inter-gender differences, intra-gender running
mechanic differences exist when comparing different treadmill speeds,
potentially predisposing females to various running related injuries such as
PFPS and ITBS.
• Inter-gender running mechanic differences do not exist when comparing
different treadmill speeds.
• Future studies should look to further investigate gender differences in risk
for running injury and screen for more potential factors.
Conclusions
• Due to possible predisposing anatomical and kinematic differences
between genders that may lead to lower extremity injuries, we investigated
intra- and inter-gender differences in lower extremity joint mechanics and
angular velocity during stance phase of treadmill jogging and running.
Figure 1. Marker Model
Results
• Nexus 1.8.5® software was used to collect and output kinematic data for 5
cycles of jogging and running respectively. Outcome variables during
stance phase included peak joint angles and joint angular velocity at the
hip and knee in the frontal, sagittal, and transverse planes of motion were
calculated using the kinematic data.
• Statistical Tests: One-way ANOVA (p < 0.05) were performed to compare
the variables between groups, gender (male vs female) and running
speed (jog vs natural). Bonferroni corrections were not done due to the
low sample size of the study.
Data Analysis
1. Van Gent RN, et al., Incidence and determinants of lower extremity
running injuries in long distance runners: a systematic review. Br J Sports
Med. 2007;41(8):469-80.
2. Ferber R, et al., Gender differences in lower extremity mechanics during
running. Clin Biomech. 2003;18(4):350-7.
3. Phinyomark A, et al., Gender and age-related differences in bilateral
lower extremity mechanics during treadmill running. PLoS One.
2014;9(8).
4. Maurer C, et al., Discrimination of gender-, speed-, and shoe-dependent
movement patterns in runners using full-body kinematics. Gait Posture.
2012;36(1):40-5.
5. Levangie PK, et al., Joint Structure and Function. 5th rev. ed.
Philadelphia, PA. F.A Davis Company. 2011. 434-561
6. Phinyomark A, et al., Gender differences in gait kinematics in runners with
iliotibial band syndrome. Scand J Med Sci Sports. 2015.
doi;10.1111/sms.12394
References
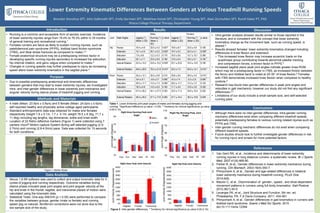
Males Females
Joint Peak Angles Jogging (°)
(Mean ± SD)
Running (°)
(Mean ±
SD)
p-value Jogging (°)
(Mean ± SD)
Running (°)
(Mean ± SD)
p-value
Hip Flexion 16.4 ± 4.6 22.5 ± 4.3 0.007* 19.9 ± 8.7 22.6 ± 4.8 0.190
Extension 15.1 ± 4.5 20.1 ± 5.2 0.030* 19.7 ± 5.2 24.3 ± 5.1 0.028*
Abduction 7.8 ± 8.6 12.2 ± 9.3 0.170 16.9 ± 9.6 15.7 ± 10.1 0.390
Adduction 20.1 ± 7.1 23.9 ± 8.9 0.180 12.9 ± 9.4 18.4 ± 9.1 0.100
Ŧ
Internal Rotation 22.5 ± 14.2 24.6 ± 15.2 0.039* 23.7 ± 22.6 16.4 ± 14.0 0.190
External Rotation 48.6 ± 28.9 79.3 ± 21.9 0.015* 53.5 ± 7.2 64.6 ± 12.1 0.019 *
Knee Flexion 25.5 ± 12.1 30.0 ± 9.8 0.210 29.8 ± 9.6 36.9 ± 3.0 0.019 *
Extension -8.4 ± 9.1 -3.6 ± 2.7 0.090
Ŧ
-6.2 ± 7.4 -3.3 ± 2.5 0.090
Ŧ
Abduction 20.0 ± 11.7 13.3 ± 7.3 0.099
Ŧ
20.0 ± 11.7 13.3 ± 7.3 0.130
Adduction 18.0 ± 6.8 14.5 ± 6.5 0.160 11.7 ± 4.6 10.9 ± 3.8 0.330
Internal Rotation 47.4 ± 36.2 40.1 ± 27.3 0.320 32.0 ± 11.3 34.8 ± 16.4 0.320
External Rotation 30.5 ± 26.2 27.7 ± 17.6 0.400 27.7 ± 14.4 39.3 ± 10.8 0.028
-10
490
990
1490
1990
2490
2990
3490
3990
4490
Right Knee Peak Joint Velocity
-10
490
990
1490
1990
2490
2990
3490
3990
4490
Right Hip Running Peak Joint
Velocity
Flex Ext Abd Add IR ER
Sagittal Frontal Transverse
Males
Females
JointAngle(Degrees)JointVelocity(Degrees/second)
JointVelocity(Degrees/second)
Figure 2. Inter-gender differences. Ŧ Tendency for clinical significance (p-value 0.05-0.10).
Ŧ
-10
490
990
1490
1990
2490
2990
3490
3990
4490
Right Hip Peak Joint Velocity
-10
490
990
1490
1990
2490
2990
3490
3990
4490
Right Knee Peak Joint Velocity
Sagittal Frontal Transverse
-10
10
30
50
70
90
Right Knee Running Peak Joint
Angle
JointAngle(Degrees)
-10
10
30
50
70
90
110
Right Hip Running Peak Joint
Angle
Flex Ext Abd Add IR ER
Table 1. Lower Extremity joint peak angles of males and females during jogging and
running. *Significant difference (p-value < 0.05). Ŧ Tendency for clinical significance (p-value
0.05-0.10).