1. 1
Demonstration Test Catchments
Newsletter - Winter 2015/16
Welcome to the Winter 2015/16 edition of the DTC Newsletter highlighting some aspects of the
research, recent key activities, events and information on related projects with links for you to
follow up on more detailed information about individual items and topics of interest.
If we knew what we were doing it would not be called research, would it?
– Albert Einstein
Storm Desmond Causes Devastating Floods in River Eden Catchment
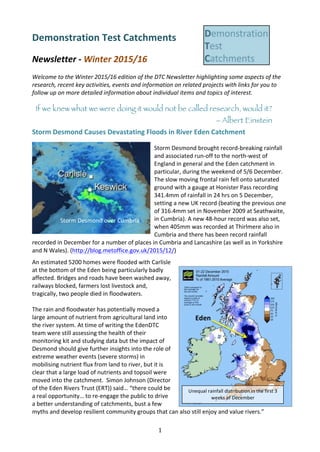
• Storm Desmond brought record-breaking rainfall
and associated run-off to the north-west of
England in general and the Eden catchment in
particular, during the weekend of 5/6 December.
The slow moving frontal rain fell onto saturated
ground with a gauge at Honister Pass recording
341.4mm of rainfall in 24 hrs on 5 December,
setting a new UK record (beating the previous one
of 316.4mm set in November 2009 at Seathwaite,
in Cumbria). A new 48-hour record was also set,
when 405mm was recorded at Thirlmere also in
Cumbria and there has been record rainfall
recorded in December for a number of places in Cumbria and Lancashire (as well as in Yorkshire
and N Wales). (http://blog.metoffice.gov.uk/2015/12/)
An estimated 5200 homes were flooded with Carlisle
at the bottom of the Eden being particularly badly
affected. Bridges and roads have been washed away,
railways blocked, farmers lost livestock and,
tragically, two people died in floodwaters.
The rain and floodwater has potentially moved a
large amount of nutrient from agricultural land into
the river system. At time of writing the EdenDTC
team were still assessing the health of their
monitoring kit and studying data but the impact of
Desmond should give further insights into the role of
extreme weather events (severe storms) in
mobilising nutrient flux from land to river, but it is
clear that a large load of nutrients and topsoil were
moved into the catchment. Simon Johnson (Director
of the Eden Rivers Trust (ERT)) said… “there could be
a real opportunity… to re-engage the public to drive
a better understanding of catchments, bust a few
myths and develop resilient community groups that can also still enjoy and value rivers.”
Storm Desmond over Cumbria
Unequal rainfall distribution in the first 3
weeks of December
Eden
3. 3
• the greatest nitrate-N and TP fluxes occurred only when the shallow groundwater level
was within 0.6 m of the ground surface and runoff coefficients were greater than 0.1;
• the wet winter 2013 resulted in elevated shallow groundwater levels which led to more
frequent activation of sub-surface pathways and tile drain flows;
• across the three years, dry antecedent conditions had a temporary effect in elevating TP
loads;
• evidence of TP source exhaustion after consecutive storm events was detected and can
be attributed to the repeated depletion of temporarily connected critical source areas to
the river network via impermeable road surfaces;
• finally, and most importantly, fertiliser application varied considerably (up to 41%) across
the three years due to differences in crop rotation between farms. However,
proportional reductions in annual riverine nitrate-N and TP loadings were not observed at
the sub-catchment outlet. Nitrate loadings were slightly higher during fertiliser
application, but there was little relationship between P fertiliser application and riverine
TP load. These results indicate that this intensive arable catchment may be in a state of
‘biogeochemical stationarity’, whereby legacy stores of nutrients are buffering the
stream against annual changes in fertiliser nutrient inputs.
Further details on this research can be found in a recently published article in Science of the Total
Environment: Outram FN, Cooper RJ, Sünnenberg G, Hiscock KM, Lovett AA. 2015. Antecedent
conditions, hydrological connectivity and anthropogenic inputs: Factors affecting nitrate and
phosphorus transfers to agricultural headwater streams. Science of the Total Environment.
DOI: 10.1016/j.scitotenv.2015.12.025.
Contact: Richard Cooper (richard.j.cooper@uea.ac.uk)
DTC Data and the Data Archive
The Demonstration Test Catchment Archive Project finished at the end of January 2015. The
outcome of the project was the Agricultural and Environmental Data Archive (AEDA), which has
been online for nearly a year and can be accessed at www.environmentdata.org.
Various users have been adding data since that time, not only from the DTC consortia and the
Defra Agricultural Greenhouse Gas Platform, but also from the Freshwater Biological Association
who built and house the archive, and other contributors such as Syngenta, the Environment
Agency and The Atlantic Salmon Trust. There are also some new contributors from the Defra
Sustainable Intensification Platform and some historical Greenhouse Gas data.
Adding data to the archive is only the first step in making it available to the public. Once the data
has been added in the proper format it can be published. Publication involves submitting the
data for a series of automated checks by the archive software and also human review by the
archive staff. If all is well it will be published and made available to the public, a Digital Object
Identifier (DOI) is created for the dataset and it becomes a scholarly work which can be cited in
scientific publications. You can see examples of some published DTC data at:
http://www.environmentdata.org/clist/dtcwensum.
In the eleven months since the archive was made available several improvements have been
made that should make it easier for people to add data to the archive. The DOI creation
functionality has been added and the quality of the published data in the archive has been
enhanced by making it possible to achieve certification from the Open Data Institute (ODI). More
5. 5
Conclusions
• The real-time cameras provided useful contextual information to both the field team and
to website users;
• The events captured by the cameras have supported presentations on the project;
• The quality and level of maintenance required for the cameras meant that they were on
trial for part of the project;
• Future projects could consider installing new versions of this technology if the quality can
be improved and maintenance required can be reduced.
Monitoring Cattle with Cameras – Exploring the temporal dynamics between cattle in-stream
presence and suspended solids in a headwater catchment
Cattle in-stream activity is potentially an important contributor to water pollution from
agriculture. In order to address the uncertainty about the extent to which cattle impact on
sediment transfer processes within the fluvial channel, a comparison of high-resolution
monitoring data of cattle activity within the streambed against high-resolution water quality data
collected over a period of several months was conducted. Bushnell Trophy XLT 119455 motion
sensor cameras, with infrared night-vision LEDs, were used to capture in-stream activity of cattle,
with a time-delay of 10 seconds between each shutter response triggered by the motion sensors.
in an unfenced reach over a four-month period. Results were compared against high-resolution
SSC data.
Over the days that cattle grazed the field, 58% of the instances when suspended solids
concentrations (SSC) crossed the 25 mg l-1
Freshwater Fish Directive guideline threshold can be
attributed to cattle presence in the stream. Flow was the main driver of total sediments
transported over the study period, and no relationship was found between SSC and the absolute
number of cattle feet in the water. Hysteresis analysis indicated a ‘first-flush’ of local sediments
rapidly mobilised during the non-cattle related SSC events, a result of cattle proximity to channel
margins. Results demonstrate a temporal lag between cattle in-stream presence and a critical
amount of their contribution to sediment load, and that monitoring only instantaneously with
cattle activity may lead to underestimation of their pollution impact.
The work highlights that cattle have an observable impact on water pollution, although a
temporal lag between cattle in-stream presence and a critical amount of their contribution to
sediment load was demonstrated. This study helps demonstrate the loss of environmental
information that can result from low resolution monitoring programmes, and is available in full at
http://pubs.rsc.org/en/content/articlepdf/2014/em/c3em00686g?page=search.
Monitoring changes in diffuse pollution source risk with time-lapse photography
There are many factors within the landscape that can affect diffuse pollution source risks, which
vary over the year. Examples include snow cover dynamics driving overland flow not directly
connected to precipitation on that day, and changes in solar receipt resulting from cloud cover
and land cover changes ensuing from agricultural practices. An approach that was trialled within
the first phase of DTC was the use of a time-lapse camera to create a visual record on the
landscape, which could then be processed to give a continuous record of such factors. It is hoped
that this extra information may provide useful context and background information for the
interpretation of the in-stream monitoring data.
7. 7
Initial Results
Fig 4 shows the initial results for the 2014 calendar year for the clear skies and snowiness indices,
with example images (Fig 5). These initial results are based on the midday images from each day.
From the results, it can be seen that the snowiness index correctly identify days with snow cover
when the index value exceeds 0.87. There is a strong seasonal trend in the snowiness index
12/02/14
Clear Skies: 0.67
Snowiness: 0.96
12/05/14
Clear Skies: 0.82
Snowiness: 0.69
26/08/14
Clear Skies: 0.82
Snowiness: 0.53
12/12/14
Clear Skies: 0.79
Snowiness: 0.96
values with the lowest values in the summer. The ‘blue skies’ index shows the high level of cloud
cover through the year, with relatively few days being cloud free (8.5% of days have an index
value greater than 0.75). The example image in Fig 5 from 12/05/14 shows issues with
condensation within the waterproof housing of the camera install.
This condensation reduces the image quality for fine detail, but it is still possible to extract
information on the sky status. Fig 6 shows the changes over time for the daily differences when
compared to the previous day and to the mean image.
The results in Fig 6 show that the difference based indices are capable of identifying the days of
the year were the landscape or climate differ from the ‘normal’ conditions. The approach
successfully identified the increased snow cover in February 2014, the occurrence of a change in
the weather conditions from cloud to clear skies in April 2014 and the reverse in August, and
finally the occurrence of snowfall in December 2014.
Figure 4: Changes in the clear skies and snowiness index over the 2014 calendar year
Figure 5: Changes in the clear skies and snowiness index over the 2014 calendar year
8. 8
11/02/14
14/04/14
09/08/14
11/12/14
12/02/14
From Previous: 35.3
From Average: 59.3
15/04/14
From Previous: 44.6
From Average: 46.2
10/08/14
From Previous: 32.7
From Average: 30.8
12/12/14
From Previous: 52.4
From Average: 14.8
Figure 6: Changes over time for daily differences when compared to the previous day and to the mean image
Conclusions
• Time-lapse photography of a catchment and landscape has the capability to add
significant contextual information to complement and support the in-stream water
chemistry datasets;
• The approach generates significant amounts of data, and hence tools are needed to
identify the important times and associated images;
• The presented indices are capable of identifying properties of the environment such as
cloud cover or snow accumulation/melt;
• It is possible to identify the timing of large changes in the landscape, either compared to
the previous day or to the annual average conditions.
Use of Unmanned Aerial Vehicles (UAVs) for Diffuse Pollution Understanding
Part of the original conceptual model of the generation of diffuse pollution within the landscape
was that a key part of the process was driven by interaction of the rainfall intensity and the