More Related Content
Similar to BN_ORS2014 (20)
BN_ORS2014
- 1. TEMPLATE DESIGN © 2008
www.PosterPresentations.com
Effects of HIV Infection and Azidothymidine (AZT)
on Mechanical Properties of Bone in Mice
Naples, Blair1; Wang, Jason L.2,3; Hansen, Laura4; Sutliff, Roy2,3; Gleason, Rudolph2,3; Guldberg, Robert E.2,3
ResultsIntroduction
Methods
Conclusions
VertebraDistal
Metaphysis
Distal
Epiphysis
Middiaphysis
HIV+ HIV- AZT Water
Figure 2: Structural Properties of Femur. * p < 0.05 compared to
HIV+ group. Error bars = SEM.
• Animals: Male HIV-1 transgenic mice (n=10, HIV+; n=10,
HIV-) of FVB/N background were obtained from Dr. Roy
Sutliff. Male FVB/N mice receiving either water or AZT (100
mg/kg/day) via oral gavage for 35 days (n=10, water; n=10,
AZT) were obtained from Dr. Rudy Gleason. All mice were
euthanized at approximately 10 weeks of age.
• MicroCT: The right femur and L6 vertebra were harvested
from each animal, wrapped in saline soaked gauze and stored
at -20ºC. Each was scanned using micro-computed
tomography (microCT, µCT-40 system, Scanco Medical). The
middle portion of the vertebra was scanned, while the femur
was scanned at the middiaphysis and distal locations. Using
built-in software, a 1 mm section of the middiaphysis was
evaluated for cortical bone morphology (bone area, BA; bone
marrow area, MA; and cortical thickness, Ct.Th). The distal
femur was evaluated at the metaphysis and epiphysis using a
1 mm section measured from the growth plate, and the
vertebra was evaluated at the middle 2.4mm portion for
trabecular microarchitecture (trabecular number, Tb.N;
trabecular thickness, Tb.Th; trabecular spacing, Tb.Sp;
structure model index, SMI; weight-normalized bone volume
fraction, nBV/TV; and connectivity density, Conn.D).
• Mechanical Testing: Femurs were tested to failure using 3-
point bending at a rate of 1 mm/min. Vertebra were cut to
2mm ensuring ends were parallel, then tested to failure using
compression at a rate of 1mm/min. Structural properties
(ultimate load and stiffness) were calculated directly from the
load-displacement curve. Derived material properties (Young’s
modulus and ultimate stress) were calculated from the load-
displacement data using standard equations
• Statistical Analysis: MicroCT parameters and mechanical
properties were compared between groups using one-way
ANOVA followed by Tukey’s post hoc tests or the Kruskal-
Wallis test followed by Dunn’s post hoc tests with significance
set at α = 0.05 (GraphPad Version 5).
• HIV positive individuals on highly active antiretroviral
therapy (HAART) are at greater risk of experiencing age-
related co-morbidities, such as osteoporosis, earlier in their
life than HIV negative individuals.
• Clinical data has also shown that HIV positive, treatment-
naïve patients experience increased loss of bone mass and
lower bone density when compared to the uninfected
population.
• It is difficult to determine whether HAART administration
plays a role in this bone loss independent of HIV infection.
Azidothymidine (AZT), a low cost component of HAART, is
widely used in the developing world where HIV infection is
most prominent and has been shown to increase
osteoclastogenesis and decrease BMD in C57BL/6 mice.1
• The objective of this study was to determine whether there
are distinct effects on the morphology and mechanical
properties of bone due to AZT independent of HIV infection.
Figure 3: Material Properties of Femur. Error bars = SEM.
Table 1. Micro CT parameters. Mean ± SEM
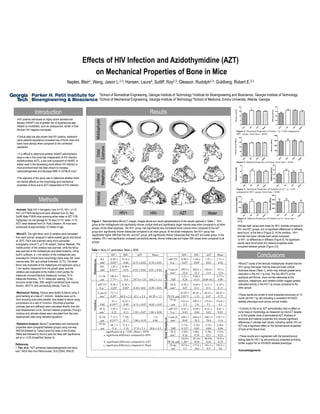
Figure 1. Representative MicroCT images. Images above are visual representations of the results captured in Table 1. HIV+
group at the middiaphysis had significantly thinner cortical shell and significantly larger marrow area when compared to all other
groups. At the distal epiphysis, the HIV+ group had significantly less normalized bone volume when compared to the AZT
group and significantly thinner trabeculae compared to all other groups. At the distal metaphysis, the HIV+ group had
significantly higher SMI than the HIV- and AZT group, with significantly thinner trabeculae than the AZT and water group. In the
vertebra, HIV+ had significantly increased connectivity density, thinner trabeculae and higher SMI values when compared to all
groups.
• MicroCT scans of the femoral middiaphysis showed that the
HIV+ group had larger marrow area and lower cortical
thickness values (Table 1), which may indicate greater bone
resorption in the HIV-1 tg mice. The low nBV/TV at the
epiphysis and thinner, more rod-like trabeculae at the
epiphysis, metaphysis, and vertebra further suggest greater
osteoclast activity in the HIV-1 tg mouse compared to the
other groups.
• These results are similar to work presented previously on 12
month old HIV-1 tg rats indicating a consistent HIV/AIDS
skeletal phenotype even across animal models.
• Contrary to Pan et al, AZT administration had no effect on
bone mass or morphology as measured via microCT despite
a 10-fold greater dose of administered AZT. Analysis of
structural and material properties only showed significant
differences in ultimate load values, indicating neither HIV nor
AZT has a significant effect on the biomechanical properties
of bone at the tissue level.
• These results are in agreement with the biomechanical
testing data for HIV-1 tg rats previously presented providing
further support for an HIV/AIDS skeletal phenotype.
1School of Biomedical Engineering, Georgia Institute of Technology 2Institute for Bioengineering and Bioscience, Georgia Institute of Technology
3School of Mechanical Engineering, Georgia Institute of Technology 4School of Medicine, Emory University; Atlanta, Georgia
Acknowledgements
References
1. Pan, et al. "AZT enhances osteoclastogenesis and bone
loss." AIDS Res Hum Retroviruses. 20.6 (2004): 608-20.
Middiaphysis
HIV+ HIV- AZT Water
DistalEpiphysis
HIV+ HIV- AZT Water
BA,
mm2
0.58 ±
0.03a,b
0.74 ±
0.04 0.73 ± 0.02 0.70 ± 0.01
nBV/TV,
% g -1
0.99 ±
0.07b
1.04 ±
0.03b
1.25 ±
0.03
1.13 ±
0.05
MA,
mm2
1.03 ±
0.03a,b,c
0.90 ±
0.03 0.93 ± 0.02 0.91 ± 0.02 Conn.D,
mm-3
398.9 ±
25.6
364.6 ±
13.3
342.6 ±
13.9
353 ±
15.8
Ct.Th,
µm
140.4 ±
7.7a,b,c
194.0 ±
9.4 187.4 ± 5.0 184.2 ± 3.1 SMI
1.23 ±
0.26
0.66 ±
0.14 0.69 ±0.1
0.77 ±
0.09
Vertebra
nBV/TV,
% g -1
0.36 ±
0.02b
0.36 ±
0.02b 0.45± 0.02 0.39 ± 0.01
Tb.N,
mm-1
6.58 ±
0.07
6.60 ±
0.11
6.31 ±
0.11
6.39 ±
0.15
Conn.D,
mm-3
73.7 ±
8.0a,b,c 44.0 ± 2.3 42.1 ± 2.4 44.59 ± 1.5 Tb.Th, µm
41.02 ± 49.41 ±
1.33
49.53 ±
0.47
48.97 ±
0.722.02a,b,c
SMI
.91 ±
0.19a,b,c
-0.25 ±
0.09 -0.13 ± 0.07 -0.05 ± 0.07
Tb.Sp,
152.4 ±
2.2
149.5 ±
3.0
155.0 ±
3.1
154.4 ±
4.5µm
Tb.N,
mm-1
1.92 ±
0.23
1.62 ±
0.11 1.85 ± 0.07 1.80 ± 0.09
DistalMetaphysis
nBV/TV,
% g -1
0.43 ±
0.03
0.49 ±
0.04
0.52 ±
0.03
0.47 ±
0.03
Tb.Th, 7.12 ±
0.25a,b,c
7.79±
0.17 7.80 ± 0.10
7.5±
0.06
Conn.D,
mm-3
150.2 ±
26.0a
244.6 ±
24.2
186.2 ±
24.0
174.7 ±
15.6µm
Tb.Sp, 64.7 ±
11.6
71.8 ±
5.10 57.9 ± 2.1 58.6 ± 4.3 SMI
2.72±
0.12a,b
2.32±
0.05
2.37±
0.08
2.42±
0.06µm
significance at p < 0.05; Mean ± SEM Tb.N, 5.45±
0.16
5.86± .
0.34
5.28±
0.17
5.23±
0.12a, significant difference compared to HIV- mm-1
b, significant difference compared to AZT Tb.Th, µm
34.85±
1.36b,c
40.16±
0.94
40.04±
0.42
39.91±
0.53
c, significant difference compared to Water Tb.Sp, 187.0 ±
5.3
177.6 ±
10.6
193.3 ±
6.9
195.5 ±
4.6µm
*
Figure 4 : Structural Properties of Vertebra (n=5). * p < 0.05
compared to HIV+ group. Error bars = SEM.
Figure 5: Material Properties of Vertebra (n=5). Error bars =
SEM.
Ultimate load values were lower for HIV+ animals compared to
HIV- and AZT groups, but no significant differences in stiffness
were found at the femur (Figure 2). At the vertebra, HIV+
animals had lower ultimate load values compared
to HIV-; no differences in stiffness (Figure 4). No significant
results were found when the material properties were
compared between groups (Figure 3,5).