

Recommended
More Related Content
What's hot
What's hot (14)
Viewers also liked
Viewers also liked (7)
Similar to Company Analysis Example_AAA Road Materials
Similar to Company Analysis Example_AAA Road Materials (20)
Recently uploaded
Recently uploaded (20)
Company Analysis Example_AAA Road Materials
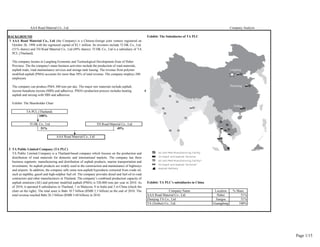
- 1. AAA Road Material Co., Ltd Company Analysis BACKGROUND Exhibit: The Subsidaries of TA PLC 1 4 Exhibit: The Shareholder Chart 100% 51% 49% 2 Exhibit: TA PLC's subsidiaries in China Location % Share AAA Road Material Co., Ltd. Hebei 51% Zhenjing TA Co., Ltd. Jiangsu 51% TA (Xinhui) Co., Ltd. Guangdong 100% TA Public Limited Company (TA PLC) TA Public Limited Company is a Thailand-based company which focuses on the production and distribution of road materials for domestic and international markets. The company has three business segments: manufacturing and distribution of asphalt products, marine transportation and investments. Its asphalt products are widely used in the construction and maintenance of highways and airports. In addition, the company sells some non-asphalt byproducts extracted from crude oil, such as naphtha, gasoil and high-sulphur fuel oil. The company provides diesel and fuel oil to road contractors and other manufacturers in Thailand. The company’s combined production capacity of asphalt emulsion (AE) and polymer modified asphalt (PMA) is 520,800 tons per year in 2010. As of 2010, it operated 8 subsidiaries in Thailand, 1 in Malaysia, 8 in India and 3 in China (check the chart on the right). The total asset is Baht 10.7 billion (RMB 2.3 billion) as the end of 2010. The total revenue reached Babt 26.3 billion (RMB 5.68 billion) in 2010. Company Name AAA Road Material Co., Ltd (the Company) is a Chinese-foreign joint venture registered on October 26, 1998 with the registered capital of $2.1 million. Its investors include TI HK Co., Ltd. (51% shares) and TH Road Material Co., Ltd (49% shares). TI HK Co., Ltd is a subsidiary of TA PCL (Thailand). TA PCL (Thailand). TI HK Co., Ltd TH Road Material Co., Ltd AAA Road Material Co., Ltd The company can produce PMA 300 tons per day. The major raw materials include asphalt, styrene butadiene styrene (SBS) and adhesives. PMA's production process includes heating asphalt and mixing with SBS and adhesives. The company locates in Langfang Economic and Technological Development Zone of Hebei Province. The the company's main business activities include the production of road materials, asphalt trade, road maintainance services and storage tank leasing. The revenue from polymer modified asphalt (PMA) accounts for more than 50% of total revenue. The company employs 280 employees. Langfang Zhenjiang Xinhui Page 1/15
- 2. AAA Road Material Co., Ltd Company Analysis BACKGROUND 5 Products Product I - Polymer Modified Asphalt (PMA) ASSESMENT SECTION 1 Related Banks Unit: '000 RMB 16,000 16,000 2 Guarantors 3 Management Team Product II - Asphalt Concrete (AC) 4 Market/Clients Payment Term The company manufactures polymer modified asphalt (PMA) and resells asphalt concrete (AC). Asphalt Concrete is a major raw material in the production of PMA. Tonghua Road Material Co., Ltd The company was established in 1998 with registered capital of RMB 17.25M. It is an investment holding company owned by Hebei Traffic Bureau (a government agency), which supervises the road construction and maintainance in Hebei Province. O/S as at April-30-2011 Bank Beijing Capital Highway Development Group Co., Ltd (BCHD), established in 1999, is a state- owned enterprise owned by Beijing's government. The company is responsible for highway construction, maintenance, management and financing in Beijing area. As of 2008, its assets was 66 billion Yuan. The total length of highway under its management is 638 km. TT/1-2 months20-30%Hebei Tonghua Road Material Co., Ltd. As a major share holder, Hebei Tonghua Road Material Co., Ltd is also a large client. It purchases finished modified asphalt from the comapnay and resells them to other clients through its own sales network. Limit Security Prepayment or COD 30% BBL's Thai headquarters will issue the SBLC of RMB 10M with 100% credit coverage. Bank of China Langfang Branch LUR and fixed assets Asphalt Concrete (AC): Asphalt concrete is a composite material commonly used in constructions, such as road surfaces, airports and parking lots. It is a by-product from the refining of crude oil and base lubricating oil. It consists of asphalt (used as a binder) and mineral materials. Others The process of making Polymer Modified Asphalt (PMA) include heating asphalt concrete to decrease its viscosity, and then mixing with some additives such as Styrene Butadiene Styrene (SBS) at 166 °C. The advantage of PMA over Asphalt Concrete is modifed asphalt is more stable in extreme temperatures. By comparision, unmodified asphalt will become brittle and crack in cold temperatures and it will be soften in high temperatures, causing rutting and surface deformation. PMA is more elastic and durable with greater temperature stability. Therefore, PMA is more widely used in road constructions. Mr. Huang Xiang (General Manager) has worked in Tipco for 10 years. Prior to joining Tipco, Mr. Huang had studied and worked in Thailand for 6 years. He has a Master Degree from Asian Institute of Technology (AIT) in Thailand. Client Name 40% Prepayment or COD Mr. Yang Tianxiang (Chief Finance Manger) joined TIPCO in 2010. Prior to joining Tipco, Mr. Yang had worked in ICBC for more than 10 years. Beijing Capital Highway Development Group Co., Ltd. % of Total Sales Page 2/15
- 3. AAA Road Material Co., Ltd Company Analysis 5 Products (Continue) Additive - Styrene Butadiene Styrene (SBS) Exhibit: Seasonal sales Exhibit: The Production Procedure of PMA 6 Suppliers Exhibit: Subject's ASP and Sales Volume (2008 - 2010) 2008 2009 2010 6,625 7,106 11,554 Exhibit: Subject's Suppliers and Payment Term 4,740 3,885 4,618 31,405,870 27,605,315 53,354,301 1,837 2,399 9,434 3,510 2,965 3,902 6,448,697 7,112,493 36,807,436 37,854,567 34,717,808 90,161,737Total Revenue ('000 RMB) Local agencies Supplier % of total purchase 60%Revenue of PMA ASP (RMB/Ton) PMA Revenue of AC SBS is a synthetic rubber copolymer consisting of styrene and butadiene. It is usually mixed with asphalt concrete in order to improve abrasion resistance and aging stability of asphalt concrete. PMA's production procedure is simple: heat Asphalt Concrete while mixing with additives. The production procedure takes about 8 hours. Then, the semi-products is stored in the storage tanks for fermentation for 48 hours. The production line is advanced and automatic. The plant operates 2 shifts per day and 8-hour for one shift. Each shift requires 2 workers, so only 4 workers work in the production line. AC 40% Volume (Ton) ASP (RMB/Ton) Volume (Ton) The production of asphalt is seasonal. According to Chinese government’s regulation rule, the required temperature of road constructions is above 10℃. Road constructing are prohibited in rainy days. The road construction is prohibited when the outdoor temperature is below 0℃ in the North China. Since the asphalt is difficult to be stored beyond 6 months, the company manufactures PMA 2 or 3 months before receiving orders. Therefore, the company does not product asphalt in winters due to the lack of orders. Raw materials used in the production include Asphalt Concrete (75%), SBS (10%) and other adhesives (15%). About 60% raw materials are imported from TIPCO's headquarters in Thailand and the rest 40% is purchased from local agencies which imported raw material from South Korea. The payment term with TIPCO HO is 60 to 90 days. The procurement price from the headquarters is higher that from the local agencies which require COD. When the company's liquidity is tight, it prefers to import from TIPCO HO; otherwise, it perfers to purchase from the local agencies which charge lower prices and deliver more sufficiently. The following table shows the list of suppliers and payment terms. TIPCO HO (Thailand) Payment Term TT (USD)/ 2-3 months COD (RMB) Product 0 20,000 40,000 60,000 80,000 100,000 120,000 140,000 160,000 180,000 2006 2007 2008 2009 2010 Sales (Q1-Q3) Sales (Q4) 000' RMB Page 3/15
- 4. AAA Road Material Co., Ltd Company Analysis 7 Plant Visit c Entry Barriers There are technology barrier and capital barrier in the modified asphalt manufacturing industry. 1) The technology barrier 1. Storage tanks: 2 tanks with storage capacity of 3,000 tons, 2 tanks of 500 tons and other small tanks. 2. A warehouse for storing SBS and other chemicals. 3. A production line. 2) The barrier of capital and financing ability. 8 Industry Analysis d The demand projection a Characters of asphalt manufacturing industry: 1) The economic region of sales 2) Seasonality Exhibit: China's Total Lengh of Highway b The Competitor of the industry Source: China National Statistical Bureau The modified asphalt producers can be divided into 3 categories, the first one is large MNCs such as Shell, SK Group and Tipco Group. The second category is local professional producers, such as Jiangsu Baoli Co. Ltd, Luxiang Co., Ltd and China Best Modified Bitumen. The third group is large Chinese petrochemical enterprises, such as Petrochina and Sinopec. As of 2008, Chinese companies have taken more than 50% domestic market share of modified asphalt. The formula is a key business secret for the competition. The formula varies in different road condition and natural environment. Therefore, in order to find a formula, the newcomers have to spend many years through huge investment and hundreds of experiments. A good formula brings good product quality and lower manufacturing costs. The cash cycle of asphalt producers is long since they need to purchase the raw material earlier before a boom season by 2 or 3 months and get the payment 3 to 6 months later after the delivery of products. This character requires the producers to obtain sufficient working capital and strong financing ability. The most important demand for modified asphalt is from highway construction and maintenance. The annual consumption of modified asphalt is positively correlated to the total length of exiting highway and the incremental length of highway each year. Therefore, it is reasonable to predict the total consumption of modified asphalt by estimating the annual incremental length of highway. From 2005 to 2009, China’s consumption of modified asphalt has grown from 1.25M tons per year to 2.75M tons per year with ACGR of 17.08%. During the same period, the total length of highway increased from 41,000 km to 65,000 km with ACGR of 12.25%. According to the China's 12th Five-year-plan, Chinese government plans to increase the length of highway to 100,000 km by 2015, which means the ACGR of length of high will be 6.17% from 2011 to 2015 (see the chart below). On April 14, 2011, the investigation team visited the client and discussed with the general manager Mr. Huang and Mr. Yang. The company is located in Langfang Economic and Technological Development Zone, Hebei Province and covers an area of 13,332 sq.m. (20 Mu). The production facilities include: The first use of modified asphalt in road construction in China dates back to 1992 when it is used in the construction of Beijing's Airport Highway. Since then, the modified asphalt has been used widely in the construction of highways, airports and buildings. As the boom of highway construction took place in China in 2000s, the production of modified asphalt experienced an explosive increase. From 2005 to 2009, China’s consumption of modified asphalt has grown from 125 tons per year to 275 tons per year with an ACGR of 17.08% . As to other building materials such as cement, the sale of asphalt is restricted by transport distance. The economic transport distance is within 800 km. If the transport distance is beyond this range, asphalt is needed to be heated and mixed again, which increases the production costs. Therefore, the asphalt sales is a regional business. The production of asphalt is seasonal. According to Chinese government’s regulation rule, the required temperature of road constructions is above 10℃ and road constructions are prohibited in a rainy day. Since the asphalt is difficult to be stored beyond 6 months, the asphalt producers, normally, prefer to manufacture 2 or 3 months before receiving orders. Most producers stop asphalt production in winter due to the lack of orders. 0 20,000 40,000 60,000 80,000 100,000 120,000 2005 2006 2007 2008 2009 2010 2011E 2012E 2013E 2014E 2015E 2005 - 2009 ACGR = 12.25% 2011 - 2015 ACGR = 6.17% Km Page 4/15
- 5. AAA Road Material Co., Ltd Company Analysis 8 Industry Analysis (Continue) 9 Financial Analysis 1. Profitability Exhibit: The total length of highway and annual consumption of modified asphalt is positive correlated Exhibit: China's annual consumption of modified asphalt Exhibit: The Gross Profit Margin of PMA is higher than AC's margin According to the regression model linked existing length of highway and annual consumption of modified asphalt from 2005 to 2009, an increase of 410 km highway resulted in an increase of annual consumption of modified asphalt by 232,500 tons. Assuming this relation maintains and the increase of length of highway is in line with the 12th Five-year-plan, the annual consumption of modified asphalt will increase from 2011’s 3.52M tons to 2015’s 4.73M tons with ACGR of 7.72% (see the chart below). Note: the X-axis is the annual consumption of modified asphalt during 2005 to 2009, assuming the amount in 2005 is 100. The Y-axis represents China’s total length of highway, assuming 2005’s length is 100. From 2006 to 2010, the sales value is highly volatile with ACGR of 27.6%. The sales surged in 2007 due to the explosive increase of resale on AC (see the breakdown of sales). Hit by the global economy recession, the sales value slumped by 78.9% in 2008 and turned to stable in 2009. Driven by the recovery of global economy and the impact of Chinese government’s economic stimulate package, the sales value surged by 162.9% in 2010. Despite so, 2010’s sales turnover is only half of the sales peak in 2007. Prior to 2008, AC had contributed a significant proportion of net profits. Since 2008, subject has reduced the resale of AC and focused on the production of PMA which generated a higher gross profit margin. As a result, PMA has contributed most net profit since 2008. 0 50,000 100,000 150,000 200,000 2006 2007 2008 2009 2010 Sales Breakdown AC PMA 0 5,000 10,000 2007 2008 2009 2010 Gross Profit Breakdown AC PMA 0 50,000 100,000 150,000 200,000 2006 2007 2008 2009 2010 Annual Sales -2,000 0 2,000 4,000 6,000 2006 2007 2008 2009 2010 Net Profit 0 500 1,000 1,500 2,000 2,500 3,000 3,500 4,000 4,500 5,000 2005 2006 2007 2008 2009 2010E 2011E 2012E 2013E 2014E 2015E 2005 - 2009 ACGR = 17.08% 2010 - 2015 ACGR = 7.72% 000' RMB 000' RMB 000' RMB 000' RMB 000' Ton 0.00% 5.00% 10.00% 15.00% 20.00% 25.00% 2007 2008 2009 2010 PMA AC Consumption of Modified Asphalt Total length of highway 2006 - 2010 ACGR = 27.6% Page 5/15
- 6. AAA Road Material Co., Ltd Company Analysis 9 Financial Analysis (Continue) Exhibit: Key liquidity indicators DuPont Analysis 2006 2007 2008 2009 2010 11.70% 2.40% -4.90% 2.30% 3.60% 0.59 3.83 1.24 0.99 3.17 2.59 1.7 1.2 1.4 1 17.88% 15.63% -7.29% 3.19% 11.41% Exhibit: Receivables drive the liquidity condition 2006 2007 2008 2009 2010 22,872,639 12,041,484 5,008,138 8,285,360 346,833 62.90% 7.00% 13.90% 22.90% 0.30% 46.80% 41.40% 31.30% 34.80% 1.90% 1.31 1.61 3.33 2.32 15.15 3. Cash Flow Analysis 2. Liquidity Exhibit: Subject's CFO and CFF is unstable 2006 2007 2008 2009 2010 Current Ratio 1.31 1.61 3.33 2.32 15.15 0.89 1.06 1.56 1.65 11.01 0.1 0.14 0.5 0.33 8.92 Subject’s cash flow is unstable due to the volatility of account receivables and payables. When the period of receivables gets longer or payment period of payables gets shorter, subject has to borrow short-term loan in order to maintain business, as a result, the CFO is negative correlation with CFF (see the chart below). If the past pattern of cash flow was maintained, the availability of short-term loan would determine the sustainability of business in future. In the scenario when banks tight theirs credit, subject would face the trouble of insufficient cash flow, resulting in a decline of sales value or liquidity problems. As can be seem in the chart on the right, receivables had taken a significant proportion of current assets from 2006 – 2009. Furthermore, the receivable-sale-ratio is negative correlated to current ratio. In other words, if receivable took a bigger proportion of current assets, subject’s liquidity would be tight. Normally, clients’ term of payment vary from 3 months to 6 months, sometime, it takes a longer period. Subject’s liquidity largely depends on the condition of collection of receivables. Receivables (RMB) Receivables/Sales Receivables/CA Current Ratio Subject’s current ratio has been greater than one and the quick ratio has been increasing during the past 5 years, which means subject’s liquidity is good in general. Especially, the liquidity was improved significantly in 2010, resulting from the decline of receivables (see the table on the right). The volatility of account receivables is the most important factor driving the change of liquidity. Quick Ratio Cash Ratio Subject’s ROE appears to be highly volatile during the past 5 years. ROE is highly correlated with net profit margin which is sensitive to the volatility of costs of raw materials. Assets turnover is in a weakly correlation with ROE. For example, in 2007, the assets turnover surged but the ROE declined, and in 2009, the assets turnover declined slightly but the ROE increased. Subject’s financial leverage has declining since 2006, except for the year of 2009. It’s an indicator of improved liquidity. Net Profit Margin Asset Turnover Financial Leverage ROE 0.00 1.00 2.00 3.00 4.00 5.00 2006 2007 2008 2009 2010 Assets Turnover Financial Leverage -10.00% -5.00% 0.00% 5.00% 10.00% 15.00% 20.00% 2006 2007 2008 2009 2010 Net Profit Margin ROE 0 2 4 6 8 10 12 14 16 2006 2007 2008 2009 2010 Current Ratio Quick Ratio Cash Ratio -10,000 -5,000 0 5,000 10,000 15,000 20,000 2006 2007 2008 2009 2010 CFO CFF RMB Page 6/15
- 7. AAA Road Material Co., Ltd Company Analysis 9 Financial Analysis (Continue) 2) Working Capital 4. Solvency 2006 2007 2008 2009 2010 2006 2007 2008 2009 2010 1.59 0.7 0.2 0.4 0.04 Current Ratio 1.31 1.61 3.33 2.32 15.15 2.59 1.7 1.2 1.4 1.04 Quick Ratio 0.89 1.06 1.56 1.65 11.01 0 104.20% 44.40% 82.50% 0 Cash Ratio 0.1 0.14 0.5 0.33 8.92 97.20% 54.30% 19.70% 10.00% 39.80% *The Payables include Account Payables and Other Payables. 3) Third-party guarantee 5. Earning Quality 10 Financial Projection 2006 2007 2008 2009 2010 55,208,807 41,966,980 26,924,831 32,219,169 19,124,787 1) Average Selling Price (ASP) Unit: RMB/Ton 36,664,862 10,435,064 -117,626 1,887,628 1,196,950 Product 2009(A) 2010(A) 2011(F) 2012(F) 2013(F) 2014(F) 18,543,945 31,531,916 27,042,457 30,331,541 17,927,837 PMA 3,885 4,618 5,200 5,460 5,740 6,030 15.22% 51.87% 15.33% 11.47% 51.40% AC 2,965 3,902 4,200 4,410 4,630 4,860 6. Capacity to repay 2) Sales Volume 1) Cash flow Product 2009(A) 2010(A) 2011(F) 2012(F) 2013(F) 2014(F) PMA 7,106 11,554 15,000 15,900 16,900 18,000 AC 2,399 9,432 9,432 9,432 9,432 9,432 Utilization% 6.49% 10.55% 13.70% 14.52% 15.43% 16.44% * The utilization include only PMA. The capacity of PMA is 300 ton per day. 2008(A) 2009(A) 2010(A) 246,999 397,773 612,220 2,470,629 -2,704,053 15,232,885 10 -6.8 24.88 -445,960 1,988,479 3,382,941 4,882,375 10,387,628 1,196,951 -0.09 0.19 2.83 * Fund from Operation = Net Income + Depreciation + Amortization 3) COGS takes 91% of sales turnover. Subject is able to pass the extra increased cost of raw materials to downstream companies. 4) Days Receivable = 45 days, Days Inventory = 20 days, Days Payable = 1 days. 5) No CAPEX. 6) Interest rate of STL = 7.02% (prime*1.2).No long-term liabilities. 7) The minimum cash balance is RMB 3,000,000. 8) Average depreciation period of fixed assets = 8 years. 9) No dividend payout. Subject’s D/E ratio has been in a declining trend during the past 5 years, from 2006’s 1.59x to 2010’s 0.04x. Subject has no long-term liability, the decline of D/E ratio results from the reduction of proportion of payables and short-term liabilities. In addition, the short-term loan appears highly volatile. D/E Ratio A/E STL/CL Payables /CL* Net Operating Assets Accruals Ratio The firm’s working capital is an important source of liquidity which can be used for the repayment of debt. Subject’s current ratio has been greater than one and quick ratio has been increasing during the past 5 years, which means the liquidity is good in general. Especially, the liquidity was improved significantly in 2010, resulting from the decline of receivables. The SBLC to be issued by BBL HO will guarantee subject’s capacity to repay. Thus, the risk exposure taken by BBC Beijing Branch is minimal. The key assumptions of the financial projection (2011 – 2014) are as below: Subject’s accruals ratio appears highly volatile due to the high volatile of net operating assets (NOA), especially in the year of 2007 and 2010. This condition suggests that subject’s sustainability of earning is low. Operating Assets Operating Liabilities The primary resource for repayment of debt is cash flow. Hence, an analysis of operating cash flows is critical to understand the subject's capacity to repay. Subject’s cash flow ratios fluctuated widely in 2008 and 2009. In 2009, the firm’s CFO wasn’t enough to cover its interest expense due to the increase of receivables (the receivable- sales-ratio increased from 2008’s 13.9% to 2009’s 22.9%). In 2010, subject’s CFO increased significantly as a result of the decline of receivables (the receivable-sales-ratio reduced to 0.3%). In conclusion, the amount of receivables influences weather subject could generate sufficient CFO to repay its liability. Funds from Operation/Total Debt* Interest Expense CFO CFO/Interest Expense Funds from Operation Total Debt Page 7/15
- 8. AAA Road Material Co., Ltd Company Analysis 10 Financial Projection (Continue) Exhibit: Subject's Receivable Days in the past Exhibit: Summary of Financial Projection (Base Case) 2009 (A) 2010 (A) 2011 (F) 2012(F) 2013(F) 2014(F) 35,514,251 92,864,251 97,831,466 102,723,039 107,859,191 113,252,150 -1.49% 161.48% 5.35% 5.00% 5.00% 5.00% 816,447 3,364,691 1,196,667 1,360,303 1,537,825 1,710,385 2.30% 3.62% 1.22% 1.32% 1.43% 1.51% 3,461,849 10,730,245 3,000,000 3,000,000 3,000,000 3,000,000 6,794,207 5,418,989 16,202,499 17,012,624 17,814,448 18,705,171 23,836,273 18,564,047 44,053,169 46,002,427 47,931,714 50,074,900 35,681,018 29,855,032 54,190,624 55,105,543 56,104,783 57,409,178 10,387,628 1,196,951 25,462,046 25,016,663 24,478,078 24,072,088 10,387,628 1,196,951 25,462,046 25,016,663 24,478,078 24,072,088 25,293,390 28,658,081 28,728,577 30,088,880 31,626,705 33,337,090 2.29 15.51 1.73 1.84 1.96 2.08 0.41 0.04 0.89 0.83 0.77 0.72 3.23% 11.74% 4.17% 4.52% 4.86% 5.13% 11 Sensitivity analysis 1) CFO/CFF to Receivable Days 2) CFO/CFF to COGS Cash Flow 2011(F) 2012(F) 2013(F) 2014(F) Unit: RMB CFO -3,207,331 2,833,825 3,110,450 3,372,768 COGS/Sales Cash Flow 2011(F) 2012(F) 2013(F) 2014(F) CFF 0 0 0 0 91% CFO -9,130,046 2,161,612 2,353,795 2,492,391 CFO -9,130,046 2,161,612 2,353,795 2,492,391 CFF 1,199,801 -2,325,972 0 0 CFF 1,199,801 -2,325,972 0 0 92% CFO -10,026,243 1,171,890 1,337,967 1,370,999 CFO -15,252,653 1,113,751 1,300,492 1,399,585 CFF 2,095,998 -1,371,890 -1,537,967 -312,312 CFF 7,322,408 -1,313,751 -1,500,492 -1,599,585 93% CFO -10,922,439 180,188 178,118 87,856 CFO -21,375,261 63,909 103,168 5,120 CFF 2,992,194 -380,188 -378,118 -287,856 CFF 13,445,016 -263,909 -303,168 -205,120 94% CFO -11,818,636 -811,515 -981,731 -1,265,241 CFF 3,888,391 611,515 781,731 1,065,241 95% CFO -12,714,833 -1,803,217 -2,141,580 -2,618,337 CFF 4,784,588 1,603,217 1,941,580 2,418,337 As shown in the chart above, from 2007 to 2010, subject’s Receivable Days varies from 1.36 days to 85.15 days and the average is 40.72 days. According to the sensitivity analysis, even in the worst scenario that Receivable Days is 85 days, subject’s liquidity is still good. So, the liquidity risk caused by the uncertain Receivables Days is minimal unless some worse conditions happen together, for example, sales drop, price hikes of raw materials and delay of receivables take place at the same time. Let’s discuss this topic in the scenario analysis. The price hike of raw material effects liquidity and profitability. When the COGS-Sales ratio goes up, subject will generate less operating cash flow and consequently obtain less working capital to repay its short-term loan. Holding other assumptions unchanged, change the COGS-Sales ratio as below: As shown in the table above, when the COGS-Sales ratio is less than 94%, subject’s liquidity is good and need only short-term financing in 2011. When the COGS-Sales ratio is greater than 94%, the CFO will keep negative from 2011 to 2014. As a result, subject will have to keep borrowing in order to finance the negative CFO. In this situation, the availability of financing resource would determine whether subject is able to continue business. Equity Current Ratio 25 45 65 85 Receivables Days is key a factor determining liquidity. According to subject’s historical performance, the Receivable Days fluctuated widely. If the Receivables Days is relative short, subject’s liquidity would be good and the liquidity risk would be low. Holding other assumptions unchanged, change the Receivable Days as below: Unit: RMB Sales Turnover Sales Growth Rate Net Profit Net Profit Margin Cash Equivalent Inventory Current Assets Total Assets Total Current Liability Total Liability Receivable Days D/E Ratio ROE As can be seem in the table above, when the Receivables Days is 25 days, subject’s liquidity is very good, and doesn’t need any short-term loan. When the Receivables Days is from 45 days (base scenario) to 85 days, subject’s liquidity is good, and just need short-term loan in 2011. The amount of short-term loan in need increases as the Receivable Days increases. 0 20 40 60 80 100 2007 2008 2009 2010 Receivables Days Average Receivables Days Page 8/15
- 9. AAA Road Material Co., Ltd Company Analysis 11 Sensitivity analysis 12 Scenario Analysis Exhibit: Subject's COGS/Sales Ratio Scenario COGS/Sales *Please check Page 12 to see the Financial Projection of the Base Case The Summary of Financial Projection (Worse Case) Unit: RMB 2010 (A) 2011 (F) 2012(F) 2013(F) 2014(F) Sales Turnover 92,864,251 105,854,600 118,122,480 132,292,890 148,403,790 3) CFO/CFF to Sales Sales Growth Rate 161.48% 13.99% 11.59% 12.00% 12.18% Net Profit 3,364,691 485,559 696,968 937,713 1,179,552 Net Profit Margin 3.62% 0.46% 0.59% 0.71% 0.79% Cash Equivalent 10,730,245 3,000,000 3,000,000 3,000,000 3,000,000 Inventory 5,418,989 5,394,234 6,019,392 6,723,081 7,541,832 Unit: RMB Current Assets 18,564,047 35,113,306 38,595,367 42,514,840 47,075,193 Total Assets 29,855,032 45,250,761 47,698,483 50,687,909 54,409,472 Total Current Liability 1,196,951 17,233,292 18,984,046 21,035,760 23,577,770 27% CFO -10,381,240 -292,800 -336,335 -564,447 Total Liability 1,196,951 17,233,292 18,984,046 21,035,760 23,577,770 27% CFF 2,450,995 92,800 136,335 364,447 Equity 28,658,081 28,017,469 28,714,437 29,652,150 30,831,702 12% CFO -8,426,644 2,017,796 2,263,695 2,426,996 Current Ratio 15.51 2.04 2.03 2.02 2.00 12% CFF 496,400 -1,622,571 0 0 D/E Ratio 0.04 0.62 0.66 0.71 0.76 5% CFO -7,514,500 2,815,796 2,968,754 3,036,432 ROE 11.74% 1.73% 2.43% 3.16% 3.83% 5% CFF -415,745 -710,426 0 0 -5% CFO -6,242,638 3,745,939 3,585,045 3,362,208 The complete financial projection is the Appendix III -5% CFF -1,126,171 0 0 0 As shown in the table above, as the sales growth rate rise, subject’s liquidity worsens. But, the gap of working capital is not big. For example, if subject kept the growth rate of 27% (ACGR from 2005 to 2010) for the next 4 years, the company would borrow RMB 2.4M in 2011, and then, the annual new borrowing would decline. It isn’t difficult to finance such gap of working capital given subject’s good credibility. 93% 12% 12% 5% 2014(F)Sales Growth rate for 2010 to 2014 2011(F) 2012(F) 2013(F) 20 As shown in the chart above, from 2007 to 2010, subject’s COGS/Sales ratio varies from 79.2% to 94.6% and the average is 87.3%. In 2010, the ratio is 90.8%, above the average level. According to the sensitivity analysis, if the COGS/Sales ratio broken 94%, subject would has to face the liquidity problem and the liquidity risk would increase as the increase of the ratio. Luckily, there is still a margin between the current COGS/Sales ratio to the breakpoint. The margin can buffer the impact of the price hikes of raw materials. Given cash cycle and profit margin unchanged, the increase of sales growth rate would reduce working capital as the increased receivables and inventory would occupy more cash. As a result, subject’s liquidity would be tighter and the possibility of liquidity risk would rise. Holding other assumptions unchanged, change the sales growth rate as below: 65 45 85 85 20 Remark Sales Growth Rate Receivable Days Inventory Days Normal expected sales growth rate Normal expected prices hike of raw materials. Normal risk of delay of receivables. Base Case* Worse Case Worst Case 91% 93% Lower expected sales growth rate. Higher expected prices hike of raw materials. Higher risk of delay of receivables. Higher expected prices hike of raw materials. Higher risk of delay of receivables. 70.00% 75.00% 80.00% 85.00% 90.00% 95.00% 100.00% 2007 2008 2009 2010 COGS/Sales Average COGS/Sales Page 9/15
- 10. AAA Road Material Co., Ltd Company Analysis 12 Scenario Analysis (Continue) The Summary of Financial Projection (Worst Case) Unit: RMB 2010 (A) 2011 (F) 2012(F) 2013(F) 2014(F) Sales Turnover 92,864,251 97,831,466 102,723,039 107,859,191 113,252,150 2) Customers are over-concentrated Sales Growth Rate 161.48% 5.35% 5.00% 5.00% 5.00% Net Profit 3,364,691 (171,214) (58,155) 71,153 185,526 Net Profit Margin 3.62% -0.18% -0.06% 0.07% 0.16% Cash Equivalent 10,730,245 3,000,000 3,000,000 3,000,000 3,000,000 Inventory 5,418,989 16,202,499 17,012,624 17,814,448 18,705,171 Current Assets 18,564,047 44,053,169 46,002,427 47,931,714 50,074,900 Total Assets 29,855,032 54,190,624 55,105,543 56,104,783 57,409,178 Total Current Liability 1,196,951 26,829,928 27,803,003 28,731,090 29,849,959 Total Liability 1,196,951 26,829,928 27,803,003 28,731,090 29,849,959 Equity 28,658,081 27,360,696 27,302,541 27,373,694 27,559,219 Current Ratio 15.51 1.64 1.65 1.67 1.68 D/E Ratio 0.04 0.98 1.02 1.05 1.08 ROE 11.74% -0.63% -0.21% 0.26% 0.67% The complete financial projection is in the Appendix IV 3) Risk of Price Hikes of Raw Materials 15 Future plan 14 Competitiveness 4) Risk of Labor Cost 15 Risks/Risk mitigating factors 1) Liquidity Risk The most important raw material is Asphalt Concrete which is extracted from crude oil. The price of Asphalt Concrete is positive correlated to the price of crude oil. Driven by the price hike of crude oil during the past 3 years, the COGS/sales ratio increased from 2008’s 79.2% to 2009’s 84.5% and then to 2010’s 90.8%. The recent fluctuation of oil price made the price of Asphalt Concrete fluctuated widely. As a result, it has become more challenging to manage the costs of raw materials. Mitigating factors : subject imports 60% raw materials from its parent company which operates Asphalt Concrete refinery factory in Malaysia in order to reduce the cost of raw materials for manufacturing. Therefore, as compared to other competitors, subject is more likely to withstand the fluctuation of oil price. Driven by the inflation expectation and labor shortage, China’s labor costs have been rising during the past years. Any further rise of labor costs will squeeze subject’s profits in future. Mitigating factors : As a capital-intensive industry, asphalt production industry uses a high proportion of capital and a low proportion of labors. Currently, there are 28 employees in the company and 4 out of the 28 employees are workers. Labors costs account for a tiny proportion of total costs. Therefore, the impact of rising labor costs will be limited. Mitigating factors : as a subsidiary of TIPCO in China, subject has strong finance support from the parent company. If subject face a liquidity problem, subject is very likely to get additional liquidity from the parent company through shareholder loan or capital injection. The sales from the two largest clients account for 50% - 60% of total sales value. If such large clients reduced or terminated cooperation with subject, the company would face a negative impact on its sales. Mitigating factors : subject has cooperated with such big clients for many years, the relationship among them is solid and stable. It’s unlikely that such big clients terminate cooperation suddenly without any pre-notice. In addition, subject’s shareholder, Hebei Tonghua Road Material Co., Ltd, is an enterprise owned by Hebei Traffic Bureau (government agency) which is in charge the construction and maintaining of roads in Hebei Province. Any construction of highways in the Province must be approved by the bureau before starting. If the existing large clients reduced purchasing due to the impact of economic recession or change of government’s policy, subject was capable of developing new clients backed by its solid relationship with the bureau. Subject is focusing on the expansion of market share. Since the utilization rate of capacity is low, subject has no plan of expansion of production capacity in the coming years. Strength: A wealth of experience in asphalt manufacturing, strong R&D capacity and high quality of products. Weakness: The range of products is narrow. Price is higher than local producers. As to other asphalt producers, subject normally purchases raw materials 2 to 3 months earlier before a boom season. Subject purchase 60% raw materials from its parent company in Thailand with a payment term of 2-3 months. The rest 40% raw materials are purchased from local agencies with COD payment. On the other hand, although most clients are required to pay within 2 months according to the sales contracts, due to strong barging power held by the clients, sometimes, they paid 6 months later after the delivery of goods. If such condition happend in future, subject had to face the risk of insufficient liquidity. If the liquidity was dried up and there was no available financing resources, subject would loss the capability of maintaining daily operations. The entry of new competitors. Change of Chinese government’s policy. Price hikes of raw materials. Opportunities: China’s fast growth of asphalt consumption. Threat: Page 10/15
- 11. AAA Road Material Co., Ltd Company Analysis 16 Business prospects 17 Other information a b Environmental protection issue c Working capital in need based on the financial projection of 2011 Days 45 20 1 64 Modified asphalts are widely used in the construction of highway, airport and buildings. The most important factor which drives the consumption of modified asphalt is construction and maintenance of highway. According to the 12th Five-year-plan, Chinese government plans to increase the length of highway to 100,000 km by 2015. Holding the advantage of R&D and high product quality, subject is able to capture the opportunity of the fast growth of Chinese market. In order to support the fast growth, subject is likely to apply a higher credit limit in future. In addition, subject agreed to save RMB deposit in BBC at the end of 2011. The amount of deposit depends on subject’s cash balance at that time. Subject's credit record has been good as per PBOC's Bank Credit Consulting System. No default record was shown and loan card status is valid. (Loan card No: Since the production process and industrial emissions of subject is in compliance with the local environmental protection requirements, the subject has sewage permit granted by the local government. Amount (RMB) 18,560,807 105,854,600 13,050,567 Annual Sales in 2011 Average Receivable Days Average Inventory Days Average Payable Days 5,800,252 290,013 Working Capital in need in 2011 Page 11/15
- 12. Appendix I: Financial Statement AAA Road Material Co., Ltd Financial Ratios Profit and Loss Statement Balance Sheet 2010(A) 2009(A) 2008(A) 2010(A) % 2009(A) % 2008(A) % 2010(A) % 2009(A) %2008(A) GROWTH (%) Net Sales [4] 92,864,251 100 35,514,251 100 36,051,732 100.0 CURRENT ASSETS Less Cost of Sales 84,287,451 90.8 30,016,539 84.5 28,539,837 79.2 Cash & banks 10,730,245 35.9 3,461,849 9.7 Sales 161.48% -1.49% -78.93% Gross Profit 8,576,801 9.2 5,497,712 15.5 7,511,896 20.8 Notes & accounts receivable (trade) 346,834 1.2 8,285,360 23.2 Net Profit Growth 312.11% 145.99% -142.76% Other receivable 67,980 0.2 5,067,216 14.2 Operating Expenses 4,114,626 4.4 3,110,310 8.8 7,047,515 19.5 Inventory [1] 5,418,989 18.2 6,794,207 19.0 LIQUIDITY Depreciation & Amort. Exp. [5] 18,250 0.0 1,172,032 3.3 1,329,483 3.7 Prepayments 2,000,000 6.7 216,762 0.6 Operating Income (Loss) 4,443,925 4.8 1,215,370 3.4 (865,102) -2.4 Other current assets 0 0.0 10,879 0.0 Current Ratio 15.51 2.29 3.29 Total Current Assets 18,564,047 62.2 23,836,273 66.8 Days Inventory 23.47 82.62 109.82 Non-Operating Income 23,092 0.0 122,953 0.3 4,617 0.0 Days Receivable 1.36 85.15 50.70 Non-Operating Expenses 59,035 0.1 124,103 0.3 5,505 0.0 Long-Term Investment 0 0.0 0 0.0 Days Payable 0.19 0.01 0.01 Profit Before Interest and Tax 4,407,982 4.7 1,214,220 3.4 (865,991) -2.4 Property, Plant & Equip. Cash Cycle 24.64 167.77 160.52 Costs [2] 19,403,446 65.0 19,840,641 55.6 Less Interest Expenses 612,220 0.7 397,773 1.1 246,999 0.7 Less accumulated depreciation 11,775,204 39.4 11,756,955 33.0 PROFITABILITY (%) Income Tax 431,071 0.5 0 0.0 662,454 1.8 Net Value 7,628,241 25.6 8,083,686 22.7 Due From Related Co. 0 0.0 0 0.0 Gross profit margin 9.24 15.48 20.84 Profit before Extraordinary Items 3,364,691 3.6 816,447 2.3 (1,775,443) -4.9 Other Assets [3] 3,662,744 12.3 3,761,059 10.5 Net Profit Margin 3.62 2.30 (4.92) Extraordinary Items 0 0 0 0 0 0.0 Return on Assets 11.27 2.29 (6.05) TOTAL ASSETS............................................29,855,032 100.0 35,681,018 100.0 Return on Equity 11.74 3.23 (0.07) Net Profit 3,364,691 3.6 816,447 2.3 (1,775,443) -4.9 CURRENT LIABILITIES SOLVENCY (Times) Dividend Payout 0 0 0 Short-term loans 0 0.0 8,500,000 23.8 Notes & accounts payable (trade) 43,900 0.1 450 0.0 Leverage (D/E) 0.04 0.41 0.20 * The financial reports were audited by Langfang Yihua Certified Public Accountants Co., Ltd. Accrued expenses 608,194 2.0 256,264 0.7 Interest Coverage 7.20 3.05 -3.51 Current L/T Liabilities 0 0.0 0 0.0 Other current liabilities 544,857 1.8 1,630,915 4.6 DIVIDEND PAYMENT Total current Liabilities 1,196,951 4.0 10,387,628 29.1 Dividend Payout Ratio 0.0% 0.0% 0.0% Long-Term Liabilities 0 0.0 0 0.0 Due To Related Co. 0 0.0 0 0.0 Other Liabilities 0 0.0 0 0.0 TOTAL LIABILITIES…………………………….1,196,951 4.0 10,387,628 29.1 SHARE HOLDERS' EQUITIES Capital 17,396,371 58.3 17,396,371 48.8 Exchange rate gain (loss) 0 0.0 0 0.0 Capital reserve 0 0.0 0 0.0 Legal reserve 0 0.0 0 0.0 Surplus reserve 1,126,171 0.0 0 0.0 Retained Earnings (deficits) 10,135,539 33.9 7,897,019 22.1 Total Shareholders' Equities 28,658,081 96.0 25,293,390 70.9 TOTAL LIABILITIES & SHAREHOLDERS' EQUITIES......... 29,855,032 100.0 35,681,018 100.0 Page 12/15
- 13. (Unit : RMB) 2008(A) 2010(A) 2009(A) 2008(A) Net Income 3,364,691 816,447 (1,775,443) Add : Depreciation/Amortization 18,250 1,172,032 1,329,483 Change in Trade & Other Receivable 12,937,762 (8,281,739) 10,049,424 Change in Inventories 1,375,219 1,792,936 1,816,492 Change in Prepayments (1,783,238) (216,762) 10,082 Change in Trade Payable 43,450 0 (8,440,932) Change in Other Current Assets 10,879 7,781 1,593,282 Change in Oth. Cur. Lia., Accu. Exp, Tax Payable (734,127) 2,005,254 (2,111,758) ----------------------------------------------------------------------- ------------------- ------------------- ------------------- NET CASH FROM OPERATING ACTIVITIES 15,232,885 (2,704,053) 2,470,629 ----------------------------------------------------------------------- ------------------- ------------------- ------------------- CASH FLOW FROM INVESTING ACTIVITIES Change in Property, Plant and Equipment 437,195 35,550 47,522 Change in Short Term Investment 0 0 0 Change in Long Term Investment 0 0 0 Change in S-T Loan to Related Companies 0 0 0 Change in L-T Loan to Related Companies 0 0 0 Change in Receivables & Loans to Directors 0 0 0 Change in Intangible Assets 0 0 0 Change in Other Long Term Assets 98,315 195,865 195,865 ----------------------------------------------------------------------- ------------------- ------------------- ------------------- NET CASH FROM INVESTING ACTIVITIES 535,511 231,415 243,387 ----------------------------------------------------------------------- ------------------- ------------------- ------------------- CASH FLOW FROM FINANCING ACTIVITIES Change in Short Term Bank Borrowing (8,500,000) 3,500,000 (3,000,000) Change in Long Term Liabilities 0 0 0 Change in Loans from Directors 0 0 0 Change in S-T Loan from Related Companies 0 0 0 Change in L-T Loan from Related Companies 0 0 0 Change in Other Long Liabilities 0 0 0 Change in Paid-up Capital 0 0 0 Change in Minority Interest/Reserve 1,126,171 0 0 Change in Premium on Share Capital 0 0 0 Adjusting to Retained Earnings (1,126,171) 36,430 41,378 ----------------------------------------------------------------------- ------------------- ------------------- ------------------- NET CASH FROM FINANCING ACTIVITIES (8,500,000) 3,536,430 (2,958,622) ----------------------------------------------------------------------- ------------------- ------------------- ------------------- NET INCREASE (DECREASE) IN CASH 7,268,396 1,063,792 (244,606) Cash on hand at the Beginning 3,461,849 2,398,058 2,642,664 Cash on hand at the Ending 10,730,245 3,461,849 2,398,058 Operating Cash Flow 0.00 TOTAL BANK DEBTS/CASH FLOW FROM OPERATING ACTIVITIES (3.14) 2.02 Page 12/15
- 14. Appendix I: Financial Statement AAA Road Material Co., Ltd Company Analysis The notes of the financial reports [1] Receivables The receivables include RMB 5,006,750 from a related company TIPCO Asphalt (Xinhui) Co., Ltd. [3] Inventory Unit: RMB 2010 2009 2008 Raw Materials 4,887,813 4,926,002 7,067,751 Finished Goods 485,974 1,824,364 1,479,304 Semi-products 45,200 43,840 40,087 Total 5,418,989 6,794,206 8,587,142 * In 2008, the reported inventory revaluation reserve was RMB 3,762,804. [4] Other Assets Unit: RMB 2010 2009 2008 3,563,482 3,755,239 3,946,996 [5] Accrued Expenses in 2008 The accrued expenses include payable tax of RMB -1,661,617 due to the loss in 2008. [6] Sales Breakdown Unit: RMB 2010 2009 2008 PMA 53,354,342 27,605,330 31,051,732 AC 36,807,476 7,112,490 4,242,173 Others* 2,702,433 796,430 757,827 Total 92,864,251 35,514,250 36,051,732 * Other income includes PMA processing, materials sale and storage leasing. [7 Depreciation The depreciation period of the production line is from 1999 – 2009 (11 years). In 2009, the production line had been depreciated completely. Therefore, 2010’s depreciation is lower than that in 2009. [2] Other Receivables in 2009 Land Use Right (LUR) The payment terms for wholesales clients and retail clients are 1-2 months and COD respectively. In 2008 and 2009, the revenue from wholesales accounted for a larger proportion of total sales, so the receivables was high as compared to 2010’s level. Page 13/15
- 15. Appendix II: Financial Projection AAA Road Material Co., Ltd (Unit : RMB) Financial Ratios Profit and Loss Statement Balance Sheet 2014 (F) 2013 (F) 2012 (F) 2011 (F) 2014 (F) % 2013 (F) % 2012 (F) % 2011 (F) % 2014 (F) % 2013 (F) % 2012 (F) % 2011 (F) % GROWTH (%) Net Sales 113,252,150 100.0 107,859,191 100.0 102,723,039 100.0 97,831,466 100.0 CURRENT ASSETS Less Cost of Sales 105,324,500 93.0 100,309,047 93.0 95,532,426 93.0 90,983,263 93.0 Cash & banks 3,000,000 5.2 3,000,000 5.3 3,000,000 5.4 3,000,000 5.5 Sales 5.00% 5.00% 5.00% 5.35% Gross Profit 7,927,651 7.0 7,550,143 7.0 7,190,613 7.0 6,848,203 7.0 Notes & accounts receivable (trade) 26,301,729 45.8 25,049,266 44.6 23,921,804 43.4 22,782,670 42.0 Net Profit Growth 11.22% 13.05% 13.67% 46.57% Other receivable 68,000 0.1 68,000 0.1 68,000 0.1 68,000 0.1 Operating Expenses 5,096,347 4.5 4,853,664 4.5 4,622,537 4.5 4,402,416 4.5 Inventory 18,705,171 32.6 17,814,448 31.8 17,012,624 30.9 16,202,499 29.9 LIQUIDITY Depreciation & Amort. Exp. 638,791 0.6 730,047 0.7 834,339 0.8 953,530 1.0 Prepayments 2,000,000 3.5 2,000,000 3.6 2,000,000 3.6 2,000,000 3.7 Operating Income (Loss) 2,192,513 1.9 1,966,433 1.8 1,733,737 1.7 1,492,257 1.5 Other current assets 0 0.0 0 0.0 0 0.0 0 0.0 Current Ratio 2.08 1.96 1.84 1.73 Total Current Assets 50,074,900 87.2 47,931,714 85.4 46,002,427 83.5 44,053,169 81.3 Days Inventory 65.00 65.00 65.00 65.00 Non-Operating Income 105,000 0.1 100,000 0.1 93,000 0.1 125,000 0.1 Days Receivable 85.00 85.00 85.00 85.00 Non-Operating Expenses 17,000 0.0 16,000 0.0 13,000 0.0 21,700 0.0 Long-Term Investment 0 0.0 0 0.0 0 0.0 0 0.0 Days Payable 1.00 1.00 1.00 1.00 Profit Before Interest and Tax 2,280,513 2.0 2,050,433 1.9 1,813,737 1.8 1,595,557 1.6 Property, Plant & Equip. Cash Cycle 149.00 149.00 149.00 149.00 Costs 19,403,446 33.8 19,403,446 34.6 19,403,446 35.2 19,403,446 35.8 Less Interest Expenses 0 0.0 0 0.0 0 0.0 0 0.0 Less accumulated depreciation 14,931,911 26.0 14,293,120 25.5 13,563,073 24.6 12,728,735 23.5 PROFITABILITY (%) Income Tax 570,128 0.5 512,608 0.5 453,434 0.4 398,889 0.4 Net Value 4,471,535 7.8 5,110,326 9.1 5,840,372 10.6 6,674,711 12.3 Due From Related Co. 0 0.0 0 0.0 0 0.0 0 0.0 Gross profit margin 7.00 7.00 7.00 7.00 Profit before Extraordinary Items 1,710,385 1.5 1,537,825 1.4 1,360,303 1.3 1,196,667 1.2 Other Assets 2,862,744 5.0 3,062,744 5.5 3,262,744 5.9 3,462,744 6.4 Net Profit Margin 1.51 1.43 1.32 1.22 Extraordinary Items 0 0.0 0 0.0 0 0.0 0 0.0 Return on Assets 2.98 2.74 2.47 2.21 TOTAL ASSETS............................................57,409,178 100.0 56,104,783 100.0 55,105,543 100.0 54,190,624 100.0 Return on Equity 5.13 4.86 4.52 4.17 Net Profit 1,710,385 1.5 1,537,825 1.4 1,360,303 1.3 1,196,667 1.2 CURRENT LIABILITIES SOLVENCY (Times) Dividend Payout 0 0 0 0 Short-term loans 23,184,317 40.4 23,604,010 42.1 24,154,930 43.8 24,612,777 45.4 Notes & accounts payable (trade) 287,772 0.5 274,068 0.5 261,733 0.5 249,269 0.5 Leverage (D/E) 0.72 0.77 0.83 0.89 Accrued expenses 600,000 1.0 600,000 1.1 600,000 1.1 600,000 1.1 Interest Coverage N/A N/A N/A #DIV/0! Current L/T Liabilities 0 0.0 0 0.0 0 0.0 0 0.0 Other current liabilities 0 0.0 0 0.0 0 0.0 0 0.0 DIVIDEND PAYMENT Total current Liabilities 24,072,088 41.9 24,478,078 43.6 25,016,663 45.4 25,462,046 47.0 Dividend Payout Ratio 0.0% 0.0% 0.0% 0.0% Long-Term Liabilities 0 0.0 0 0.0 0 0.0 0 0.0 Due To Related Co. 0 0.0 0 0.0 0 0.0 0 0.0 Other Liabilities 0 0.0 0 0.0 0 0.0 0 0.0 TOTAL LIABILITIES…………………………….24,072,088 41.9 24,478,078 43.6 25,016,663 45.4 25,462,046 47.0 SHARE HOLDERS' EQUITIES Capital 17,396,371 30.3 17,396,371 31.0 17,396,371 31.6 17,396,371 32.1 Exchange rate gain (loss) 0 0.0 0 0.0 0 0.0 0 0.0 Capital reserve 0 0.0 0 0.0 0 0.0 0 0.0 Legal reserve 0 0.0 0 0.0 0 0.0 0 0.0 Minority interest 0 0.0 0 0.0 0 0.0 0 0.0 Retained Earnings (deficits) 15,940,719 27.8 14,230,335 25.4 12,692,510 23.0 11,332,207 20.9 Total Shareholders' Equities 33,337,090 58.1 31,626,705 56.4 30,088,880 54.6 28,728,577 53.0 TOTAL LIABILITIES & SHAREHOLDERS' EQUITIES.........57,409,178 100.0 56,104,783 100.0 55,105,543 100.0 54,190,624 100.0 Page 14/15
- 16. MB) (Unit:RMB) 2014 (F) 2013 (F) 2012 (F) 2011 (F) Net Income 1,710,385 1,537,825 1,360,303 1,196,667 Add : Depreciation/Amortization 638,791 730,047 834,339 953,530 Change in Trade & Other Receivable (1,252,463) (1,127,462) (1,139,134) (22,435,857) Change in Inventories (890,722) (801,824) (810,125) (10,783,510) Change in Prepayments 0 0 0 0 Change in Trade Payable 13,703 12,336 12,463 205,369 Change in Other Current Assets 0 0 0 0 Change in Oth. Cur. Lia., Accu. Exp, Tax Payable 0 0 0 (553,051) ----------------------------------------------------------------------------------- ------------------ ------------------ ------------------ ------------------ NET CASH FROM OPERATING ACTIVITIES 219,693 350,921 257,847 (31,416,851) ----------------------------------------------------------------------------------- ------------------ ------------------ ------------------ ------------------ CASH FLOW FROM INVESTING ACTIVITIES Change in Property, Plant and Equipment 0 0 0 0 Change in Short Term Investment 0 0 0 0 Change in Long Term Investment 0 0 0 0 Change in S-T Loan to Related Companies 0 0 0 0 Change in L-T Loan to Related Companies 0 0 0 0 Change in Receivables & Loans to Directors 0 0 0 0 Change in Intangible Assets 0 0 0 0 Change in Other Long Term Assets 200,000 200,000 200,000 200,000 ----------------------------------------------------------------------------------- ------------------ ------------------ ------------------ ------------------ NET CASH FROM INVESTING ACTIVITIES 200,000 200,000 200,000 200,000 ----------------------------------------------------------------------------------- ------------------ ------------------ ------------------ ------------------ CASH FLOW FROM FINANCING ACTIVITIES Change in Short Term Bank Borrowing (419,693) (550,921) (457,847) 24,612,777 Change in Long Term Liabilities 0 0 0 0 Change in Loans from Directors 0 0 0 0 Change in S-T Loan from Related Companies 0 0 0 0 Change in L-T Loan from Related Companies 0 0 0 0 Change in Other Long Liabilities 0 0 0 0 Change in Paid-up Capital 0 0 0 0 Change in Minority Interest/Reserve 0 0 0 (1,126,171) Change in Premium on Share Capital 0 0 0 0 Adjusting to Retained Earnings 0 0 0 0 ----------------------------------------------------------------------------------- ------------------ ------------------ ------------------ ------------------ NET CASH FROM FINANCING ACTIVITIES (419,693) (550,921) (457,847) 23,486,606 ----------------------------------------------------------------------------------- ------------------ ------------------ ------------------ ------------------ NET INCREASE (DECREASE) IN CASH (0) (0) 0 (7,730,245) Cash on hand at the Beginning 3,000,000 3,000,000 3,000,000 10,730,245 Cash on hand at the Ending 3,000,000 3,000,000 3,000,000 3,000,000 Operating Cash Flow TOTAL BANK DEBTS/CASH FLOW FROM OPERATING ACTIVITIES 67.26 93.68 (0.78)105.53 Page 14/15
- 17. Appendix II: Financial Projection AAA Road Material Co., Ltd Key Assumptions Revenue 2010(A) G% 2011F G% 2012F G% 2013F G% 2014F G%G% Product A - PMA - Total Capacity Ton/Year 73,000 73,000 73,000 73,000 73,000 Utilization Rate % 15.83% 17.45% 19.20% 21.15% 23.30% - Actual Production Ton 11,556 12,739 10.23% 14,016 10.03% 15,440 10.16% 17,009 10.17% - ASP Yuan/Ton 4,618 5,200 12.60% 5,460 5.00% 5,740 5.13% 6,030 5.05% Yuan 53,365,146 66,240,200 24.13% 76,527,360 15.53% 88,622,730 15.81% 102,564,270 15.73% Product B - AC - Total Capacity Ton/Year 36,500 36,500 36,500 36,500 36,500 Utilization Rate % 25.84% 27.15% 28.50% 30.00% 31.50% - Actual Production Ton 9,432 9,432 0.00% 9,432 0.00% 9,432 0.00% 9,432 0.00% - ASP Yuan/Ton 3,902 4,200 7.64% 4,410 5.00% 4,630 4.99% 4,860 4.97% Yuan 36,802,103 39,614,400 7.64% 41,595,120 5.00% 43,670,160 4.99% 45,839,520 4.97% 5.0% Total Revenue (RMB) 90,167,249 97,831,466 8.50% 102,723,039 5.00% 107,859,191 5.00% 113,252,150 5.00% Expenses COGS/Sales % 86.0% 93.0% 93.0% 93.0% 93.0% Operating Expense/Sales % 4.5% 4.5% 4.5% 4.5% 4.5% Cash Cycle Days Receivable Day 0.7 85 85 85 85 Days Inventory Day 11.7 65 65 65 65 Days Payable Day 1.0 1 1 1 1 Cash Cycle Day 13.4 149 149 149 149 Minimum Cash Balance Yuan 3,000,000 3,000,000 3,000,000 3,000,000 CAPEX Expansion Capital Expense 0 0 0 0 Replacement Capital Expense 0 0 0 0 Total CAPEX 0 0 0 0 Fixed Assets & Depreciation Beginning Book value 19,840,641 19,403,446 19,403,446 19,403,446 19,403,446 CAPEX - - - - Ending Book value 19,403,446 19,403,446 19,403,446 19,403,446 19,403,446 Previous Net Fixed Assets + CAPEX 7,628,241 6,674,711 5,840,372 5,110,326 Residual Value of Fixed Assets - - - - Depreciable Year 8 8 8 8 Depreciation Expense 953,530 834,339 730,047 638,791 Ending Net Fixed Assets 7,628,241 6,674,711 5,840,372 5,110,326 4,471,535 Accumulated Depreciation 11,775,204 12,728,735 13,563,073 14,293,120 14,931,911 Borrowing & Interest Expense Beginning LT Loan - - - - Change of LT Loan - - - - Ending LT Loan - - - - - Current LT Loan - - - Interest Rate 6.30% 6.30% 6.30% Interest Expense - - - Beginning STL 126,000,000 0 0 0 Change of STL -126,000,000 0 0 0 Ending STL 126,000,000 0 0 0 0 Interest Rate 7.02% 7.02% 7.02% 7.02% Interest Expense 0 0 0 0 Beginning Shareholder Loan - - - - Change of Shareholder Loan 0 0 0 Ending Shareholder Loan - - - - - - Interest Rate 1.00% 1.00% 1.00% Interest Expense - - - Total Annual Interest Expense - - - - Revenue From Product B Revenue From Product A Page 15/15